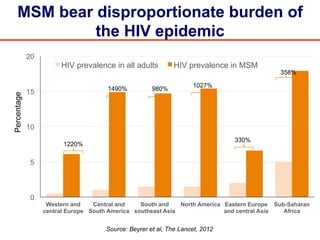
Download as PDF, PPTX

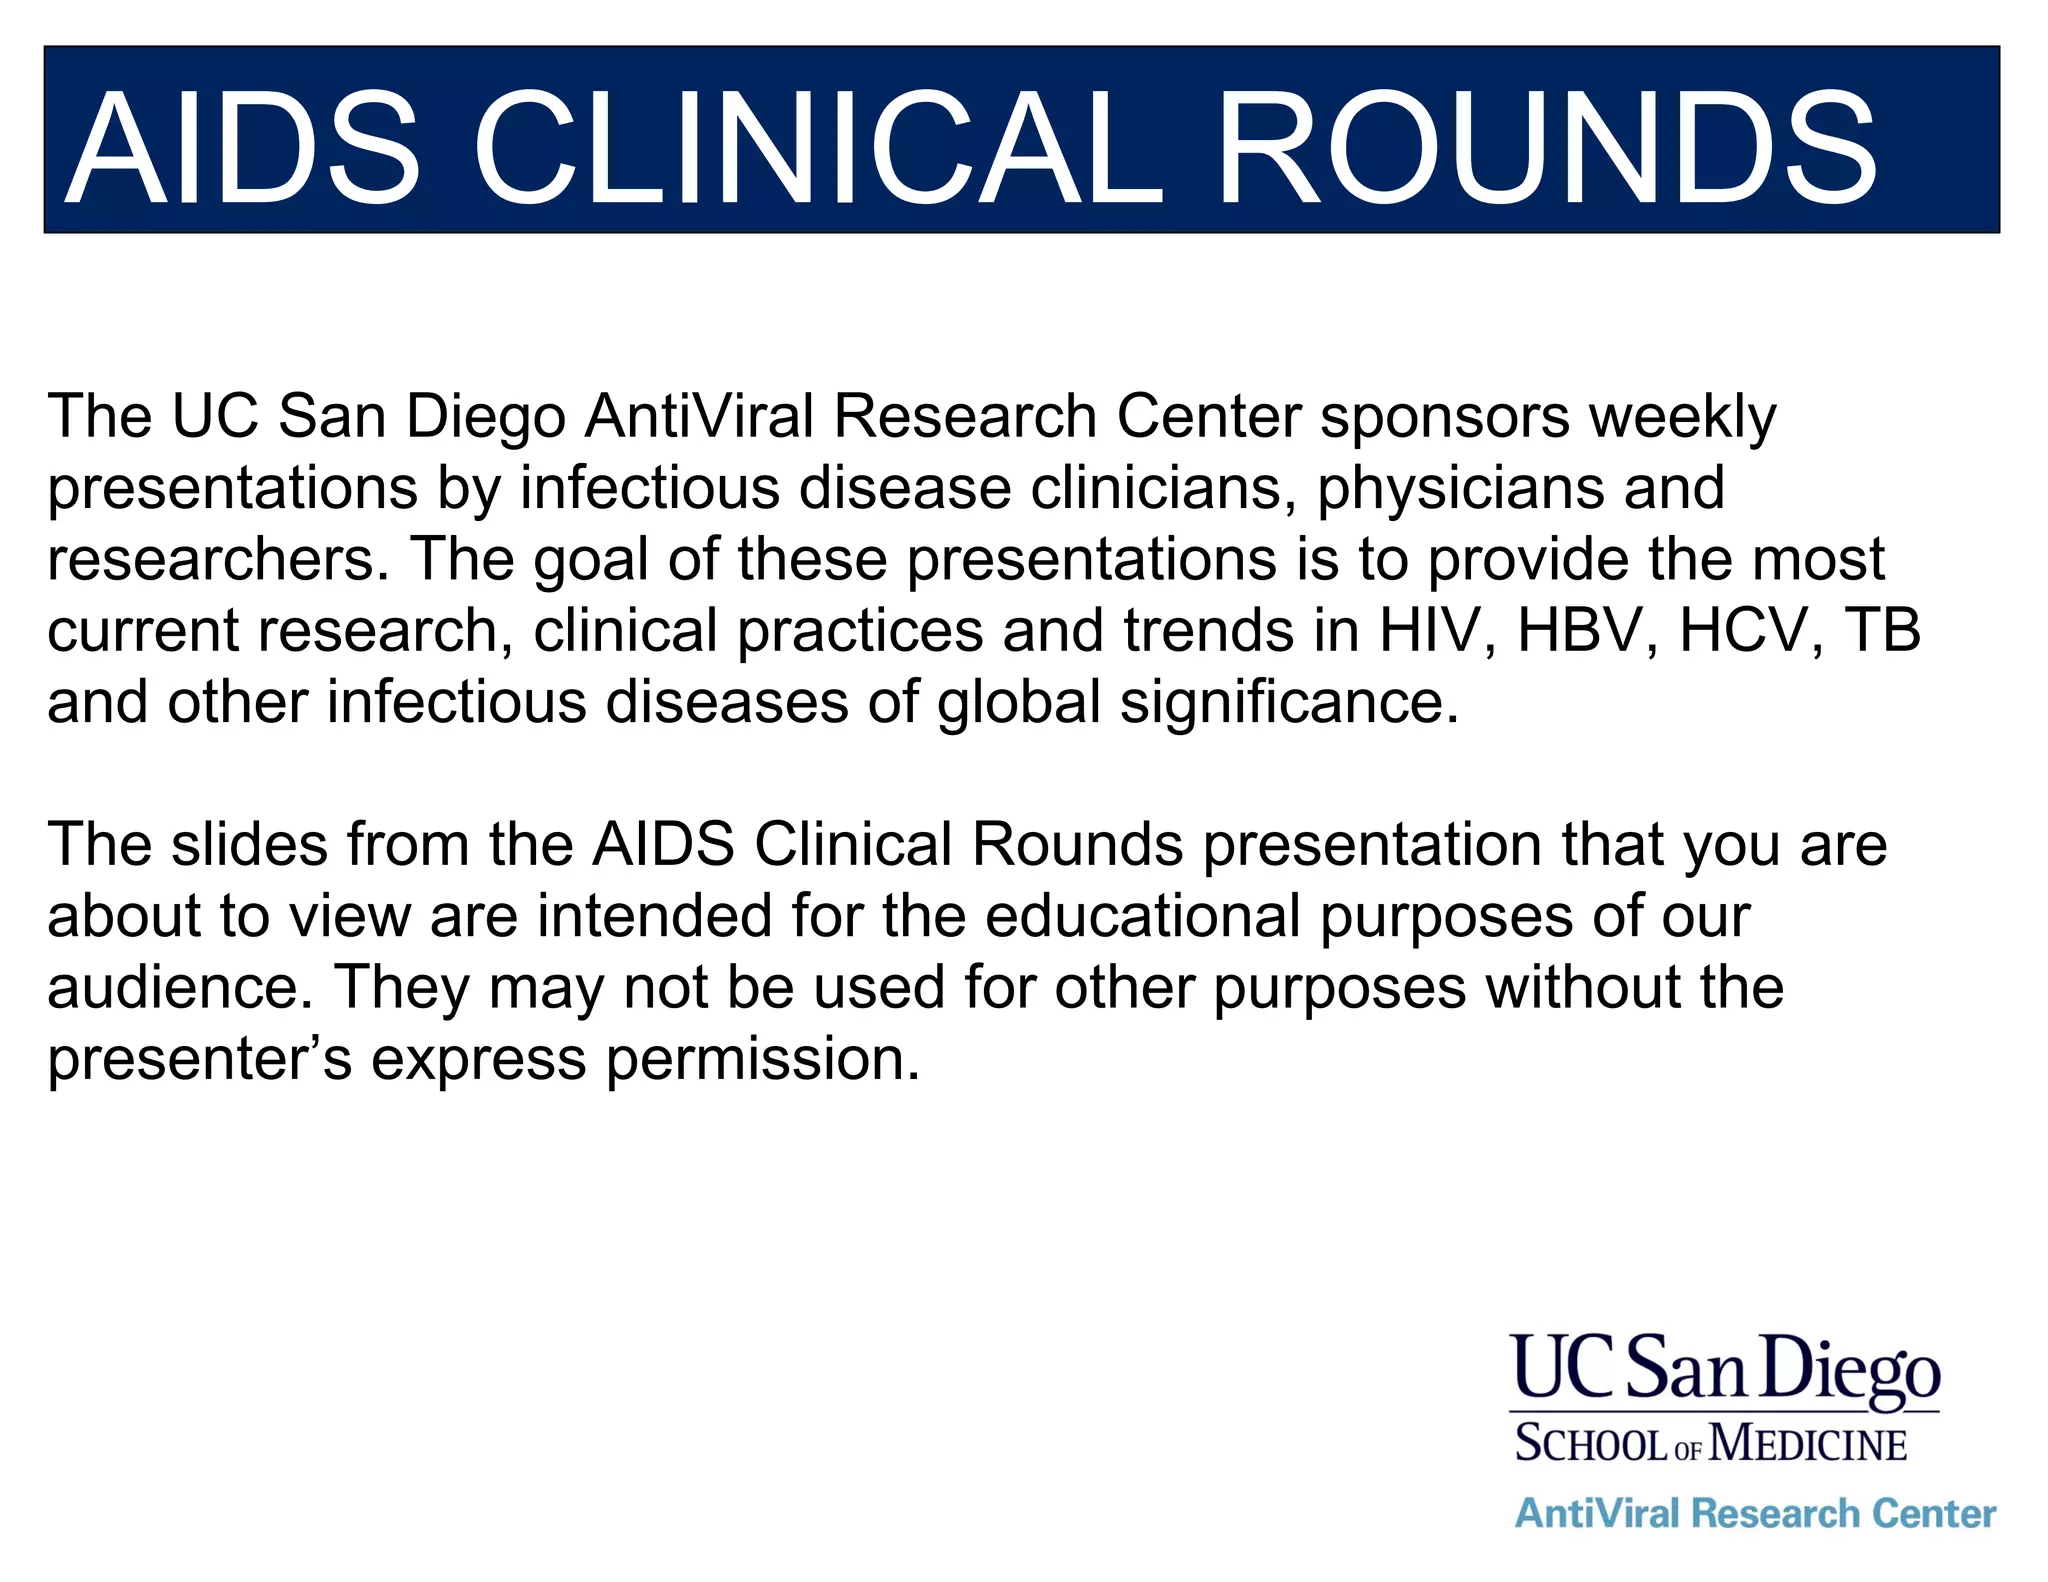
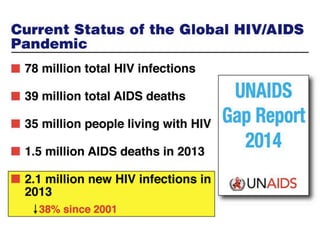
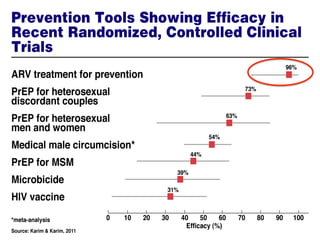
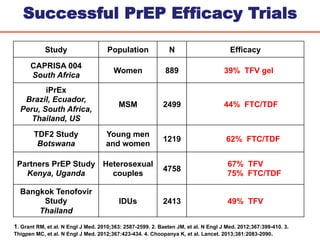
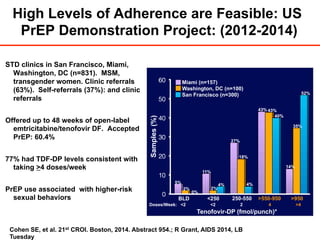


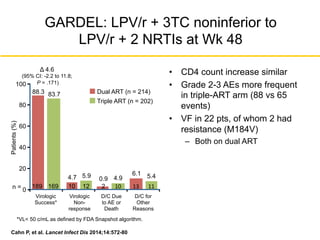
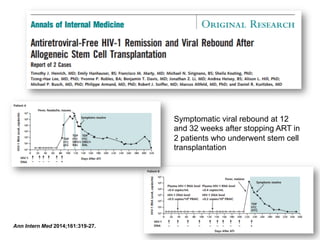
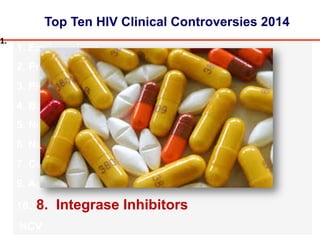
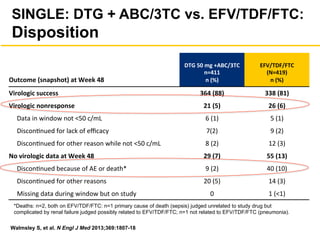
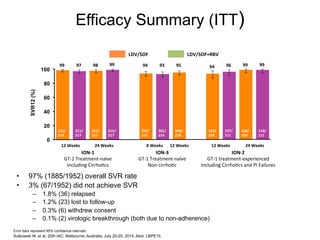
![MODERN: MVC QD + DRV/r Not Noninferior
to TDF/FTC + DRV/r
• Similar rates of VL suppression at Week
48 by screening assay type
Stellbrink H-J, et al. AIDS 2014. Abstract MOAB0101.
MVC + DRV/r (n = 396)
TDF/FTC + DRV/r (n = 401)
100
80
60
40
20
0
Wk
PtsWithHIV-1RNA<50copies/mL[1]
BL 4 8 12 16 20 24 36 48
77.3%
86.8%%
Adjusted treatment difference
(95% Cl): -9.5% (-14.8% to -4.2%)
Assay
Type
MVC + DRV/
r
(n = 396)
TDF/FTC +
DRV/r
(n = 401)
Phenotypic 74.4 87.0
Genotypic 80.7 86.5
Δ (95% CI)
6.9% (1.3% to
15%)](https://image.slidesharecdn.com/aidsclinicalrounds02062016hawkins-150206134656-conversion-gate02/85/Top-Ten-HIV-Clinical-Controversies-2014-35-320.jpg)
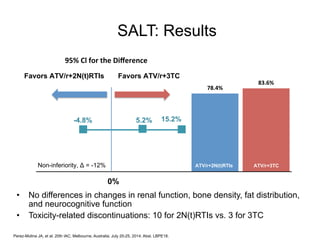
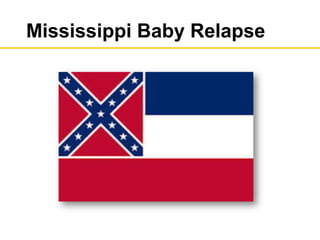
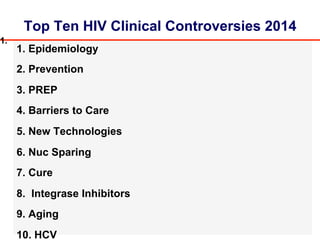
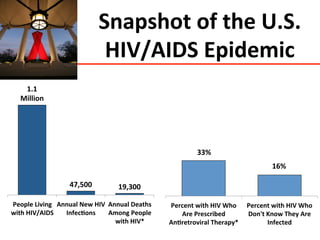
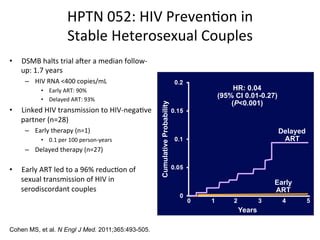
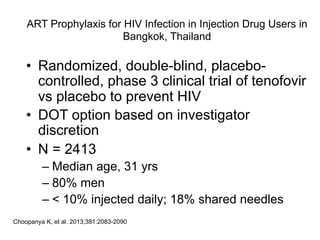
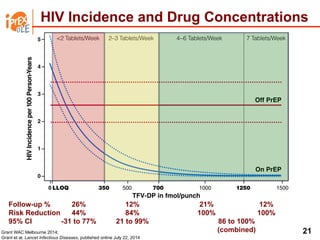
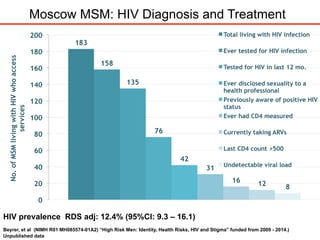
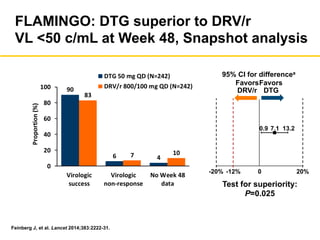
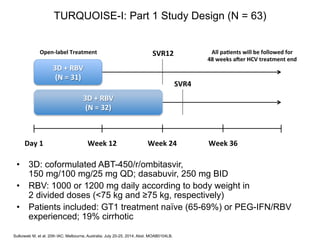
![GS 102: EVG/COBI/TDF/FTC Noninferior to
EFV/TDF/FTC Through Wk 144
1. Sax PE, et al. Lancet. 2012;379:2439-2448.
2. Zolopa A, et al. J Acquir Immune Defic Syndr. 2013;63:96-100.
3. Wohl D, et al. J Acquir Immune Defic Syndr 2014;65:e118-20
Wk
48
Wk
144
EVG/COBI/TDF/FTC
(n = 348)
EFV/TDF/FTC
(n = 352)
80
75
0
20
40
60
80
100
Pa0ents%(%)%
88
84 8482
Wk
96
7 7 6 8 7
10
5
9 9 11 12
15
Wk
48
Wk
144
Wk
96
Wk
48
Wk
144
Wk
96
Virologic Success* Virologic Failure No Data!
95% CI for Difference
Wk 48[1]
Wk 96[2]
Wk 144[3]
-12% 12%0
Favors
EFV
Favors
EVG/COBI
-1.3% 11.1%
4.9%
3.6%
8.8%
2.7%
-1.6%
-2.9%
*](https://image.slidesharecdn.com/aidsclinicalrounds02062016hawkins-150206134656-conversion-gate02/85/Top-Ten-HIV-Clinical-Controversies-2014-47-320.jpg)
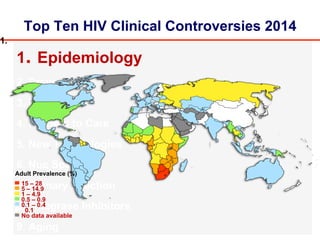
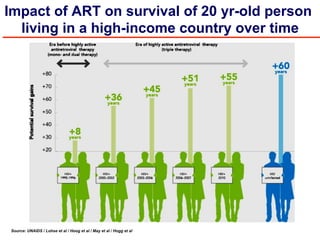
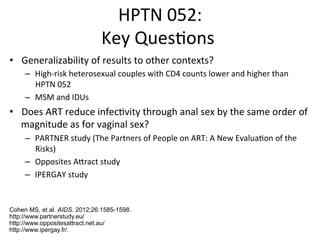
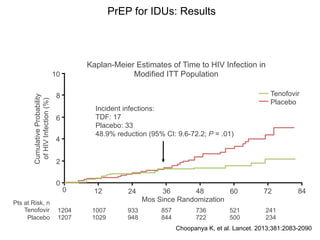
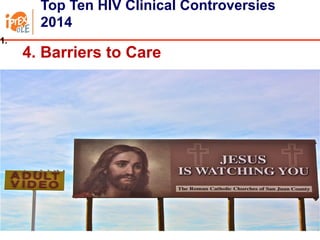
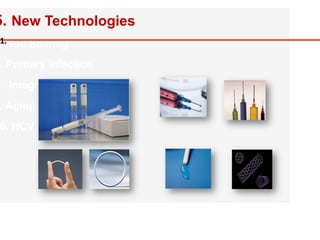
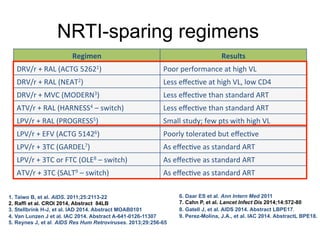
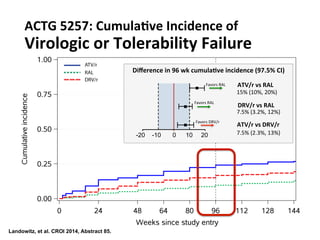
![GS 103: EVG/COBI/TDF/FTC Noninferior to
ATV/r + TDF/FTC Through Wk 144
1. DeJesus E, et al. Lancet. 2012;379:2429-2438.
2. Rockstroh J, et al. J Acquir Immune Defic Syndr. 2013;62:483-486. 3.
Clumeck M, et al. J Acquir Immune Defic Syndr . 2014;65:e121-4.
EVG/COBI/TDF/FTC
(n = 353)
ATV/RTV + TDF/FTC
(n = 355)
78 75
90 87
Patients(%)
Wk
48
Wk
144
0
20
40
60
80
100
Wk
96
Wk
48
Wk
144
Wk
96
Wk
48
Wk
144
Wk
96
Virologic Success* Virologic Failure No Data!
83 82
5 5 57 7 78 8 1010
14
18
95% CI for Difference
-12% 12%0
Favors
ATV/RTV
Favors
EVG/COBI
-3.2% 9.4%
3.1%
2.7%
7.5%
1.1%
6.7%
-2.1%
-4.5%
Wk 48[1]
Wk 96[2]
Wk 144[3]](https://image.slidesharecdn.com/aidsclinicalrounds02062016hawkins-150206134656-conversion-gate02/85/Top-Ten-HIV-Clinical-Controversies-2014-48-320.jpg)
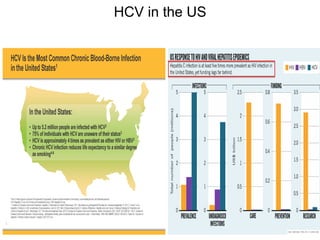

The UC San Diego Antiviral Research Center hosts weekly presentations to discuss current research and clinical practices related to HIV and other infectious diseases. The document highlights key controversies and findings from 2014, including HIV epidemiology, prevention methods, and treatment technologies. It emphasizes the importance of educational resources while providing insight into advancements in HIV care and prevention strategies.


![ONFH[AVN HIP] -TRIPLE REGIME -A NOVAL SURGICAL CONCEPT .pptx](https://cdn.slidesharecdn.com/ss_thumbnails/onfhavnhip2026koaconcalicutdrgokuldevdrmashraf-260210064517-213ec005-thumbnail.jpg?width=640&height=640&fit=bounds)


