Downloaded 151 times
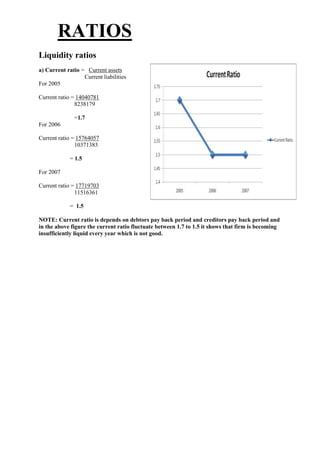


This document provides financial ratio analyses for a company for the years 2005-2007. It includes liquidity ratios like current ratio and quick ratio which were between 1.5-1.7, indicating the company's liquidity was decreasing each year. Solvency ratios like debt to equity and debt to total funds were around 0.05-0.06. Profitability ratios such as gross profit, net profit and operating profit ratios were declining each year from 2005 to 2007, indicating decreasing profit margins. Activity ratios including capital turnover, fixed asset turnover and debtors turnover also showed declining or fluctuating trends over the periods analyzed.