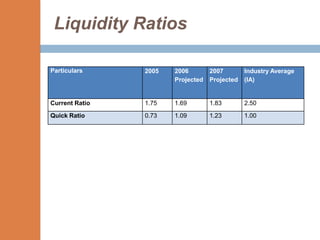
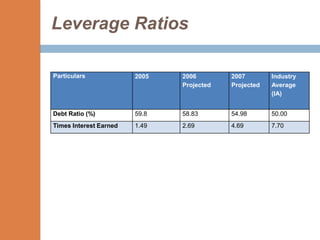
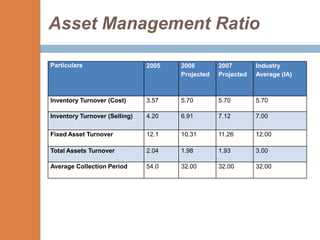
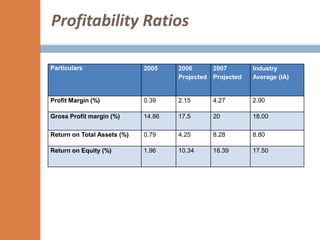
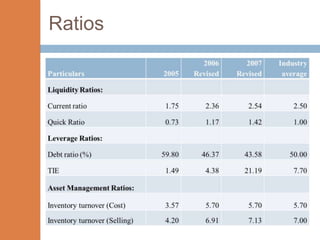
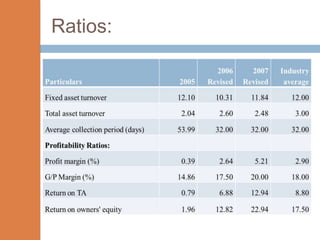
PRESENTATION ON
   SILVER RIVER MANUFACTURING COMPANY


GROUP MEMBERS
Grisha Yadav
Kohinoor Thapaliya
Krishna Chalise
Manisha Baral
Mani Manandhar
Netra Bdr. Khatri
Pawan Kawan
INTRODUCTION OF
             Silver River Manufacturing Company (SRM)

   SRM is a large regional product of farm and utility trailers
    specialized lives stock carriers and mobile home chassis.


   More than 85% of SRM’S sales come from the south eastern
    part of the united state


   SRM is a major client of MCNB.


   SRM whose products are totally based on latest technology and
    it holds several patent with which it can partially offsets some of
    the risk.
Question 1(a)


   Prepare a statement of changes in financial
    position for 2005 (sources and uses of funds
    statement) or complete Table 6.
Table 6: Silver River Manufacturing Company
Statement of Changes in Financial Position Year Ended December 31(thousands of dollars)
 Particulars                                                    2004               2005
 Sources of funds
 Net income after taxes                                     6, 351.70            755.02
 Depreciation                                               1, 657.50          2, 040.00
      Funds from operation                                  8, 009.20          2, 795.02
 Long term loan                                             3, 187.50                 0
 Net decrease in working capital                                                 428.26
       Total sources                                       11, 196.70          3, 223.26
 Application of funds
 Mortgage change                                               267.75            261.38
 Fixed assets change                                        2, 339.62          2, 773.13
 Dividends on stock                                         1, 587.93            188.76
 Net increase in working capital                            7, 001.40                 0
       Total uses                                          11, 196.70          3, 223.27
 Analysis of changes in working capital
 Increase (decrease) in current assets
 Cash change                                               (1, 145.83)           (96.71)
 AR change                                                  1, 364.25         10, 894.86
 INV change                                                14, 095.12         13, 629.75
         CA change                                         14, 313.54          24, 427.9
 Increase(decrease) in current liabilities
 AP change                                                  3, 742.13          9, 492.38
 NP change                                                  1, 912.50          13, 132.5
 ACC change                                                 1, 657.50          2, 231.28
           CL change                                        7, 312.13         24, 856.16
 Net increase(decrease) in working capital                  7, 001.41           (428.26)
Question 1(b)

   Calculate SRM’s key financial ratios for 2005 and
    compare them with those of 2003, 2004, industry
    average, and contract requirement or complete
    Table 7.
Table 7: Silver River Manufacturing Company
                  Ratio Analysis Year Ended December 31

Particulars                   2003    2004    2005    Industry   Comment
                                                      Average
Liquidity ratios:
Current ratio                 3.07    2.68    1.75      2.5         Poor
Quick ratio                   1.66    1.08    0.73       1          OK
Leverage ratios:
Debt ratio(%)                 40.46   46.33   59.8      50       High(Risky)
Times interest earned         15.89   7.97    1.48      7.7      Very Poor
Asset Management
ratios:
Inventory turnover(Cost)      7.14    4.55    3.57      5.7         Poor
Inventory turnover(selling)   9.03    5.59     4.2       7          Poor
Fixed assets turnover         11.58   11.95   12.1      12           Ok
Total asset turnover          3.06     2.6    2.03       3          Low
Average collection period      36     35.99   53.99     32          High
Table 7: Silver River Manufacturing Company
              Ratio Analysis Year Ended December 31

      Particulars          2003     2004     2005     Industry    Comment
                                                      Average

  Profitability ratios
    Profit margin(%)        5.5      3.44     0.38      2.9         Poor
 Gross profit margin(%)    20.89     18.7    14.86       18         Poor
 Return on total assets    16.83     8.95     0.78      8.8         Poor
Return on owners' equity   28.26    16.68     1.95      17.5        Poor
   Potential failure
      indicator:

    Altman Z Factor        3.1130   2.6305   2.0423   1.81/2.99    Zone of
                                                                  ignorance
Question 2


   Based on the case data and the results of your
    analysis in Question 1, what are the SRM,s strengths
    and weakness? What are the causes thereof? (Use
    of the Du Pont system and Altman Z factor would
    facilitate analysis and strength your answer.)
Du pont system

Du pont system - basically designed:
 To improve the overall performance of the firm.

 It’s actually used in order to evaluate the profit
  margin on sales, the assets turnover ratio, and
  the implications of debt interact in order to
  determine the rate of return on equity.
Du pont system

The three most important things which affects ROE
  are as follows:
 Operating efficiency as measured by profit

  margin
 Asset use efficiency as measured by total assets
  turnover
 Financial   leverage as measured by equity
  multiplier
 Weakness in either operating or asset use
  efficiency or both will lead to lower ROE. If ROE
  is unsatisfactory then it will tell us where to start
  looking for the reasons.
DU Pont System:
Particulars Return    =           ×          ×
            On
            Equity
            (R.O.E)

2003       28.29%


2004       16.69%


2005       1.9757%


Industry   17.5%          2.9         3.00
Average
Altman Z factor:
   Z=
Where,
      = working capital/total assets (working capital is current
    assets less current liabilities)
        = retained earnings/total assets
        = earnings before interest and taxes/total assets
       = market value of equity/book value of total debt (market
    value of equity includes both preferred and common shares,
    and debt includes and long term liabilities)
      = sales/total assets.
Altman Z factor:

   Z2003=3.114
   Z2004=2.632
   Z2005=2.044
• Z2003=3.114
• Z2004=2.632
• Z2005=2.044
Strengths of SRM:

   Fixed assets turnover ratio
   Altman Z factor is compatible
Weakness of SRM:

   Profitability Ratios
   Liquidity ratios
   Asset management ratios
   Financial Leverage Ratios
Question 3

   If the bank were to maintain the present credit lines and grant
    an additional $7,012,500 short-term loan at a 16 percent rate of
    interest effective from January 1, 2006, would the company be
    able to retire all short-term loans existing on December 31,
    2006? (Assume that all of White’s plans and predictions
    concerning sales and expenses materialize. In these
    calculations cash is the residual balancing figure, and SRM’s
    tax rate is 48 percent. Assume that SRM pays no cash
    dividends during the year.) Complete tables 9 and 10 included
    as worksheets to facilitate analysis.
Table 9: Silver River Manufacturing Company
                           Pro Forma Income Statements (Projected)
                       Worksheet for Year End 2007 (Thousands of Dollars)
Particulars                                       2005              2006          2007
                                                                Projected     Projected
Net sales                                       215,305          228,223       249,904
Cost of goods sold                              183,307          188,284       199,923
       Gross profit                              31,998           39,939        49,981
Administrative and selling                       18,569           18,258        18,743

Depreciation                                      2,244               2,665      2,006

Miscellaneous expenses                            6,297               3,994      3,124

       Total operating expenses                  27,110           24,917        23,873
       EBIT                                       4,888           15,022        26,108
Interest on short-term loans                      2,006            4,331         4,331

Interest on long-term loans                       1,052               1,052      1,052

Interest on mortgage                               233                 210         189

        Net income before tax                     1,597               9,429     20,536

Taxes                                              767                4,526      9,857

       Net income                                  830                4,903     10,679
Dividends on stock                                 208            -              -
Additions to retained earnings                     622                4,903     10,679
Table 10: Silver River Manufacturing Company
                                     Pro Forma Balance Sheets (Projected)
                               Worksheet for Year End 2007 (Thousands of Dollars)
Particulars                                                   2005              2006        2007
                                                                           Projected    Projected
Assets
Cash                                                         4,296            39,666      49,528
Accounts receivable                                         32,293            20,286      22,214
Inventory                                                   51,324            33,032      35,074
         Current assets                                     87,913            92,984     106,815
Land, building, plant, and equipment                        25,161            32,173      33,139

Accumulated depreciation                                    (7,363)          (10,028)    (10,939)
         Net fixed assets                                   17,798            22,145      22,200
Total assets                                               105,711           115,129     129,015
Liabilities and equities
Short-term bank loans                                       20,056            27,068      27,068
Account payable                                             21,998            17,594      18,474
Accruals                                                     8,064            10,231      12,789
         Current liabilities                                50,118            54,893      58,331
Long-term bank loans                                        10,519            10,519      10,519
Mortgage                                                     2,574             2,314        2,083
         Long-term debt                                     13,093            12,833      12,602
           Total liabilities                                63,211            67,726      70,933
Common stock                                                25,596            25,596      25,596
Retained earnings                                           16,904            21,807      32,486
           Owners’ equity                                   42,500            47,403      58,082
Total capital                                              105,711           115,129     129,015
   Projected cash balance on 2006 = $39666400
   Projected short term loan = $27068000
   Difference = $12598400
   Minimum cash balance to be maintained =
    5% of projected sales of 2006 = $11411165
   Hence, company cash balance is adequate
    for the payment of the short term loan.
   Also the company is able to retire all short
    term loan existing on Dec 31, 2006 with the
    maintenance of present credit lines and grant
    a $7012500 short term loan
Question 4

   Compute projected financial ratios for 2006 and
    2007 (or complete Table 11). Compare these
    ratios with 2005 along with industry average and
    analyze improvement or deterioration in financial
    condition
Liquidity Ratios

Particulars     2005   2006        2007        Industry Average
                       Projected   Projected   (IA)


Current Ratio   1.75   1.69        1.83        2.50

Quick Ratio     0.73   1.09        1.23        1.00
Leverage Ratios

Particulars             2005   2006        2007        Industry
                               Projected   Projected   Average
                                                       (IA)


Debt Ratio (%)          59.8   58.83       54.98       50.00
Times Interest Earned   1.49   2.69        4.69        7.70
Asset Management Ratio

Particulars                    2005   2006        2007        Industry
                                      Projected   Projected   Average (IA)


Inventory Turnover (Cost)      3.57   5.70        5.70        5.70

Inventory Turnover (Selling)   4.20   6.91        7.12        7.00

Fixed Asset Turnover           12.1   10.31       11.26       12.00

Total Assets Turnover          2.04   1.98        1.93        3.00

Average Collection Period      54.0   32.00       32.00       32.00
Profitability Ratios

Particulars                  2005    2006      2007        Industry
                                     Projected Projected   Average (IA)


Profit Margin (%)            0.39    2.15      4.27        2.90

Gross Profit margin (%)      14.86   17.5      20          18.00

Return on Total Assets (%)   0.79    4.25      8.28        8.80

Return on Equity (%)         1.96    10.34     18.39       17.50
Interpretation
   In comparison of SRM projected financial
    ratios of year 2006 and 2007 with
    financial ratios of 2005, the financial
    position of SRM is improved.

   In comparison of SRM projected financial
    ratios of year 2006 and 2007 with
    industry average, the financial position of
    SRM is deteriorated.
Question 5
   If all short-term bank loans are repaid towards the end of the
    first half of 2006, do you think that company is still able to pay
    regular dividends and maintain minimum cash balance?
    Revise the tables 9, 10, 11 (or complete the tables 12, 13 and
    14). Do you find any situations developing that may indicate
    poor financial policy? What should be the impact of such
    situations on the ratios for the company, and are such impacts
    necessarily either good or bad? Why?
Assumption in Table 9, 10 and 11
   Sales Growth: 6% in 2006 and 9.5% in 2007
   COGS: 82.5% in 2006 and 80% in 2007 of sales
   Administrative and selling Expenses: 6% in 2006
    and 9.5% in 2007 of sales
   Miscellaneous Expenses: 8% in 2006 and 7.5%
    in 2007 of sales
   Average collection Period: 32days (Industry
    Level)
Assumption in Table 9, 10 and 11
   Average Industry Level: 5.7 (Industry Level)
   No changes in level of Interest Rates over two
    year period
   Tax: 48% of Net Income before tax
   MCNB will charge 16% for the short term loan
   Dividend: 25% of Net Income (through back
    dated calculation)
Comparison of Cash Balance
25000
                                22263       Amount in ‘000


20000


15000
                12217   12495
        11411                           Minimum Balance
10000                                   Actual Balance


 5000


    0
           2006          2007
Ratios
Ratios:
Question 6: Solution
On the basis of our analyses company's forecasted future market
growth is favorable.


Demanding immediate repayment won’t be in the best interest for
both the company and the bank.


The bank should extend the existing short and long term loans
without granting the additional loan.
Analysis of following ratio shows that
option B is better

  Debt ratio
- It determines the degree of company relying on
outside fund.
Cont…
   Times Interest Earned ratio
   It is the measure of the company’s ability to make interest
    payments on time


                                                  Current ratio
 It shows how much of current assets it has to pay the current
liabilities.
Cont…
   Quick Ratio
   The company ability to meet the short term debts without
    having to sell off receivables


                                                     Profit Margin
   It shows how much profit the firm is earning to know that it can
    pay the short term and long term loan easily or not.
The conditions/safe guards the bank
should impose to protect itself on the
loans are listed below

   Security
   Mortgage
   Guarantee
   Loan Covenants
       •   Restriction on Disposal of Certain Assets
       •   Barring or Limiting the Grant of Dividend
       •   Requiring A Minimum Net Worth Of The Business
       •   Limitation on Use of The Funds Loaned
   Monitoring
   Insurance
Question 7
   If the bank decides to withdraw the entire line of
    credit and to demand immediate repayment of the
    two existing loans, what alternatives would be open
    to SRM?
Solution:
   Converting the cash equivalent assets into cash which
    includes:

   Decreasing Account Receivable:
   Minimize Inventory:
   Delay Accounts Payable Period:
   Minimum cash balance policy:
   Selling/Issue of Common Stock:
   Hold back dividend Payment:
   Sale of Assets:
Lesson Learnt
   To analyzed the case of the company.
   To calculate the financial ratios and know
    its interpretation
   Learn to compare the financial ratios with
    industry average
   Learn to compute and analysed du pont
    system
Silver river manufacturing company

Silver river manufacturing company

  • 1.
    PRESENTATION ON SILVER RIVER MANUFACTURING COMPANY GROUP MEMBERS Grisha Yadav Kohinoor Thapaliya Krishna Chalise Manisha Baral Mani Manandhar Netra Bdr. Khatri Pawan Kawan
  • 2.
    INTRODUCTION OF Silver River Manufacturing Company (SRM)  SRM is a large regional product of farm and utility trailers specialized lives stock carriers and mobile home chassis.  More than 85% of SRM’S sales come from the south eastern part of the united state  SRM is a major client of MCNB.  SRM whose products are totally based on latest technology and it holds several patent with which it can partially offsets some of the risk.
  • 3.
    Question 1(a)  Prepare a statement of changes in financial position for 2005 (sources and uses of funds statement) or complete Table 6.
  • 4.
    Table 6: SilverRiver Manufacturing Company Statement of Changes in Financial Position Year Ended December 31(thousands of dollars) Particulars 2004 2005 Sources of funds Net income after taxes 6, 351.70 755.02 Depreciation 1, 657.50 2, 040.00 Funds from operation 8, 009.20 2, 795.02 Long term loan 3, 187.50 0 Net decrease in working capital 428.26 Total sources 11, 196.70 3, 223.26 Application of funds Mortgage change 267.75 261.38 Fixed assets change 2, 339.62 2, 773.13 Dividends on stock 1, 587.93 188.76 Net increase in working capital 7, 001.40 0 Total uses 11, 196.70 3, 223.27 Analysis of changes in working capital Increase (decrease) in current assets Cash change (1, 145.83) (96.71) AR change 1, 364.25 10, 894.86 INV change 14, 095.12 13, 629.75 CA change 14, 313.54 24, 427.9 Increase(decrease) in current liabilities AP change 3, 742.13 9, 492.38 NP change 1, 912.50 13, 132.5 ACC change 1, 657.50 2, 231.28 CL change 7, 312.13 24, 856.16 Net increase(decrease) in working capital 7, 001.41 (428.26)
  • 5.
    Question 1(b)  Calculate SRM’s key financial ratios for 2005 and compare them with those of 2003, 2004, industry average, and contract requirement or complete Table 7.
  • 6.
    Table 7: SilverRiver Manufacturing Company Ratio Analysis Year Ended December 31 Particulars 2003 2004 2005 Industry Comment Average Liquidity ratios: Current ratio 3.07 2.68 1.75 2.5 Poor Quick ratio 1.66 1.08 0.73 1 OK Leverage ratios: Debt ratio(%) 40.46 46.33 59.8 50 High(Risky) Times interest earned 15.89 7.97 1.48 7.7 Very Poor Asset Management ratios: Inventory turnover(Cost) 7.14 4.55 3.57 5.7 Poor Inventory turnover(selling) 9.03 5.59 4.2 7 Poor Fixed assets turnover 11.58 11.95 12.1 12 Ok Total asset turnover 3.06 2.6 2.03 3 Low Average collection period 36 35.99 53.99 32 High
  • 7.
    Table 7: SilverRiver Manufacturing Company Ratio Analysis Year Ended December 31 Particulars 2003 2004 2005 Industry Comment Average Profitability ratios Profit margin(%) 5.5 3.44 0.38 2.9 Poor Gross profit margin(%) 20.89 18.7 14.86 18 Poor Return on total assets 16.83 8.95 0.78 8.8 Poor Return on owners' equity 28.26 16.68 1.95 17.5 Poor Potential failure indicator: Altman Z Factor 3.1130 2.6305 2.0423 1.81/2.99 Zone of ignorance
  • 8.
    Question 2  Based on the case data and the results of your analysis in Question 1, what are the SRM,s strengths and weakness? What are the causes thereof? (Use of the Du Pont system and Altman Z factor would facilitate analysis and strength your answer.)
  • 9.
    Du pont system Dupont system - basically designed:  To improve the overall performance of the firm.  It’s actually used in order to evaluate the profit margin on sales, the assets turnover ratio, and the implications of debt interact in order to determine the rate of return on equity.
  • 10.
    Du pont system Thethree most important things which affects ROE are as follows:  Operating efficiency as measured by profit margin  Asset use efficiency as measured by total assets turnover  Financial leverage as measured by equity multiplier  Weakness in either operating or asset use efficiency or both will lead to lower ROE. If ROE is unsatisfactory then it will tell us where to start looking for the reasons.
  • 11.
    DU Pont System: ParticularsReturn = × × On Equity (R.O.E) 2003 28.29% 2004 16.69% 2005 1.9757% Industry 17.5% 2.9 3.00 Average
  • 12.
    Altman Z factor:  Z= Where,  = working capital/total assets (working capital is current assets less current liabilities)  = retained earnings/total assets  = earnings before interest and taxes/total assets  = market value of equity/book value of total debt (market value of equity includes both preferred and common shares, and debt includes and long term liabilities)  = sales/total assets.
  • 13.
    Altman Z factor:  Z2003=3.114  Z2004=2.632  Z2005=2.044
  • 15.
  • 16.
    Strengths of SRM:  Fixed assets turnover ratio  Altman Z factor is compatible
  • 17.
    Weakness of SRM:  Profitability Ratios  Liquidity ratios  Asset management ratios  Financial Leverage Ratios
  • 18.
    Question 3  If the bank were to maintain the present credit lines and grant an additional $7,012,500 short-term loan at a 16 percent rate of interest effective from January 1, 2006, would the company be able to retire all short-term loans existing on December 31, 2006? (Assume that all of White’s plans and predictions concerning sales and expenses materialize. In these calculations cash is the residual balancing figure, and SRM’s tax rate is 48 percent. Assume that SRM pays no cash dividends during the year.) Complete tables 9 and 10 included as worksheets to facilitate analysis.
  • 19.
    Table 9: SilverRiver Manufacturing Company Pro Forma Income Statements (Projected) Worksheet for Year End 2007 (Thousands of Dollars) Particulars 2005 2006 2007 Projected Projected Net sales 215,305 228,223 249,904 Cost of goods sold 183,307 188,284 199,923 Gross profit 31,998 39,939 49,981 Administrative and selling 18,569 18,258 18,743 Depreciation 2,244 2,665 2,006 Miscellaneous expenses 6,297 3,994 3,124 Total operating expenses 27,110 24,917 23,873 EBIT 4,888 15,022 26,108 Interest on short-term loans 2,006 4,331 4,331 Interest on long-term loans 1,052 1,052 1,052 Interest on mortgage 233 210 189 Net income before tax 1,597 9,429 20,536 Taxes 767 4,526 9,857 Net income 830 4,903 10,679 Dividends on stock 208 - - Additions to retained earnings 622 4,903 10,679
  • 20.
    Table 10: SilverRiver Manufacturing Company Pro Forma Balance Sheets (Projected) Worksheet for Year End 2007 (Thousands of Dollars) Particulars 2005 2006 2007 Projected Projected Assets Cash 4,296 39,666 49,528 Accounts receivable 32,293 20,286 22,214 Inventory 51,324 33,032 35,074 Current assets 87,913 92,984 106,815 Land, building, plant, and equipment 25,161 32,173 33,139 Accumulated depreciation (7,363) (10,028) (10,939) Net fixed assets 17,798 22,145 22,200 Total assets 105,711 115,129 129,015 Liabilities and equities Short-term bank loans 20,056 27,068 27,068 Account payable 21,998 17,594 18,474 Accruals 8,064 10,231 12,789 Current liabilities 50,118 54,893 58,331 Long-term bank loans 10,519 10,519 10,519 Mortgage 2,574 2,314 2,083 Long-term debt 13,093 12,833 12,602 Total liabilities 63,211 67,726 70,933 Common stock 25,596 25,596 25,596 Retained earnings 16,904 21,807 32,486 Owners’ equity 42,500 47,403 58,082 Total capital 105,711 115,129 129,015
  • 21.
    Projected cash balance on 2006 = $39666400  Projected short term loan = $27068000  Difference = $12598400  Minimum cash balance to be maintained = 5% of projected sales of 2006 = $11411165  Hence, company cash balance is adequate for the payment of the short term loan.  Also the company is able to retire all short term loan existing on Dec 31, 2006 with the maintenance of present credit lines and grant a $7012500 short term loan
  • 22.
    Question 4  Compute projected financial ratios for 2006 and 2007 (or complete Table 11). Compare these ratios with 2005 along with industry average and analyze improvement or deterioration in financial condition
  • 23.
    Liquidity Ratios Particulars 2005 2006 2007 Industry Average Projected Projected (IA) Current Ratio 1.75 1.69 1.83 2.50 Quick Ratio 0.73 1.09 1.23 1.00
  • 24.
    Leverage Ratios Particulars 2005 2006 2007 Industry Projected Projected Average (IA) Debt Ratio (%) 59.8 58.83 54.98 50.00 Times Interest Earned 1.49 2.69 4.69 7.70
  • 25.
    Asset Management Ratio Particulars 2005 2006 2007 Industry Projected Projected Average (IA) Inventory Turnover (Cost) 3.57 5.70 5.70 5.70 Inventory Turnover (Selling) 4.20 6.91 7.12 7.00 Fixed Asset Turnover 12.1 10.31 11.26 12.00 Total Assets Turnover 2.04 1.98 1.93 3.00 Average Collection Period 54.0 32.00 32.00 32.00
  • 26.
    Profitability Ratios Particulars 2005 2006 2007 Industry Projected Projected Average (IA) Profit Margin (%) 0.39 2.15 4.27 2.90 Gross Profit margin (%) 14.86 17.5 20 18.00 Return on Total Assets (%) 0.79 4.25 8.28 8.80 Return on Equity (%) 1.96 10.34 18.39 17.50
  • 27.
    Interpretation  In comparison of SRM projected financial ratios of year 2006 and 2007 with financial ratios of 2005, the financial position of SRM is improved.  In comparison of SRM projected financial ratios of year 2006 and 2007 with industry average, the financial position of SRM is deteriorated.
  • 28.
    Question 5  If all short-term bank loans are repaid towards the end of the first half of 2006, do you think that company is still able to pay regular dividends and maintain minimum cash balance? Revise the tables 9, 10, 11 (or complete the tables 12, 13 and 14). Do you find any situations developing that may indicate poor financial policy? What should be the impact of such situations on the ratios for the company, and are such impacts necessarily either good or bad? Why?
  • 29.
    Assumption in Table9, 10 and 11  Sales Growth: 6% in 2006 and 9.5% in 2007  COGS: 82.5% in 2006 and 80% in 2007 of sales  Administrative and selling Expenses: 6% in 2006 and 9.5% in 2007 of sales  Miscellaneous Expenses: 8% in 2006 and 7.5% in 2007 of sales  Average collection Period: 32days (Industry Level)
  • 30.
    Assumption in Table9, 10 and 11  Average Industry Level: 5.7 (Industry Level)  No changes in level of Interest Rates over two year period  Tax: 48% of Net Income before tax  MCNB will charge 16% for the short term loan  Dividend: 25% of Net Income (through back dated calculation)
  • 31.
    Comparison of CashBalance 25000 22263 Amount in ‘000 20000 15000 12217 12495 11411 Minimum Balance 10000 Actual Balance 5000 0 2006 2007
  • 32.
  • 33.
  • 34.
    Question 6: Solution Onthe basis of our analyses company's forecasted future market growth is favorable. Demanding immediate repayment won’t be in the best interest for both the company and the bank. The bank should extend the existing short and long term loans without granting the additional loan.
  • 35.
    Analysis of followingratio shows that option B is better  Debt ratio - It determines the degree of company relying on outside fund.
  • 36.
    Cont…  Times Interest Earned ratio  It is the measure of the company’s ability to make interest payments on time Current ratio It shows how much of current assets it has to pay the current liabilities.
  • 37.
    Cont…  Quick Ratio  The company ability to meet the short term debts without having to sell off receivables  Profit Margin  It shows how much profit the firm is earning to know that it can pay the short term and long term loan easily or not.
  • 38.
    The conditions/safe guardsthe bank should impose to protect itself on the loans are listed below  Security  Mortgage  Guarantee  Loan Covenants • Restriction on Disposal of Certain Assets • Barring or Limiting the Grant of Dividend • Requiring A Minimum Net Worth Of The Business • Limitation on Use of The Funds Loaned  Monitoring  Insurance
  • 39.
    Question 7  If the bank decides to withdraw the entire line of credit and to demand immediate repayment of the two existing loans, what alternatives would be open to SRM?
  • 40.
    Solution:  Converting the cash equivalent assets into cash which includes:  Decreasing Account Receivable:  Minimize Inventory:  Delay Accounts Payable Period:  Minimum cash balance policy:  Selling/Issue of Common Stock:  Hold back dividend Payment:  Sale of Assets:
  • 41.
    Lesson Learnt  To analyzed the case of the company.  To calculate the financial ratios and know its interpretation  Learn to compare the financial ratios with industry average  Learn to compute and analysed du pont system