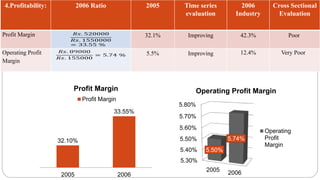
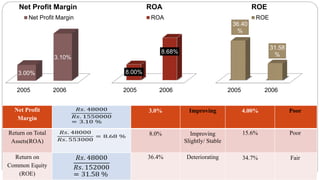
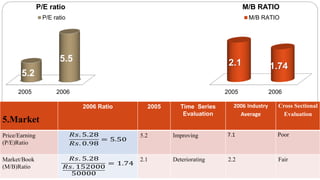
Integrative Case
Track Software Ltd
INTRODUCTION
We are going to talk about a software firm that the owner Stanley
started with Rs.1,00,000 from his savings of Rs.50,000 as equity and
Rs.50,000 long-term loan from the bank. He tried to develop a cost-
accounting program and for that he had to hire a software developer to
complete the package.
(a) Upon what financial goal does Stanley seem to be
focusing? Is it the correct goal? Why or why not?
Stanley’s focus is on maximizing profits. This is the correct goal because the goal of
any firm, and therefore its financial manager should be to maximize it’s value and by
extension the wealth of the shareholders. There is potential for an agency
problem(conflict between company`s management and shareholders) if Stanley
decides to go ahead and invest in the software developer. It will cause a temporary
decrease in the earnings per share which will means fewer earnings at the present time
for stakeholders.
Years EPS
2000
2001
2002
2003
2004
2005
2006
Earnings per share =
0
0.4
0.3
0.7
0.8 0.86
0.96
2000 2001 2002 2003 2004 2005 2006
Earning per share (EPS)
EPS show a steady increase over the past six years indicating that Stanley is achieving his goal of maximizing profit.
(c) operating cash flow (OCF) & free cash flow(FCF) in 2006.
Operating Cash Flow (OCF) for 2006
OCF = {Earnings before Interest and Taxes× (1 – Tax rate)} + Depreciation}
So, OCF = {EBIT × (1 – T)} + Depreciation
= {Rs. 89000 × (1 - 0.20)} + Rs. 11000
= Rs.822000
Free Cash Flow (FCF) for 2006
Here,
FCF = OCF – Net Fixed Assets Investments (NFAI)-Net Current Assets Investment
(NCAI)
So, FCF = OCF – NFAI– NCAI
NFAI = Change in net fixed assets + Depreciation
= (Rs.132000 – Rs.128000) + Rs.11000
= Rs.15000
NCAI = Chance in current assets – Change in (Accounts Payable + Accruals)
= (Rs.421000 - Rs.362000) - (Rs.136000+ Rs. 126000) – (Rs.27000 + Rs.25000)
=Rs.47000
FCF = Rs. (822000 - 15000 – 47000)
= Rs. 202000
Comment:
Both the operating cash flow and the free cash flow are positive indicating that Stanley
was able to generate adequate cash flow to cover both operating expenses and
investments in assets.
(d) Analyze the firm’s financial condition in 2006 as it relates to
1.liquidity 2.activity 3. debt 4. profitability 5.market, using the
financial statement provided in tables 2&3 and the ratio data
included in table . Evaluate the firm on both a cross-sectional and a
time-series basis. ?????????
2006 Ratio 2005 Time series
evaluation
Industry
2006
Cross
Sectional
Evaluation
Current Ratio 1.06 Improving 1.82 Poor
Quick Ratio 0.63 Steady 1.10 Poor
1. Liquidity:
2005 2006
1.06
1.16
Current Ratio
Current Ratio
2005 2006
0.63 0.63
Quick Ratio
Quick Ratio
2. Activity: 2006 Ratio 2005 Time series
evaluation
2006
Industry
Cross
Sectional
Evaluation
Inventory
Turnover
10.40 Deteriorating 12.45 Very Poor
Average Period
Collection
29.6 Deteriorating 20.2 Poor
Total Assets
Turnover
2.66 Improving 3.92 Poor
Comment:
The total asset turnover of the firm has improved but the inventory turnover and average
collection period has deteriorated.
10.4
5.39
29.6
35.79
2.66
2.8
Chart Title
Inventory Turnover Average Total Assets Turnover
3.Dept:
2006 Ratio 2005 Time series
evaluation
Industry
2006
Cross
Sectional
Evaluation
Debt Ratio 0.78 Decreasing 0.55 Poor
Time Interest
Earned Ratio
3.00 Fairly Steady 5.6 Poor
Comment:
The debt ratio decreased in the times interest earned ratio improved. This indicates
that the firm used more of its own money to generate profit in 2006 (rather than
that of its creditors) and its ability to make contractual interest payments has
improved. However, the firm fails to measure up to the industrial average yet
again.
4.Profitability: 2006 Ratio 2005 Time series
evaluation
2006
Industry
Cross Sectional
Evaluation
Profit Margin 32.1% Improving 42.3% Poor
Operating Profit
Margin
5.5% Improving 12.4% Very Poor
32.10%
33.55%
2005 2006
Profit Margin
Profit Margin
5.30%
5.40%
5.50%
5.60%
5.70%
5.80%
2005 2006
5.50%
5.74%
Operating Profit Margin
Operating
Profit
Margin
Net Profit
Margin
3.0% Improving 4.00% Poor
Return on Total
Assets(ROA)
8.0% Improving
Slightly/ Stable
15.6% Poor
Return on
Common Equity
(ROE)
36.4% Deteriorating 34.7% Fair
2005 2006
3.00%
3.10%
Net Profit Margin
Net Profit Margin
2005 2006
8.00%
8.68%
ROA
ROA
2005 2006
36.40
%
31.58
%
ROE
ROE
2006 Ratio 2005 Time Series
Evaluation
2006 Industry
Average
Cross Sectional
Evaluation
Price/Earning
(P/E)Ratio
5.2 Improving 7.1 Poor
Market/Book
(M/B)Ratio
2.1 Deteriorating 2.2 Fair
5.Market
2005 2006
5.2
5.5
P/E ratio
P/E ratio
2005 2006
2.1 1.74
M/B RATIO
M/B RATIO
conclusion
Stanley should try to find the money to hire the software developer since the ratios show
that the firm should be performing better for a firm in this particular industry. In addition,
the “Blockbuster” sales potential implies a potential for increased profitability which
falls in line with Stanley’s focus.
Any Question

presentation on Integrative Case of Track Software Ltd

  • 1.
  • 2.
    INTRODUCTION We are goingto talk about a software firm that the owner Stanley started with Rs.1,00,000 from his savings of Rs.50,000 as equity and Rs.50,000 long-term loan from the bank. He tried to develop a cost- accounting program and for that he had to hire a software developer to complete the package.
  • 3.
    (a) Upon whatfinancial goal does Stanley seem to be focusing? Is it the correct goal? Why or why not? Stanley’s focus is on maximizing profits. This is the correct goal because the goal of any firm, and therefore its financial manager should be to maximize it’s value and by extension the wealth of the shareholders. There is potential for an agency problem(conflict between company`s management and shareholders) if Stanley decides to go ahead and invest in the software developer. It will cause a temporary decrease in the earnings per share which will means fewer earnings at the present time for stakeholders.
  • 4.
  • 5.
    0 0.4 0.3 0.7 0.8 0.86 0.96 2000 20012002 2003 2004 2005 2006 Earning per share (EPS) Earning per share (EPS) EPS show a steady increase over the past six years indicating that Stanley is achieving his goal of maximizing profit.
  • 6.
    (c) operating cashflow (OCF) & free cash flow(FCF) in 2006. Operating Cash Flow (OCF) for 2006 OCF = {Earnings before Interest and Taxes× (1 – Tax rate)} + Depreciation} So, OCF = {EBIT × (1 – T)} + Depreciation = {Rs. 89000 × (1 - 0.20)} + Rs. 11000 = Rs.822000
  • 7.
    Free Cash Flow(FCF) for 2006 Here, FCF = OCF – Net Fixed Assets Investments (NFAI)-Net Current Assets Investment (NCAI) So, FCF = OCF – NFAI– NCAI NFAI = Change in net fixed assets + Depreciation = (Rs.132000 – Rs.128000) + Rs.11000 = Rs.15000 NCAI = Chance in current assets – Change in (Accounts Payable + Accruals) = (Rs.421000 - Rs.362000) - (Rs.136000+ Rs. 126000) – (Rs.27000 + Rs.25000) =Rs.47000 FCF = Rs. (822000 - 15000 – 47000) = Rs. 202000
  • 8.
    Comment: Both the operatingcash flow and the free cash flow are positive indicating that Stanley was able to generate adequate cash flow to cover both operating expenses and investments in assets.
  • 9.
    (d) Analyze thefirm’s financial condition in 2006 as it relates to 1.liquidity 2.activity 3. debt 4. profitability 5.market, using the financial statement provided in tables 2&3 and the ratio data included in table . Evaluate the firm on both a cross-sectional and a time-series basis. ?????????
  • 10.
    2006 Ratio 2005Time series evaluation Industry 2006 Cross Sectional Evaluation Current Ratio 1.06 Improving 1.82 Poor Quick Ratio 0.63 Steady 1.10 Poor 1. Liquidity: 2005 2006 1.06 1.16 Current Ratio Current Ratio 2005 2006 0.63 0.63 Quick Ratio Quick Ratio
  • 11.
    2. Activity: 2006Ratio 2005 Time series evaluation 2006 Industry Cross Sectional Evaluation Inventory Turnover 10.40 Deteriorating 12.45 Very Poor Average Period Collection 29.6 Deteriorating 20.2 Poor Total Assets Turnover 2.66 Improving 3.92 Poor
  • 12.
    Comment: The total assetturnover of the firm has improved but the inventory turnover and average collection period has deteriorated. 10.4 5.39 29.6 35.79 2.66 2.8 Chart Title Inventory Turnover Average Total Assets Turnover
  • 13.
    3.Dept: 2006 Ratio 2005Time series evaluation Industry 2006 Cross Sectional Evaluation Debt Ratio 0.78 Decreasing 0.55 Poor Time Interest Earned Ratio 3.00 Fairly Steady 5.6 Poor
  • 14.
    Comment: The debt ratiodecreased in the times interest earned ratio improved. This indicates that the firm used more of its own money to generate profit in 2006 (rather than that of its creditors) and its ability to make contractual interest payments has improved. However, the firm fails to measure up to the industrial average yet again.
  • 15.
    4.Profitability: 2006 Ratio2005 Time series evaluation 2006 Industry Cross Sectional Evaluation Profit Margin 32.1% Improving 42.3% Poor Operating Profit Margin 5.5% Improving 12.4% Very Poor 32.10% 33.55% 2005 2006 Profit Margin Profit Margin 5.30% 5.40% 5.50% 5.60% 5.70% 5.80% 2005 2006 5.50% 5.74% Operating Profit Margin Operating Profit Margin
  • 16.
    Net Profit Margin 3.0% Improving4.00% Poor Return on Total Assets(ROA) 8.0% Improving Slightly/ Stable 15.6% Poor Return on Common Equity (ROE) 36.4% Deteriorating 34.7% Fair 2005 2006 3.00% 3.10% Net Profit Margin Net Profit Margin 2005 2006 8.00% 8.68% ROA ROA 2005 2006 36.40 % 31.58 % ROE ROE
  • 17.
    2006 Ratio 2005Time Series Evaluation 2006 Industry Average Cross Sectional Evaluation Price/Earning (P/E)Ratio 5.2 Improving 7.1 Poor Market/Book (M/B)Ratio 2.1 Deteriorating 2.2 Fair 5.Market 2005 2006 5.2 5.5 P/E ratio P/E ratio 2005 2006 2.1 1.74 M/B RATIO M/B RATIO
  • 18.
    conclusion Stanley should tryto find the money to hire the software developer since the ratios show that the firm should be performing better for a firm in this particular industry. In addition, the “Blockbuster” sales potential implies a potential for increased profitability which falls in line with Stanley’s focus.
  • 19.