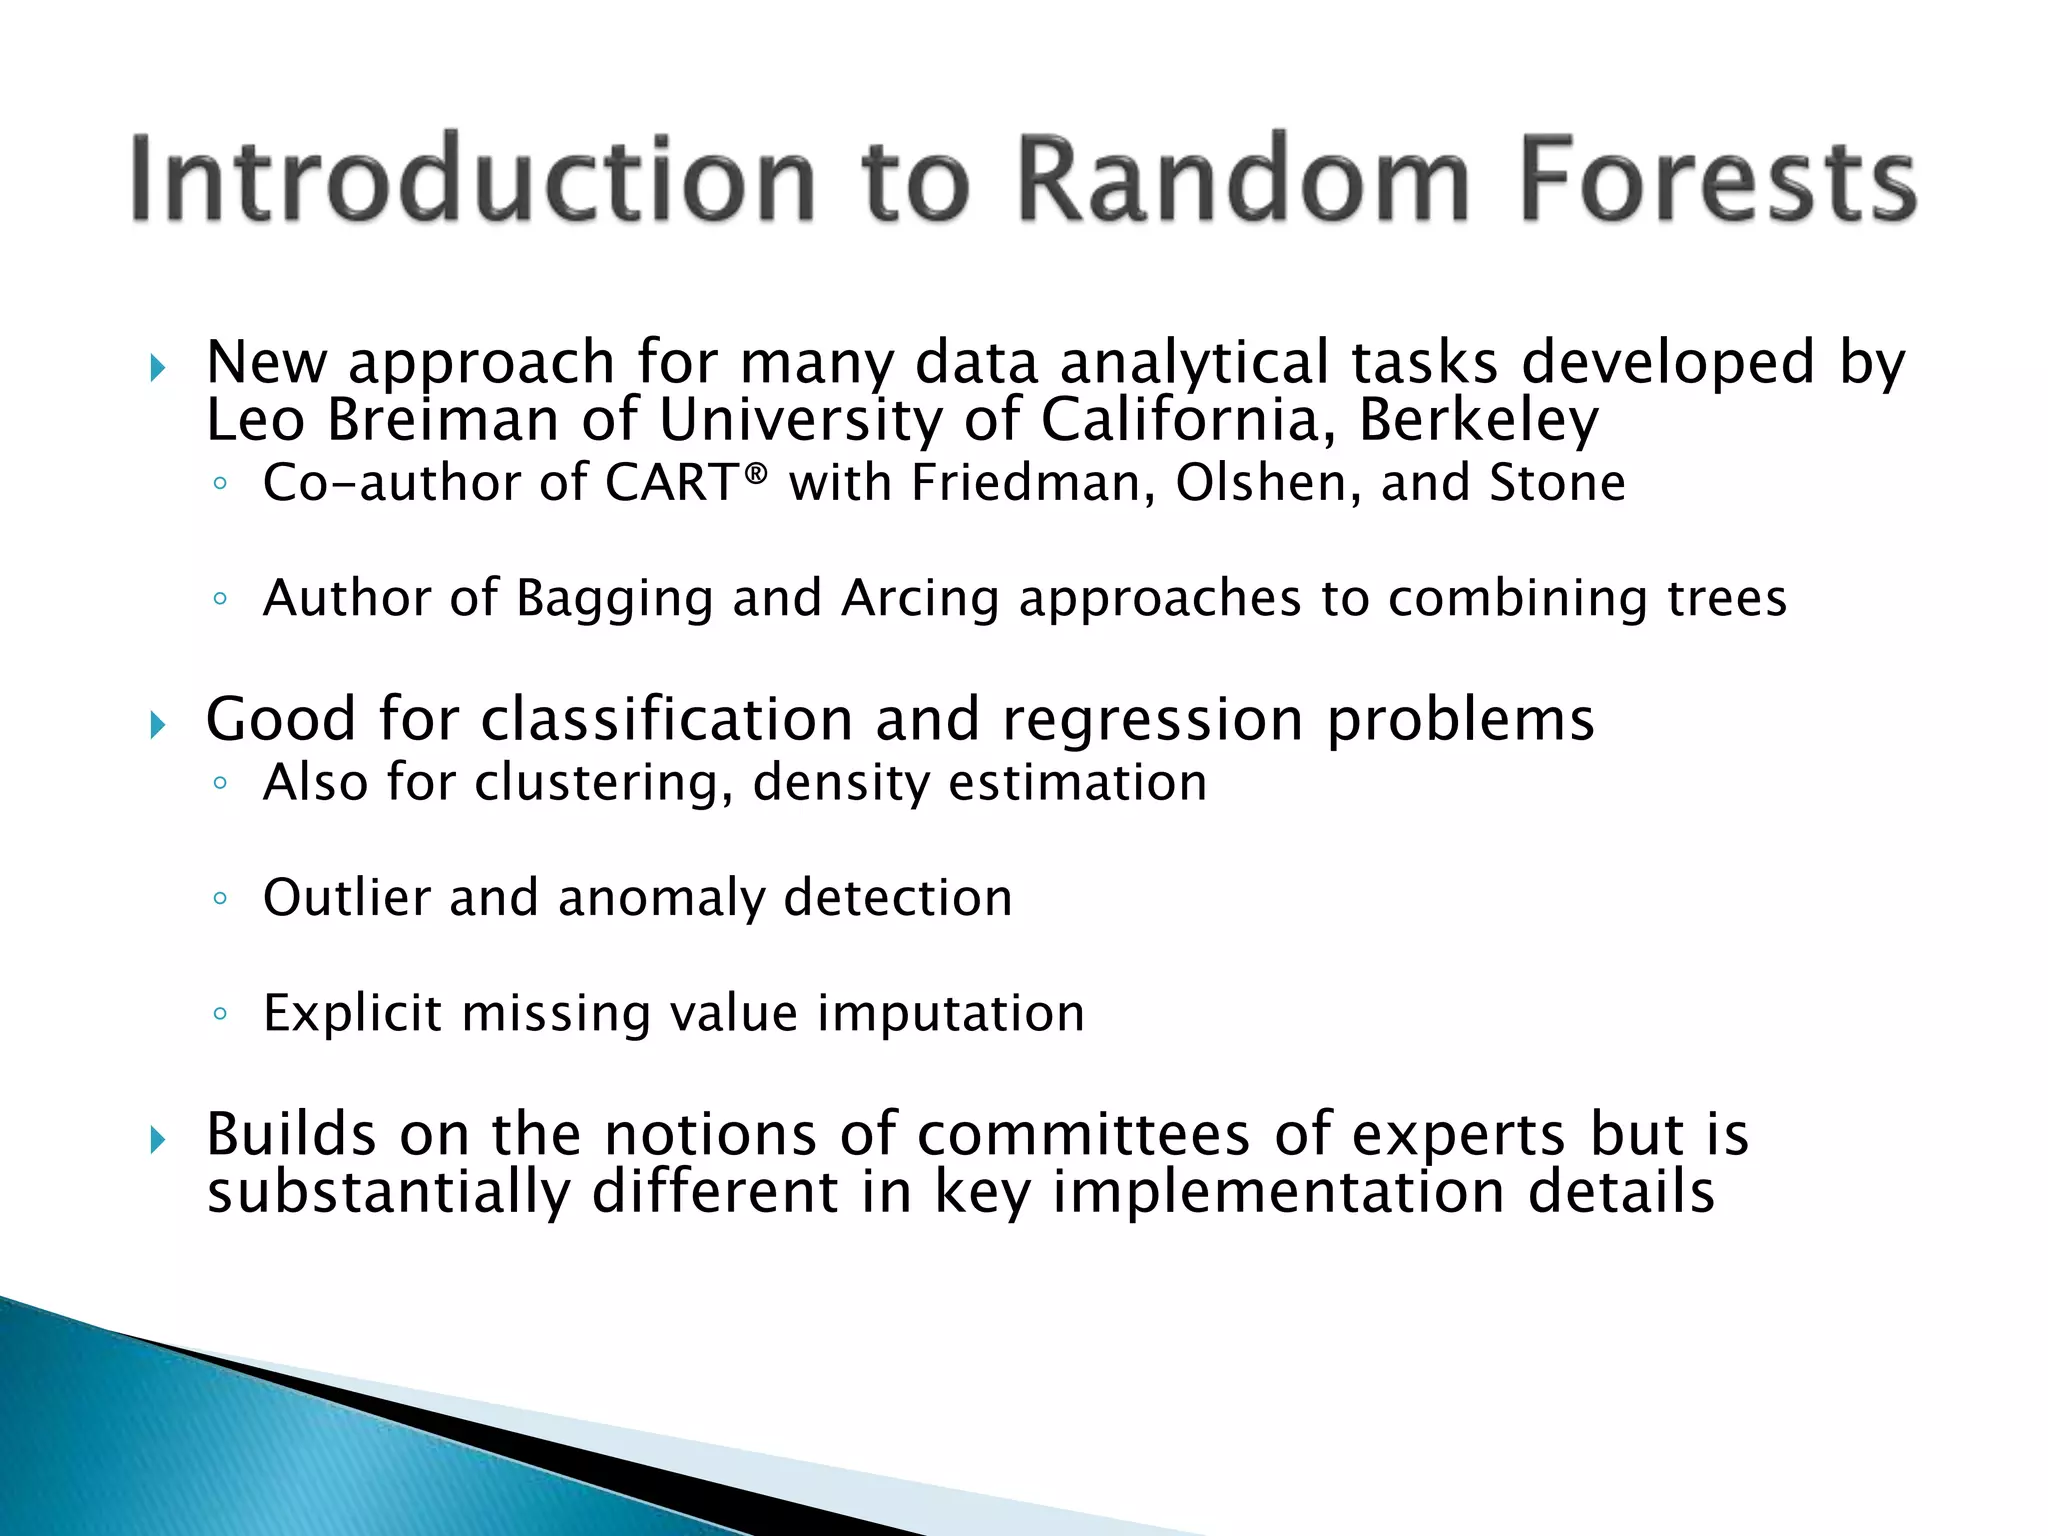
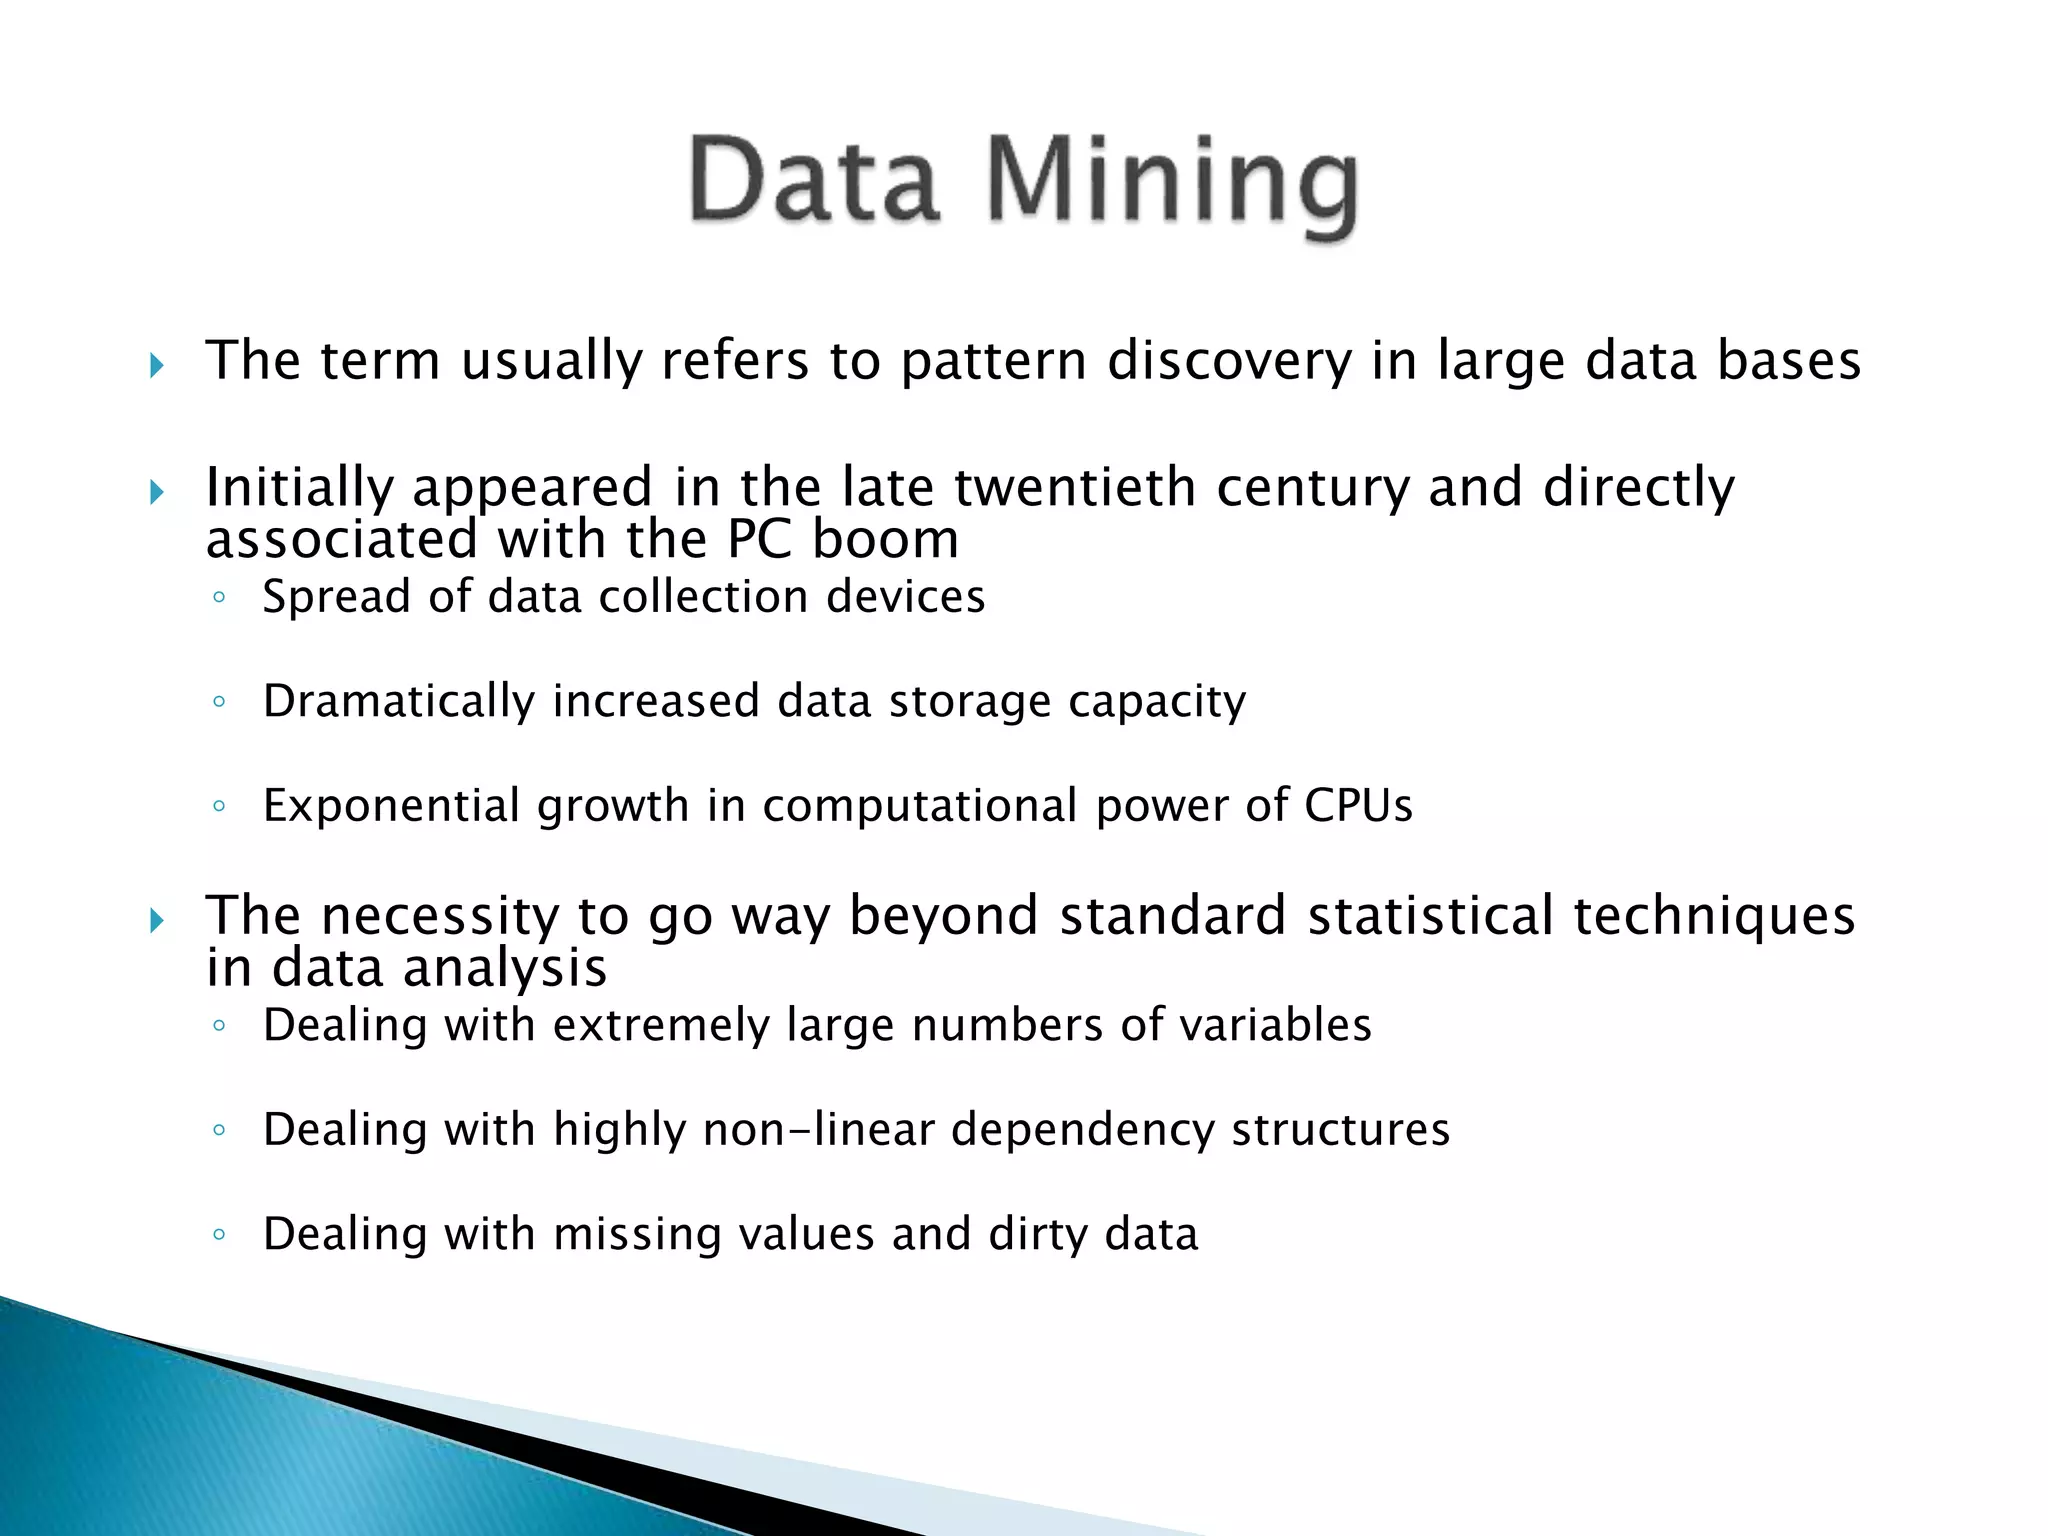
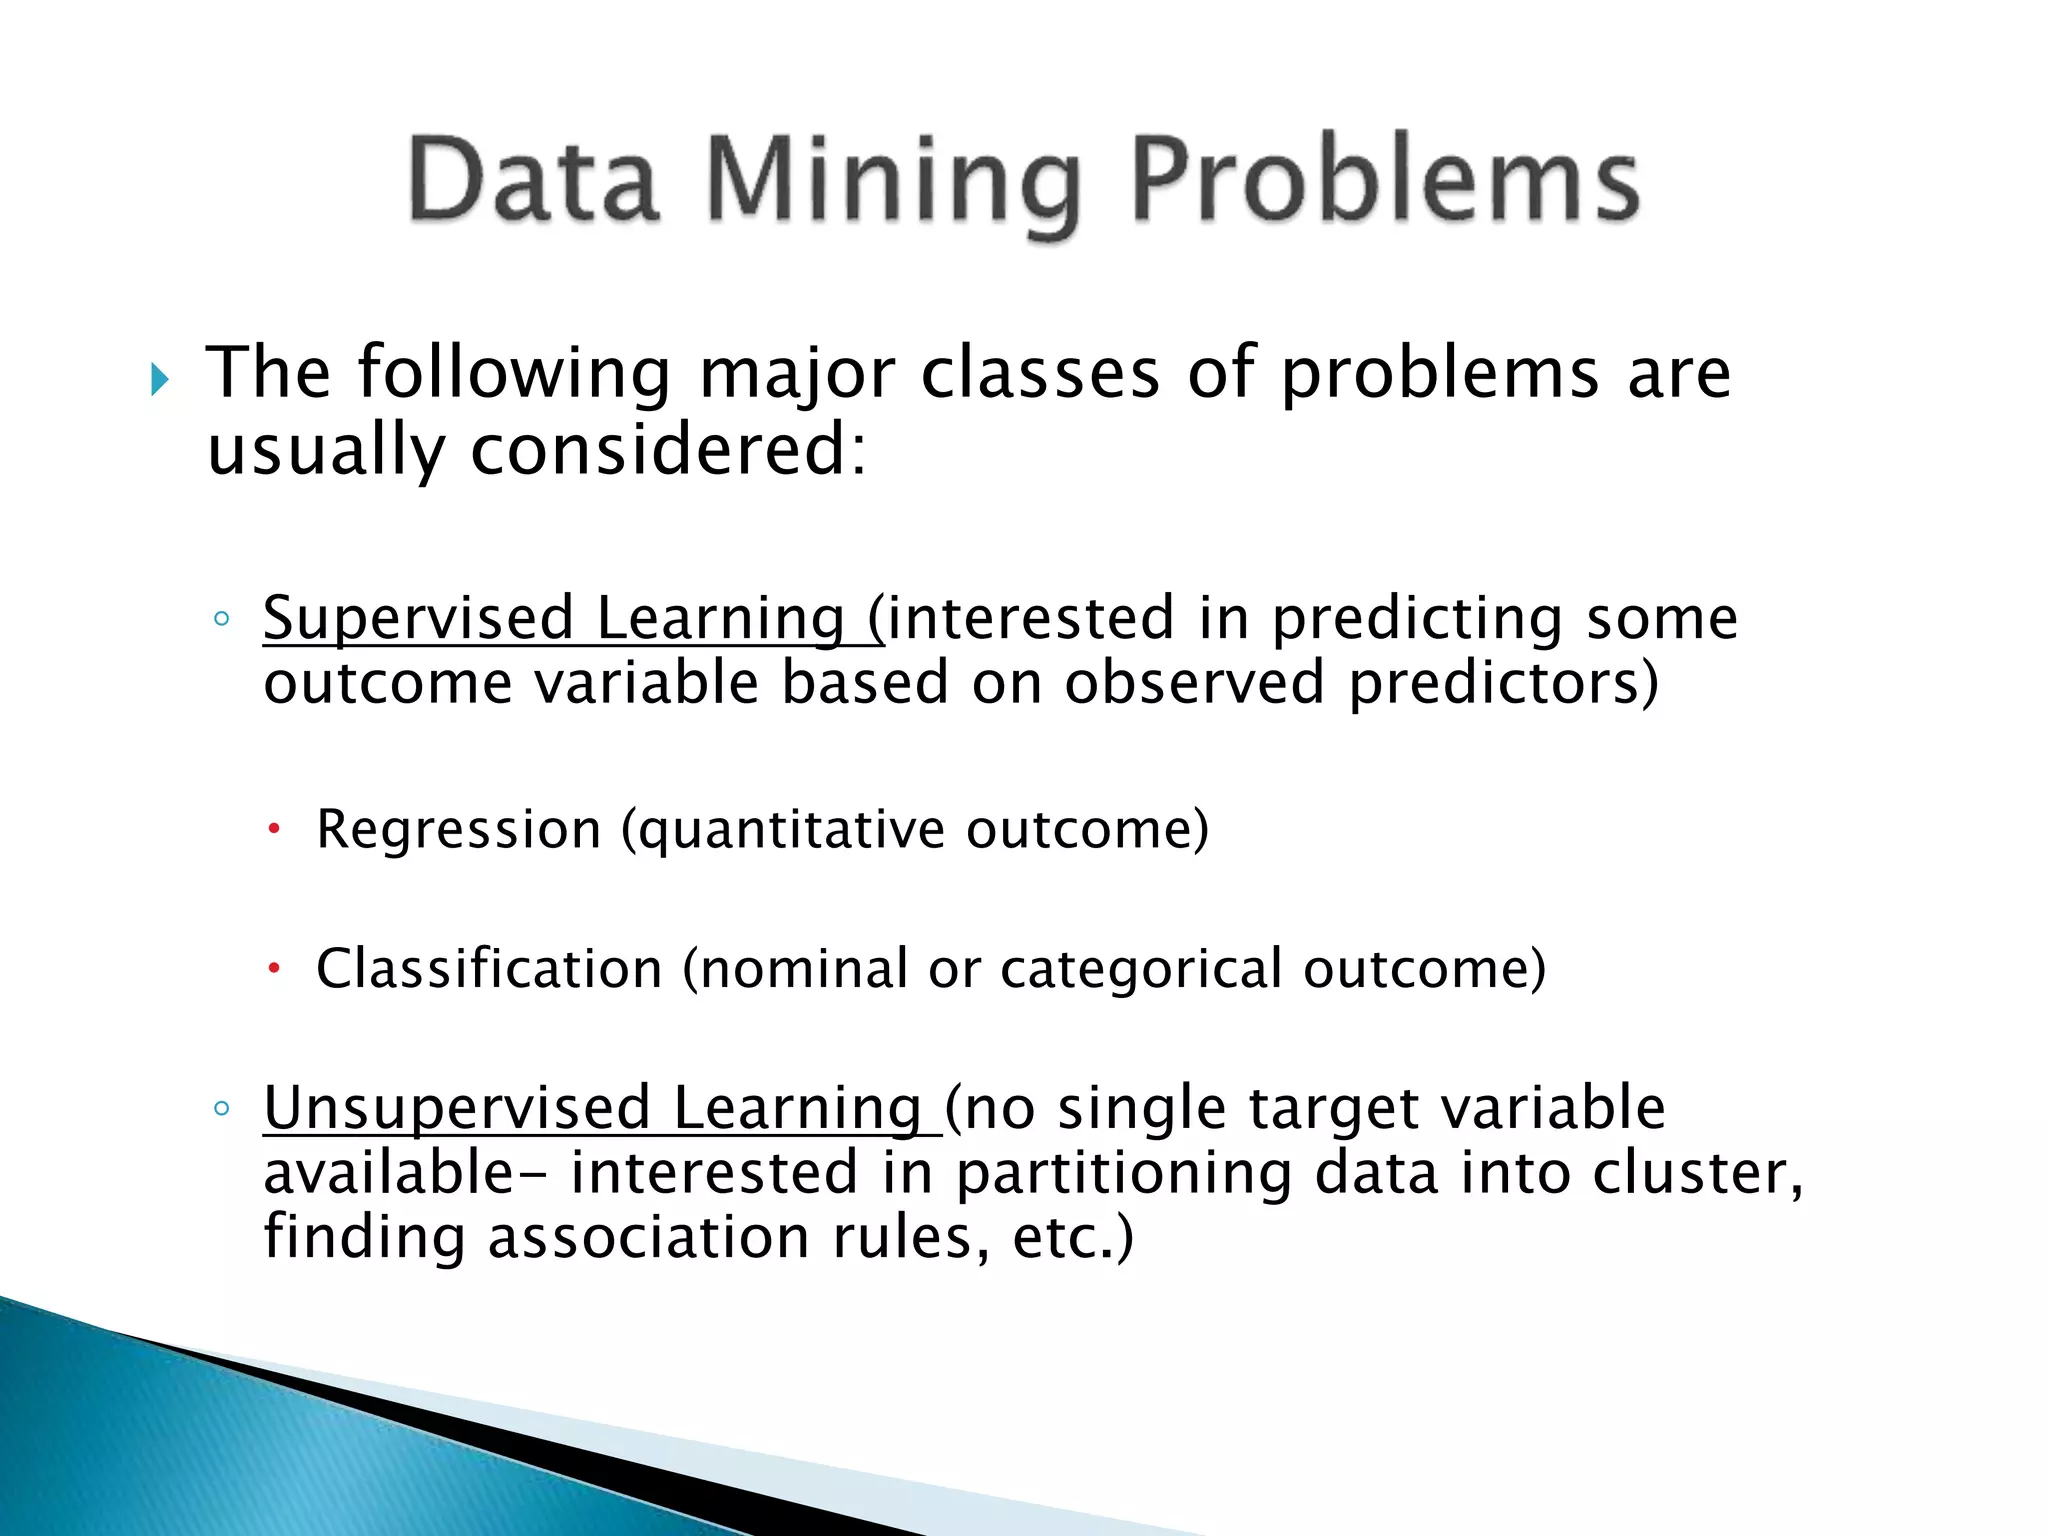
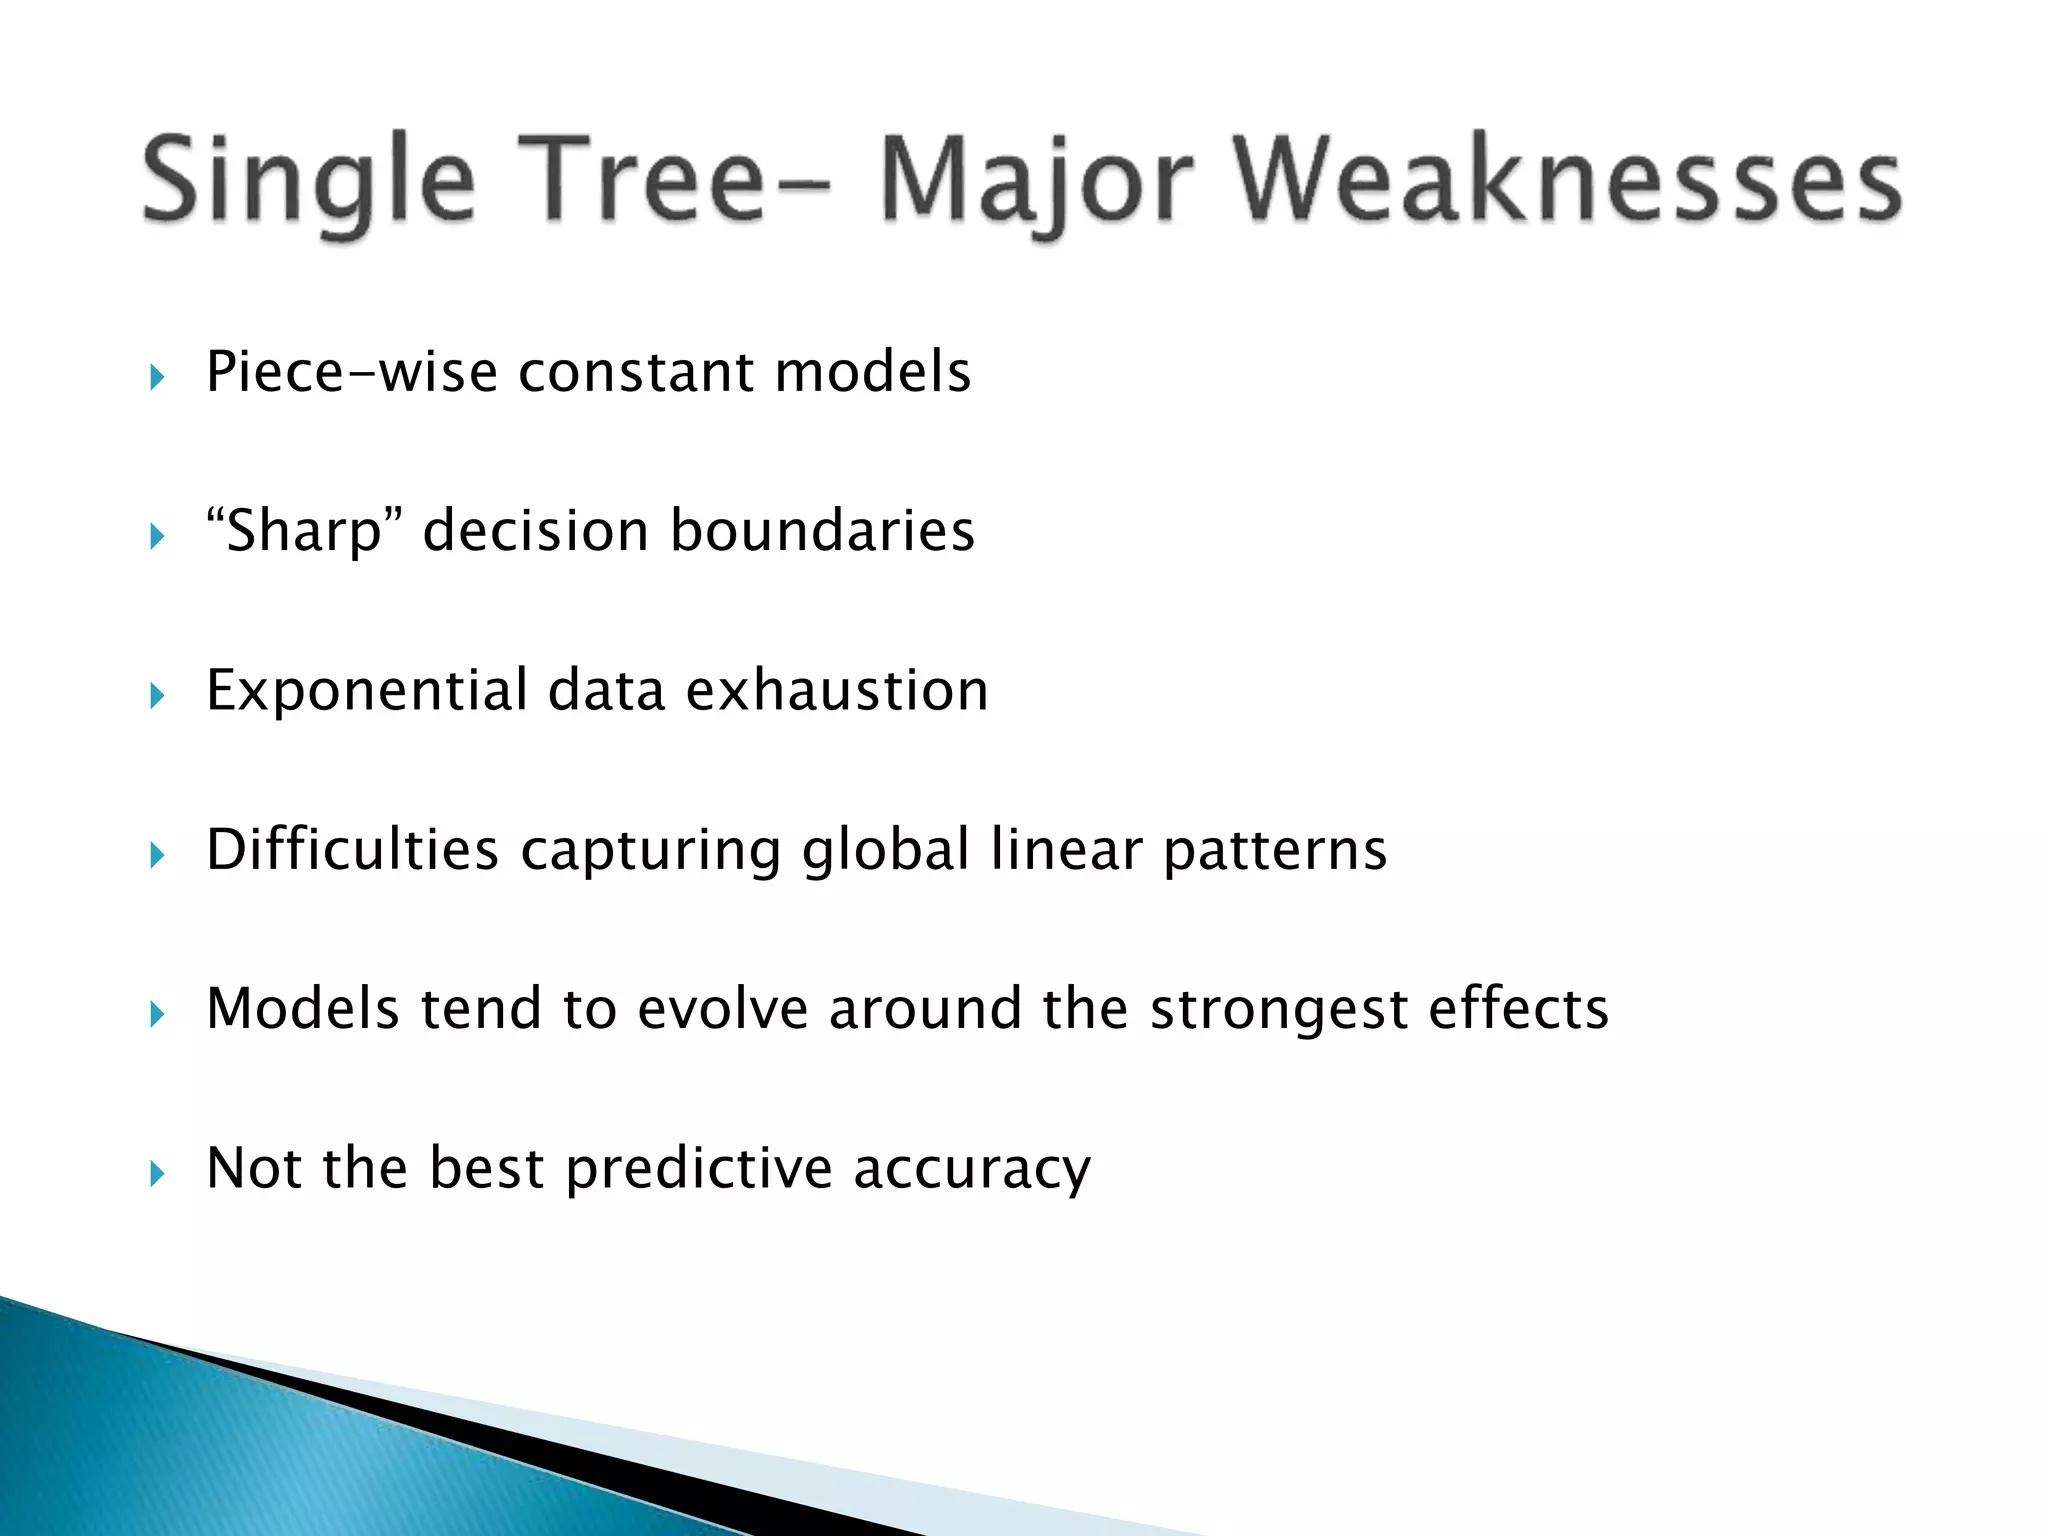
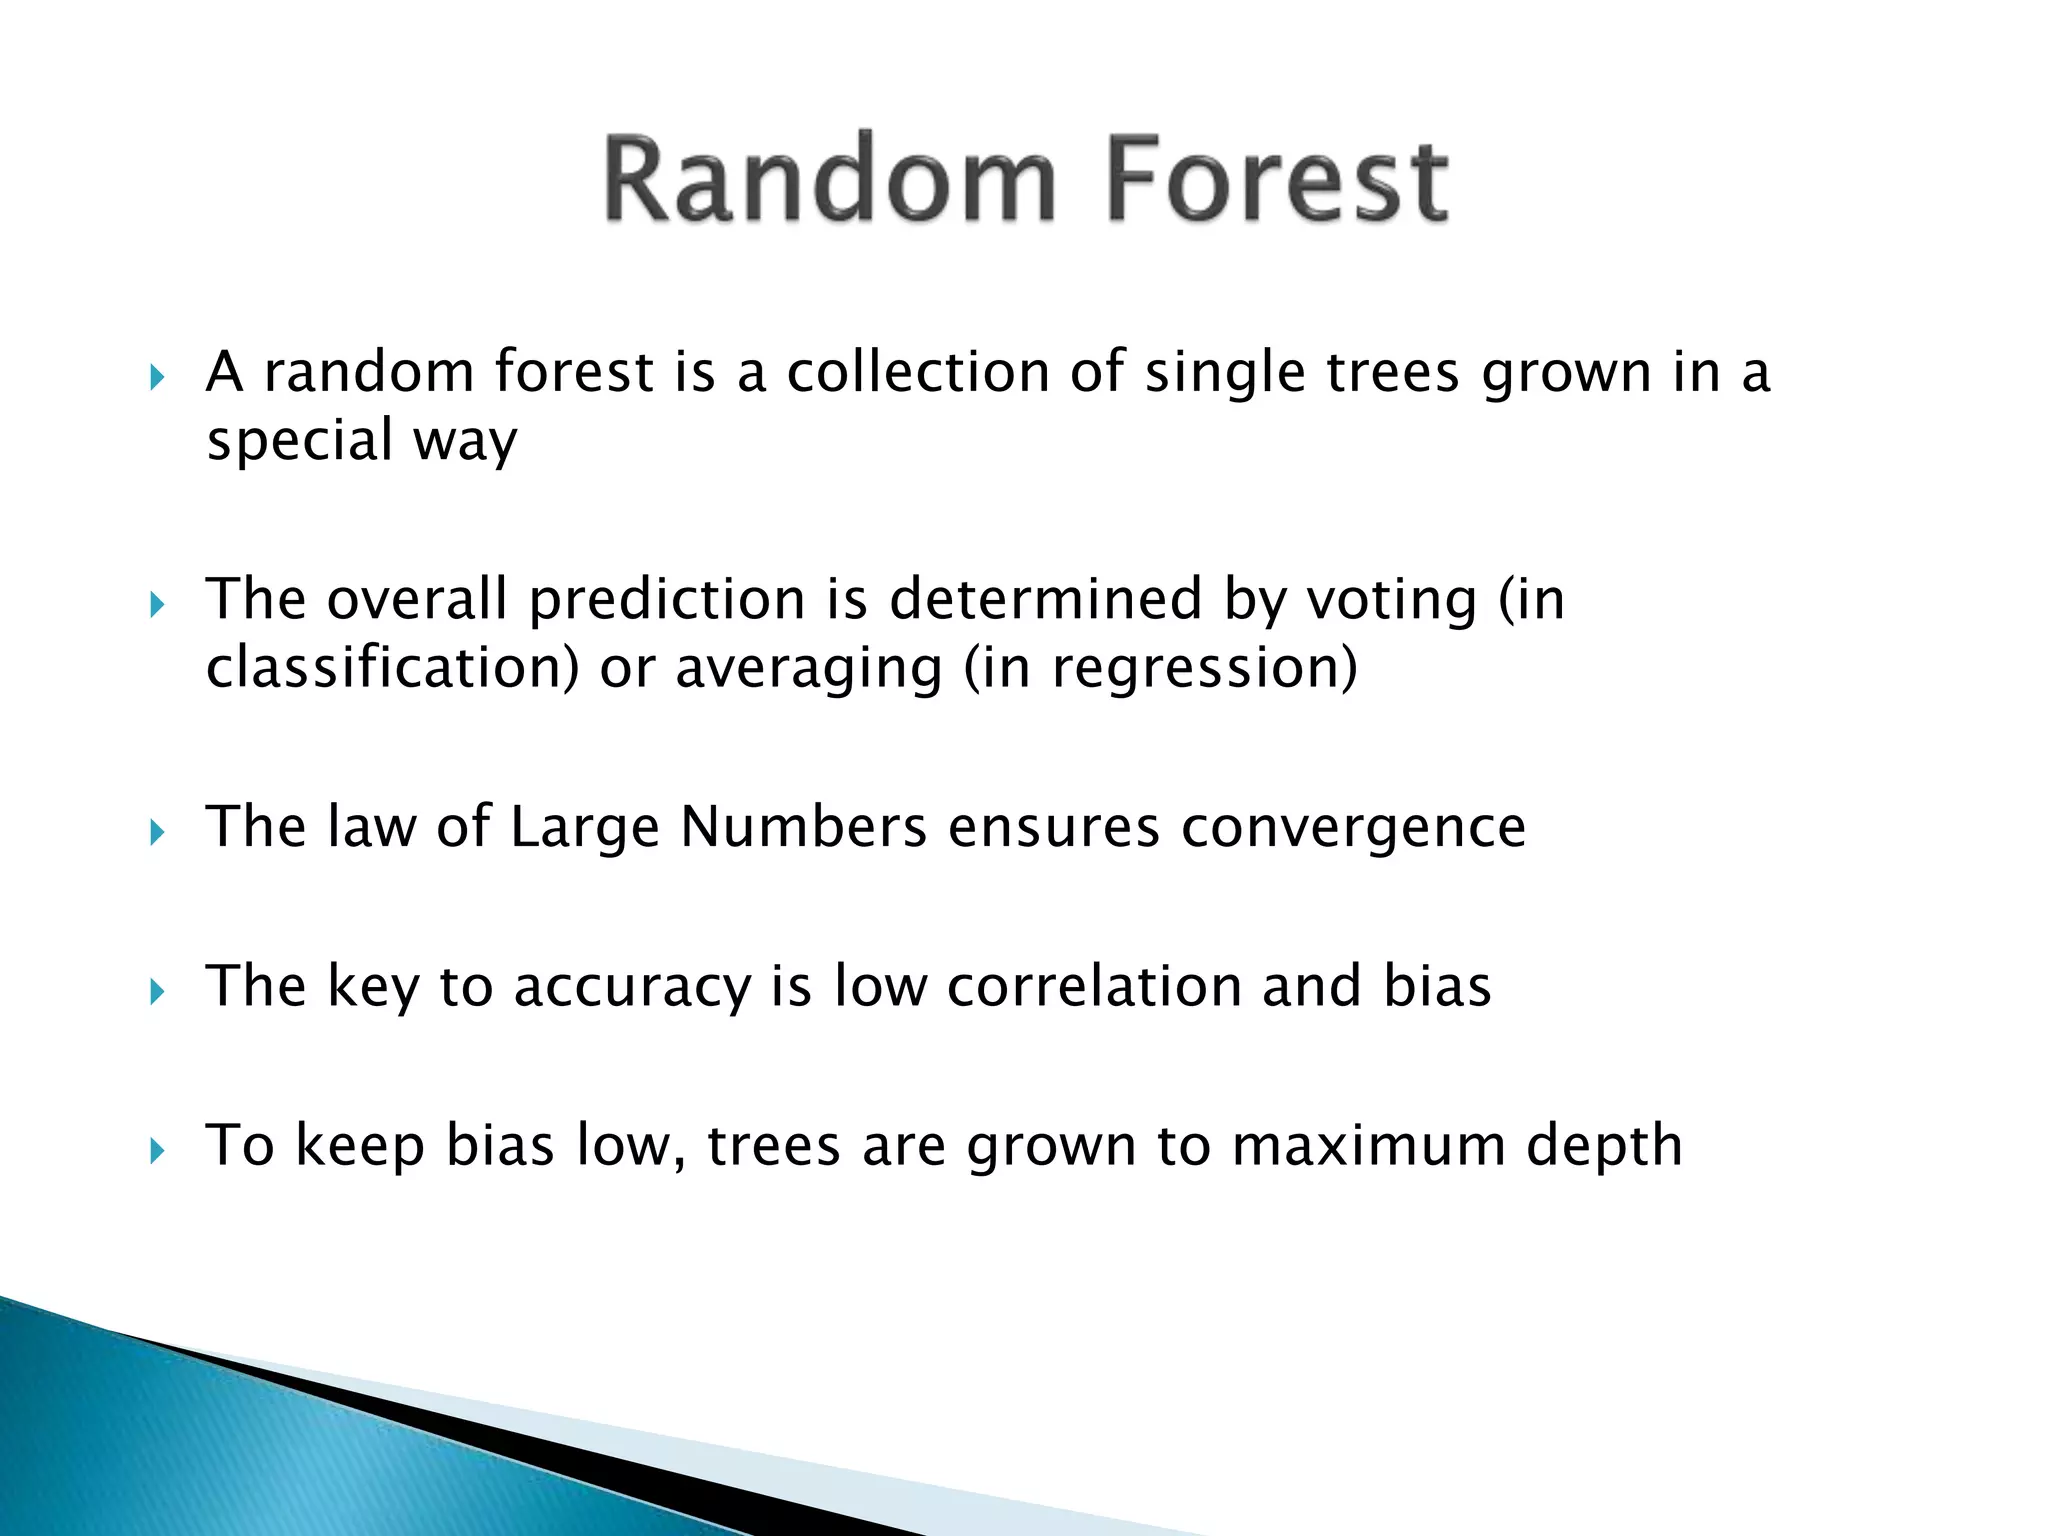
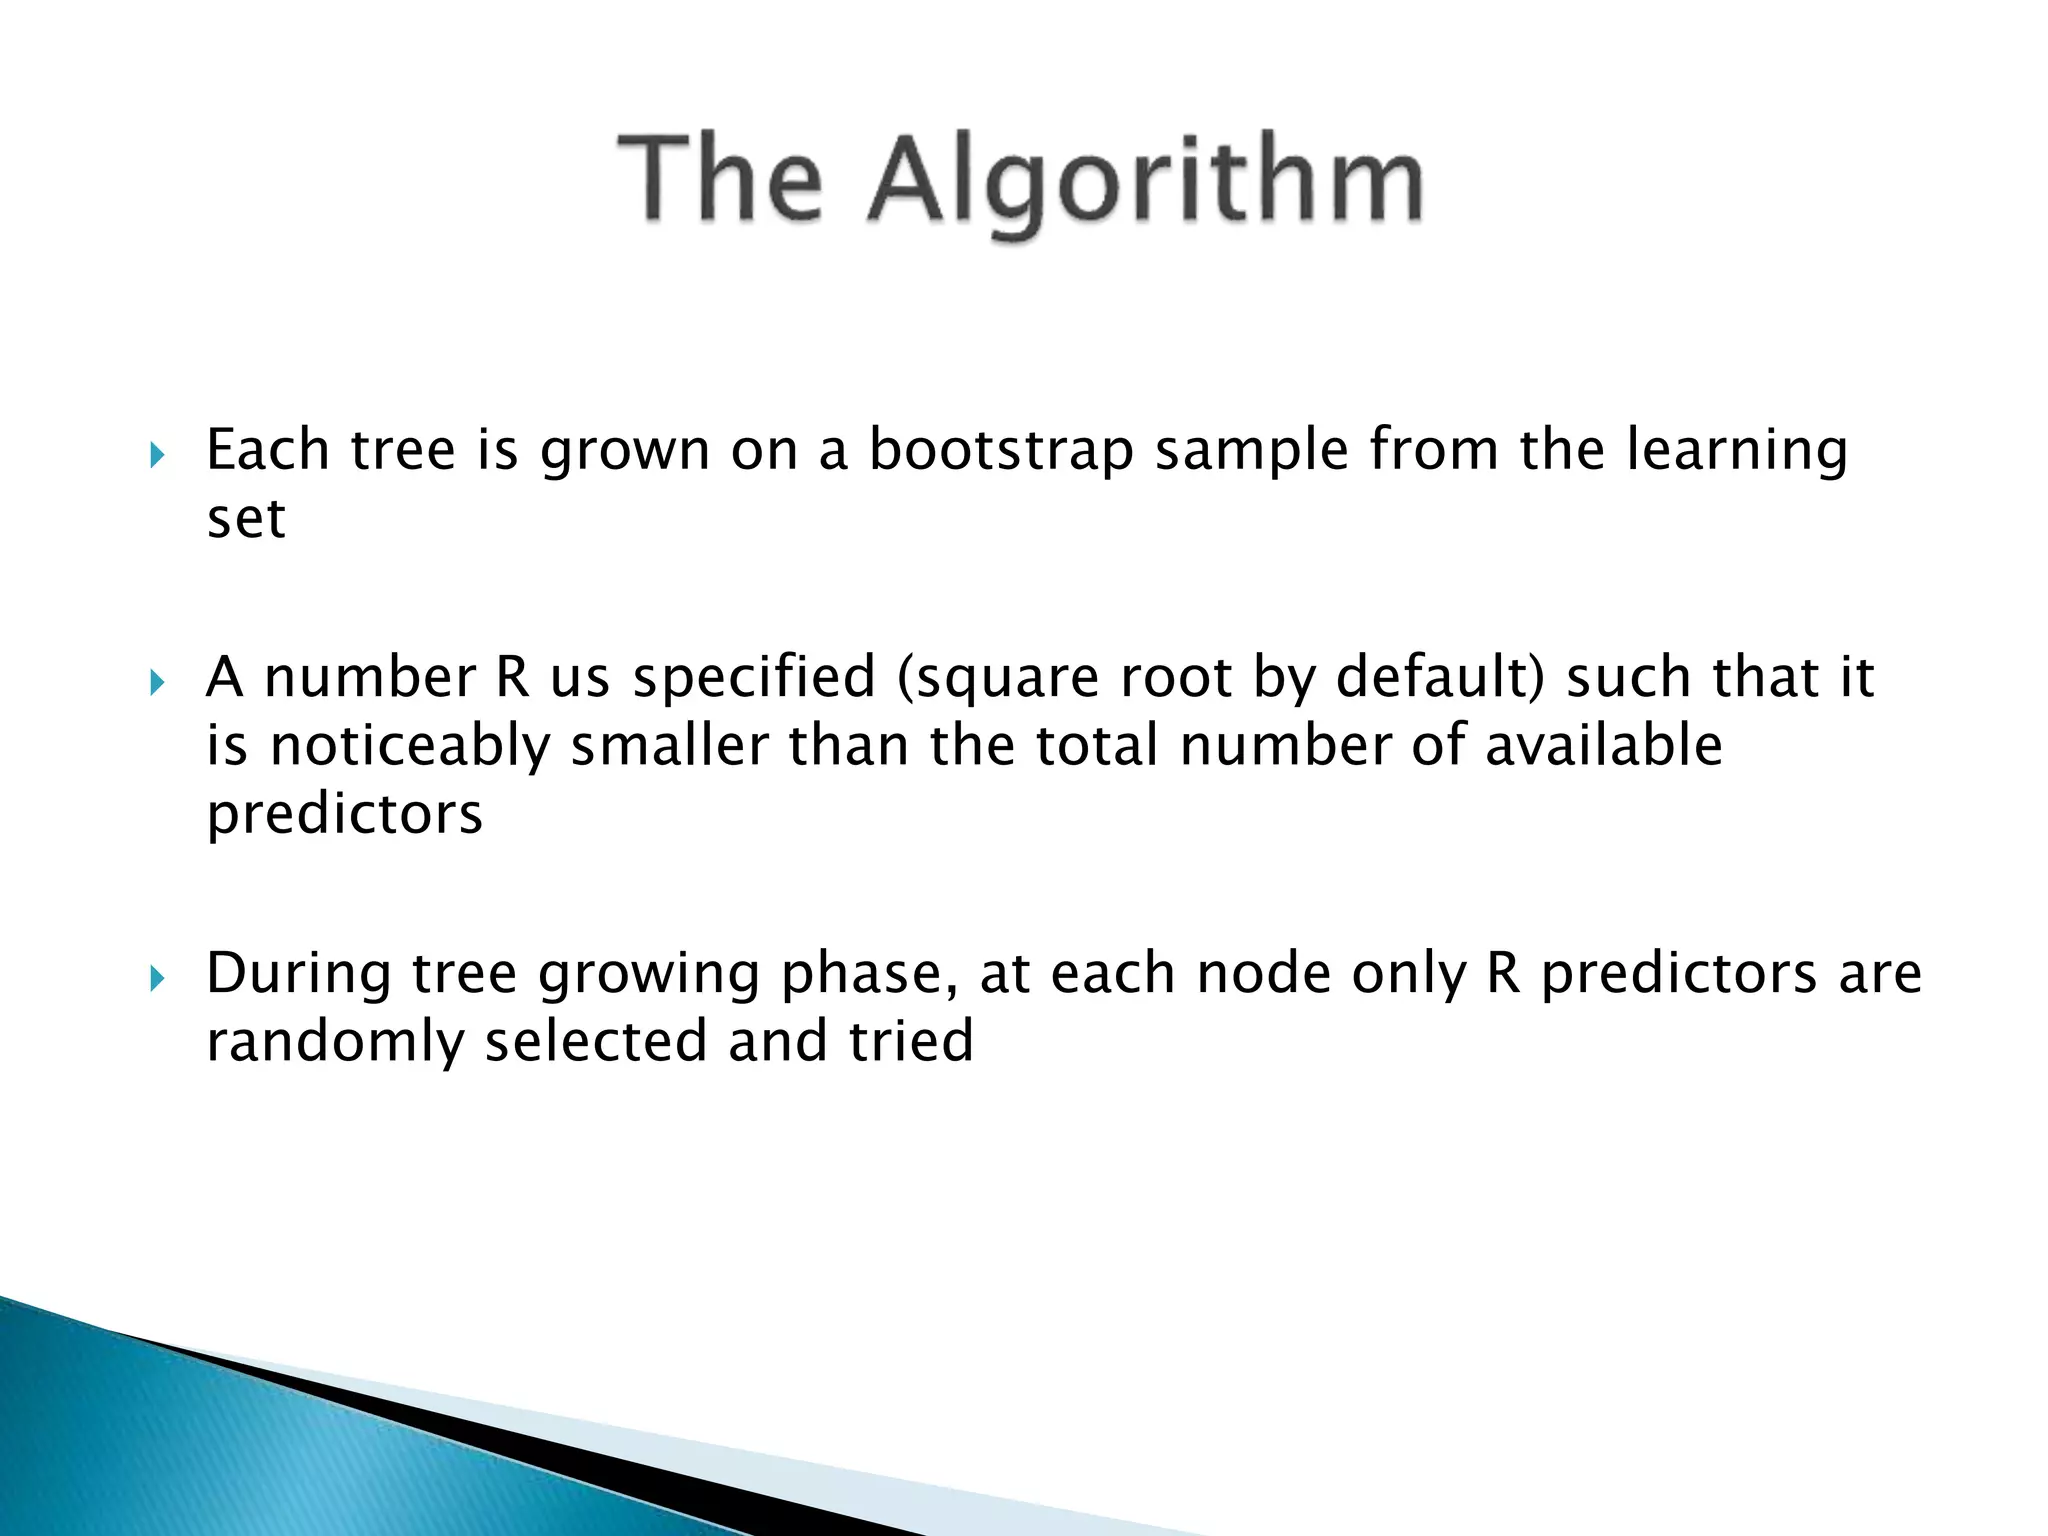
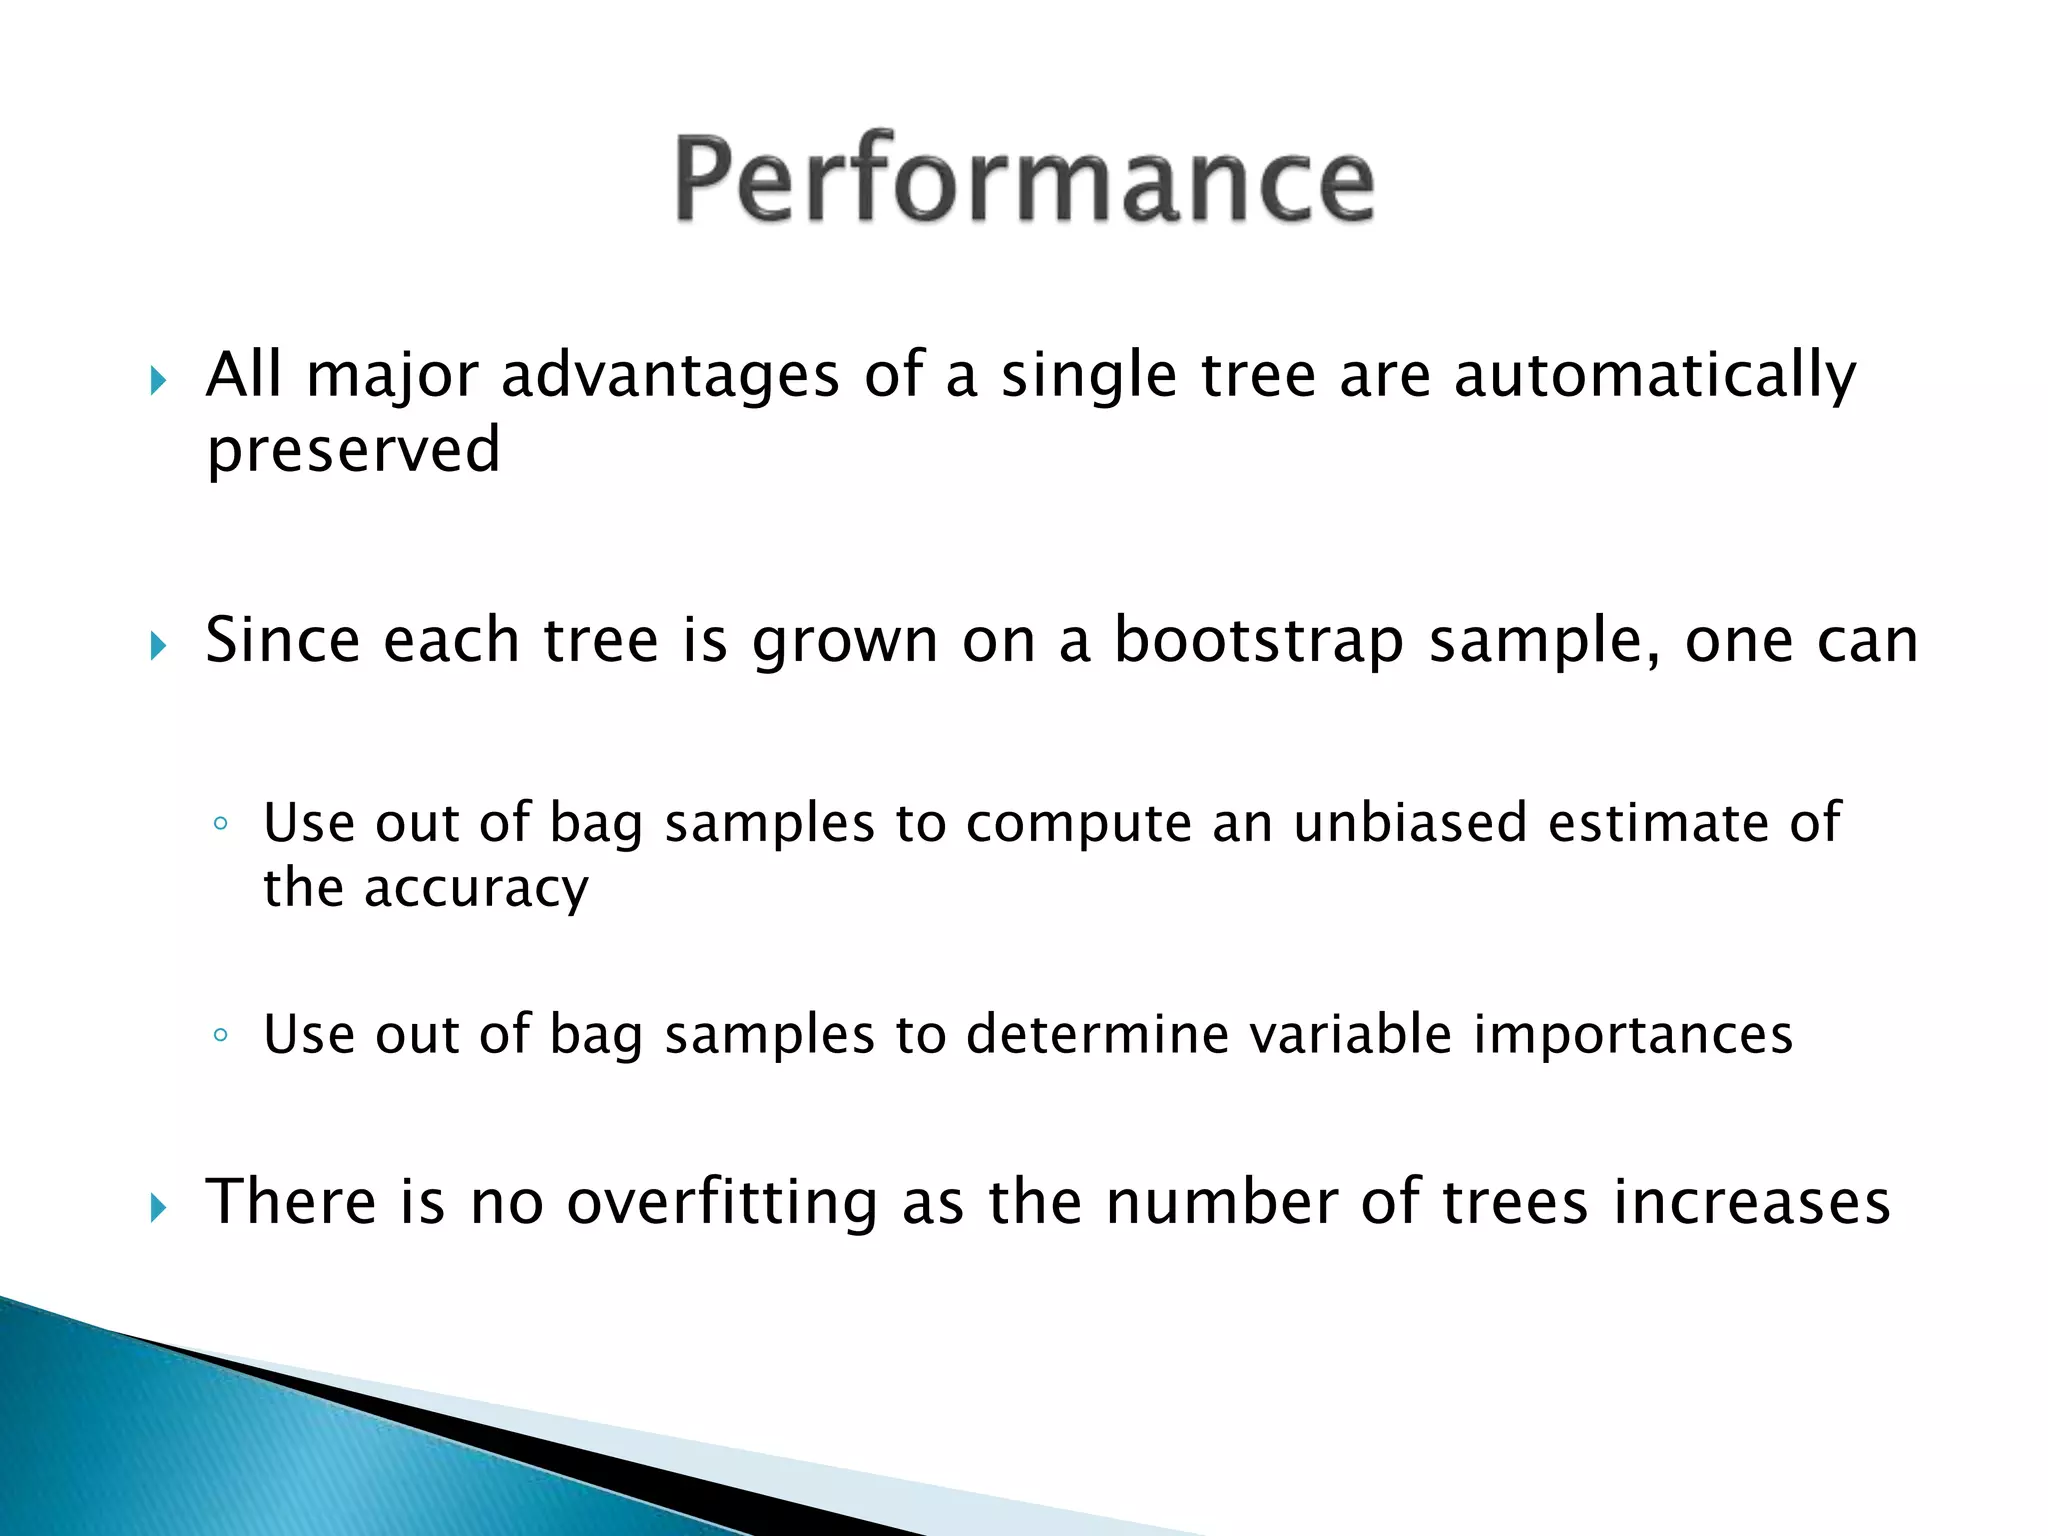
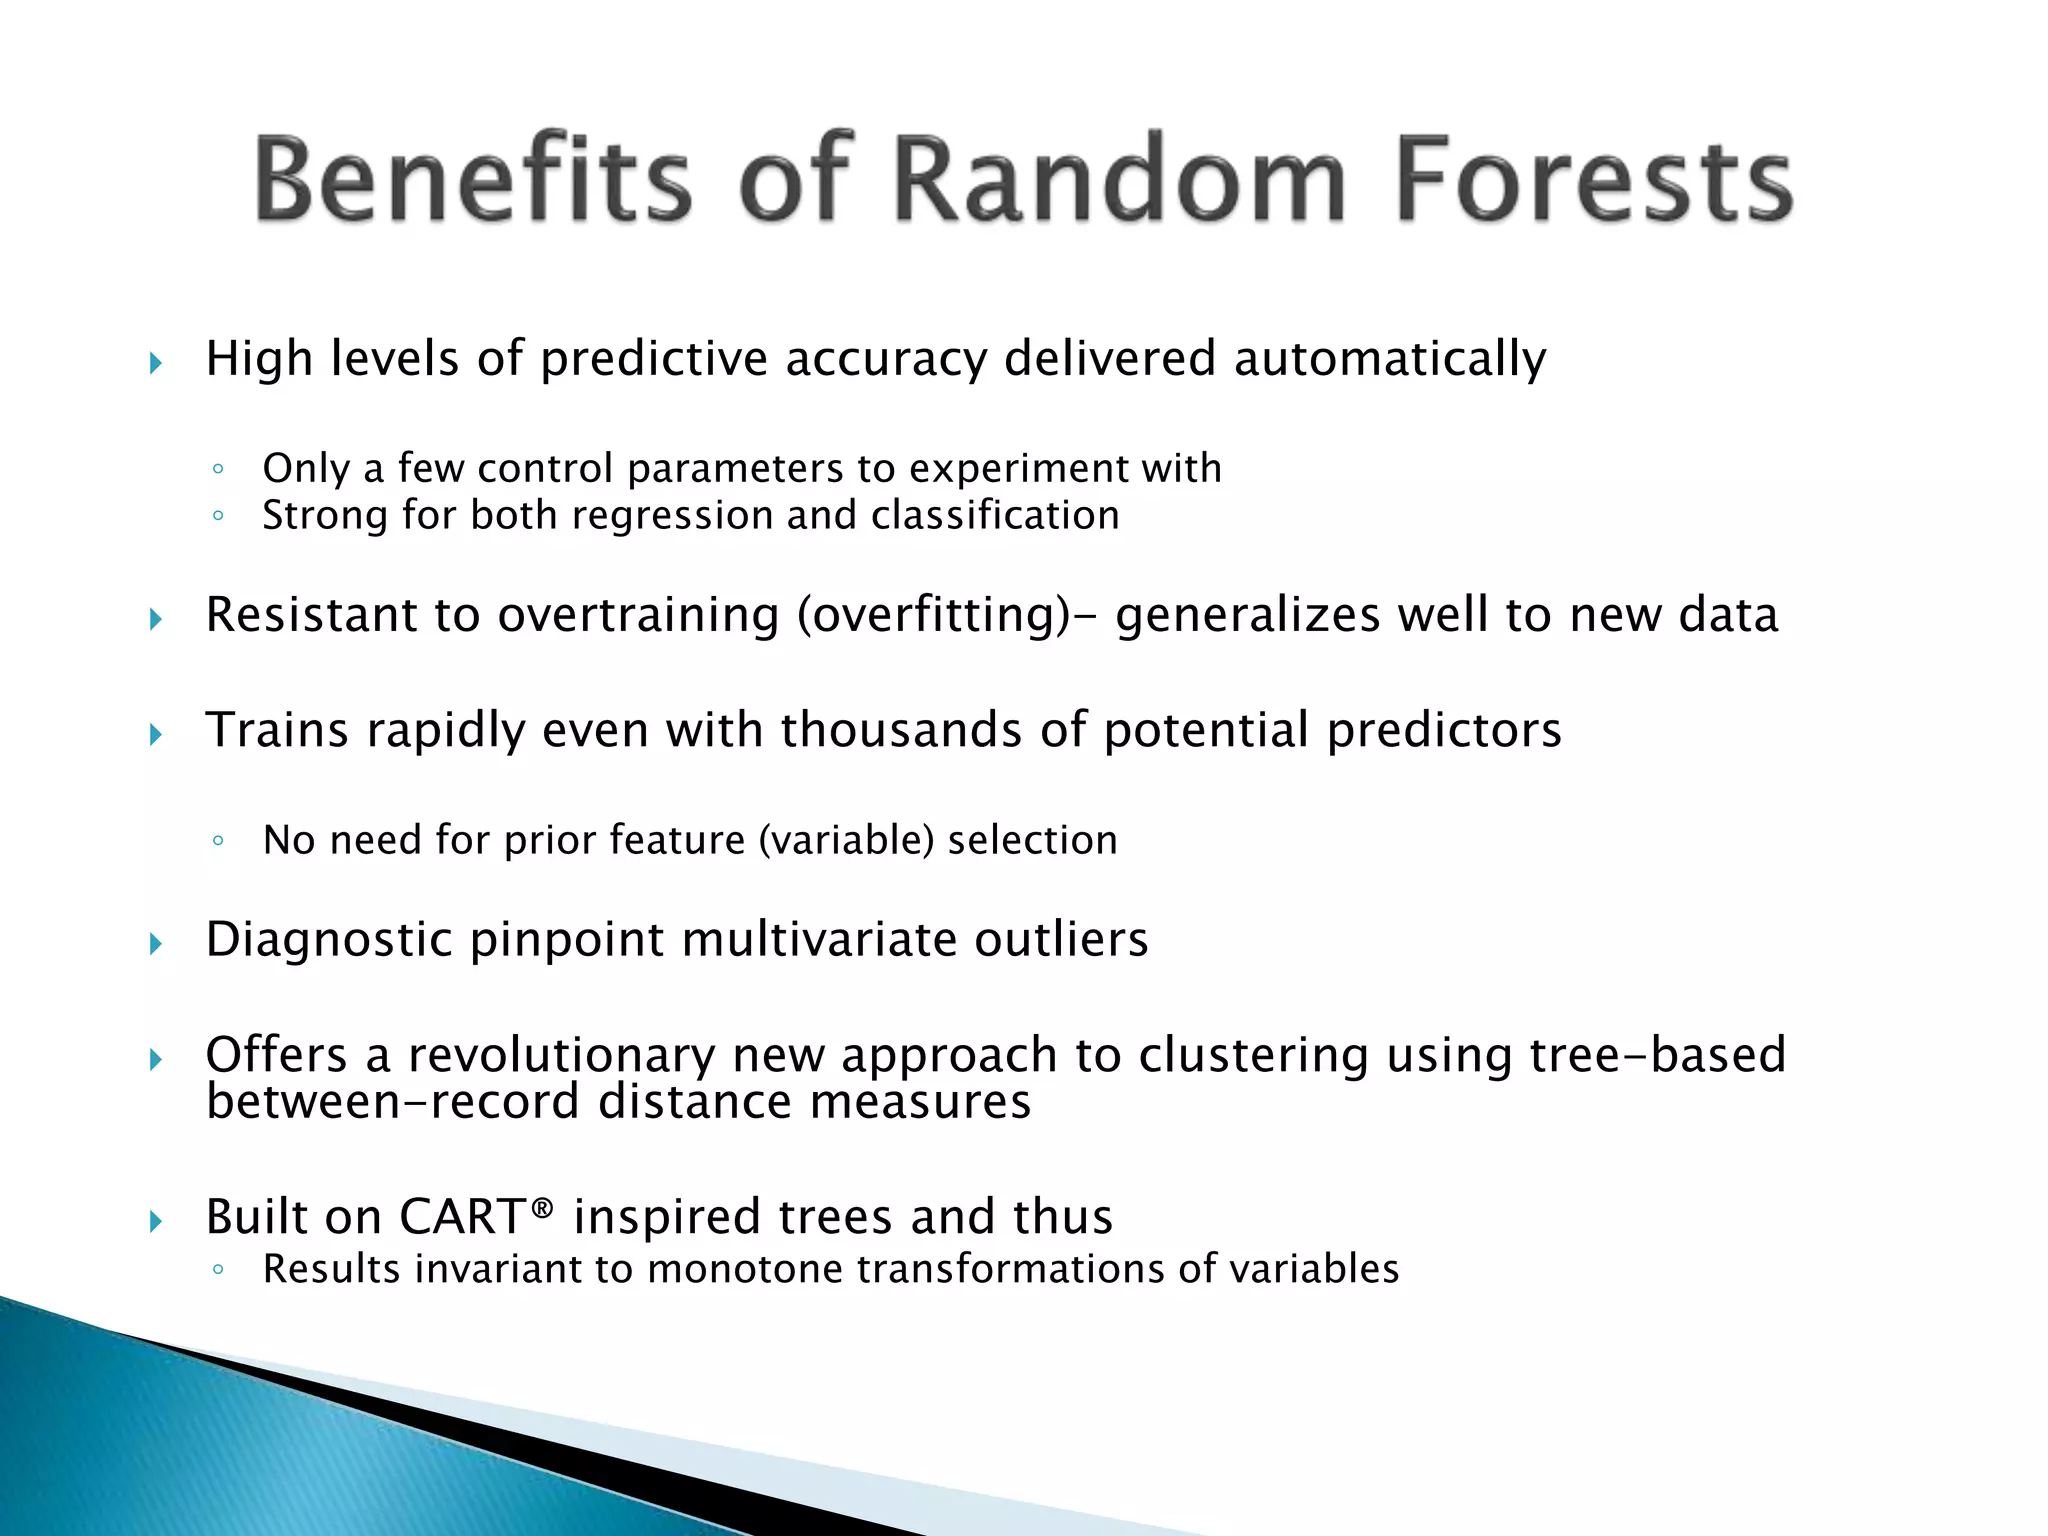
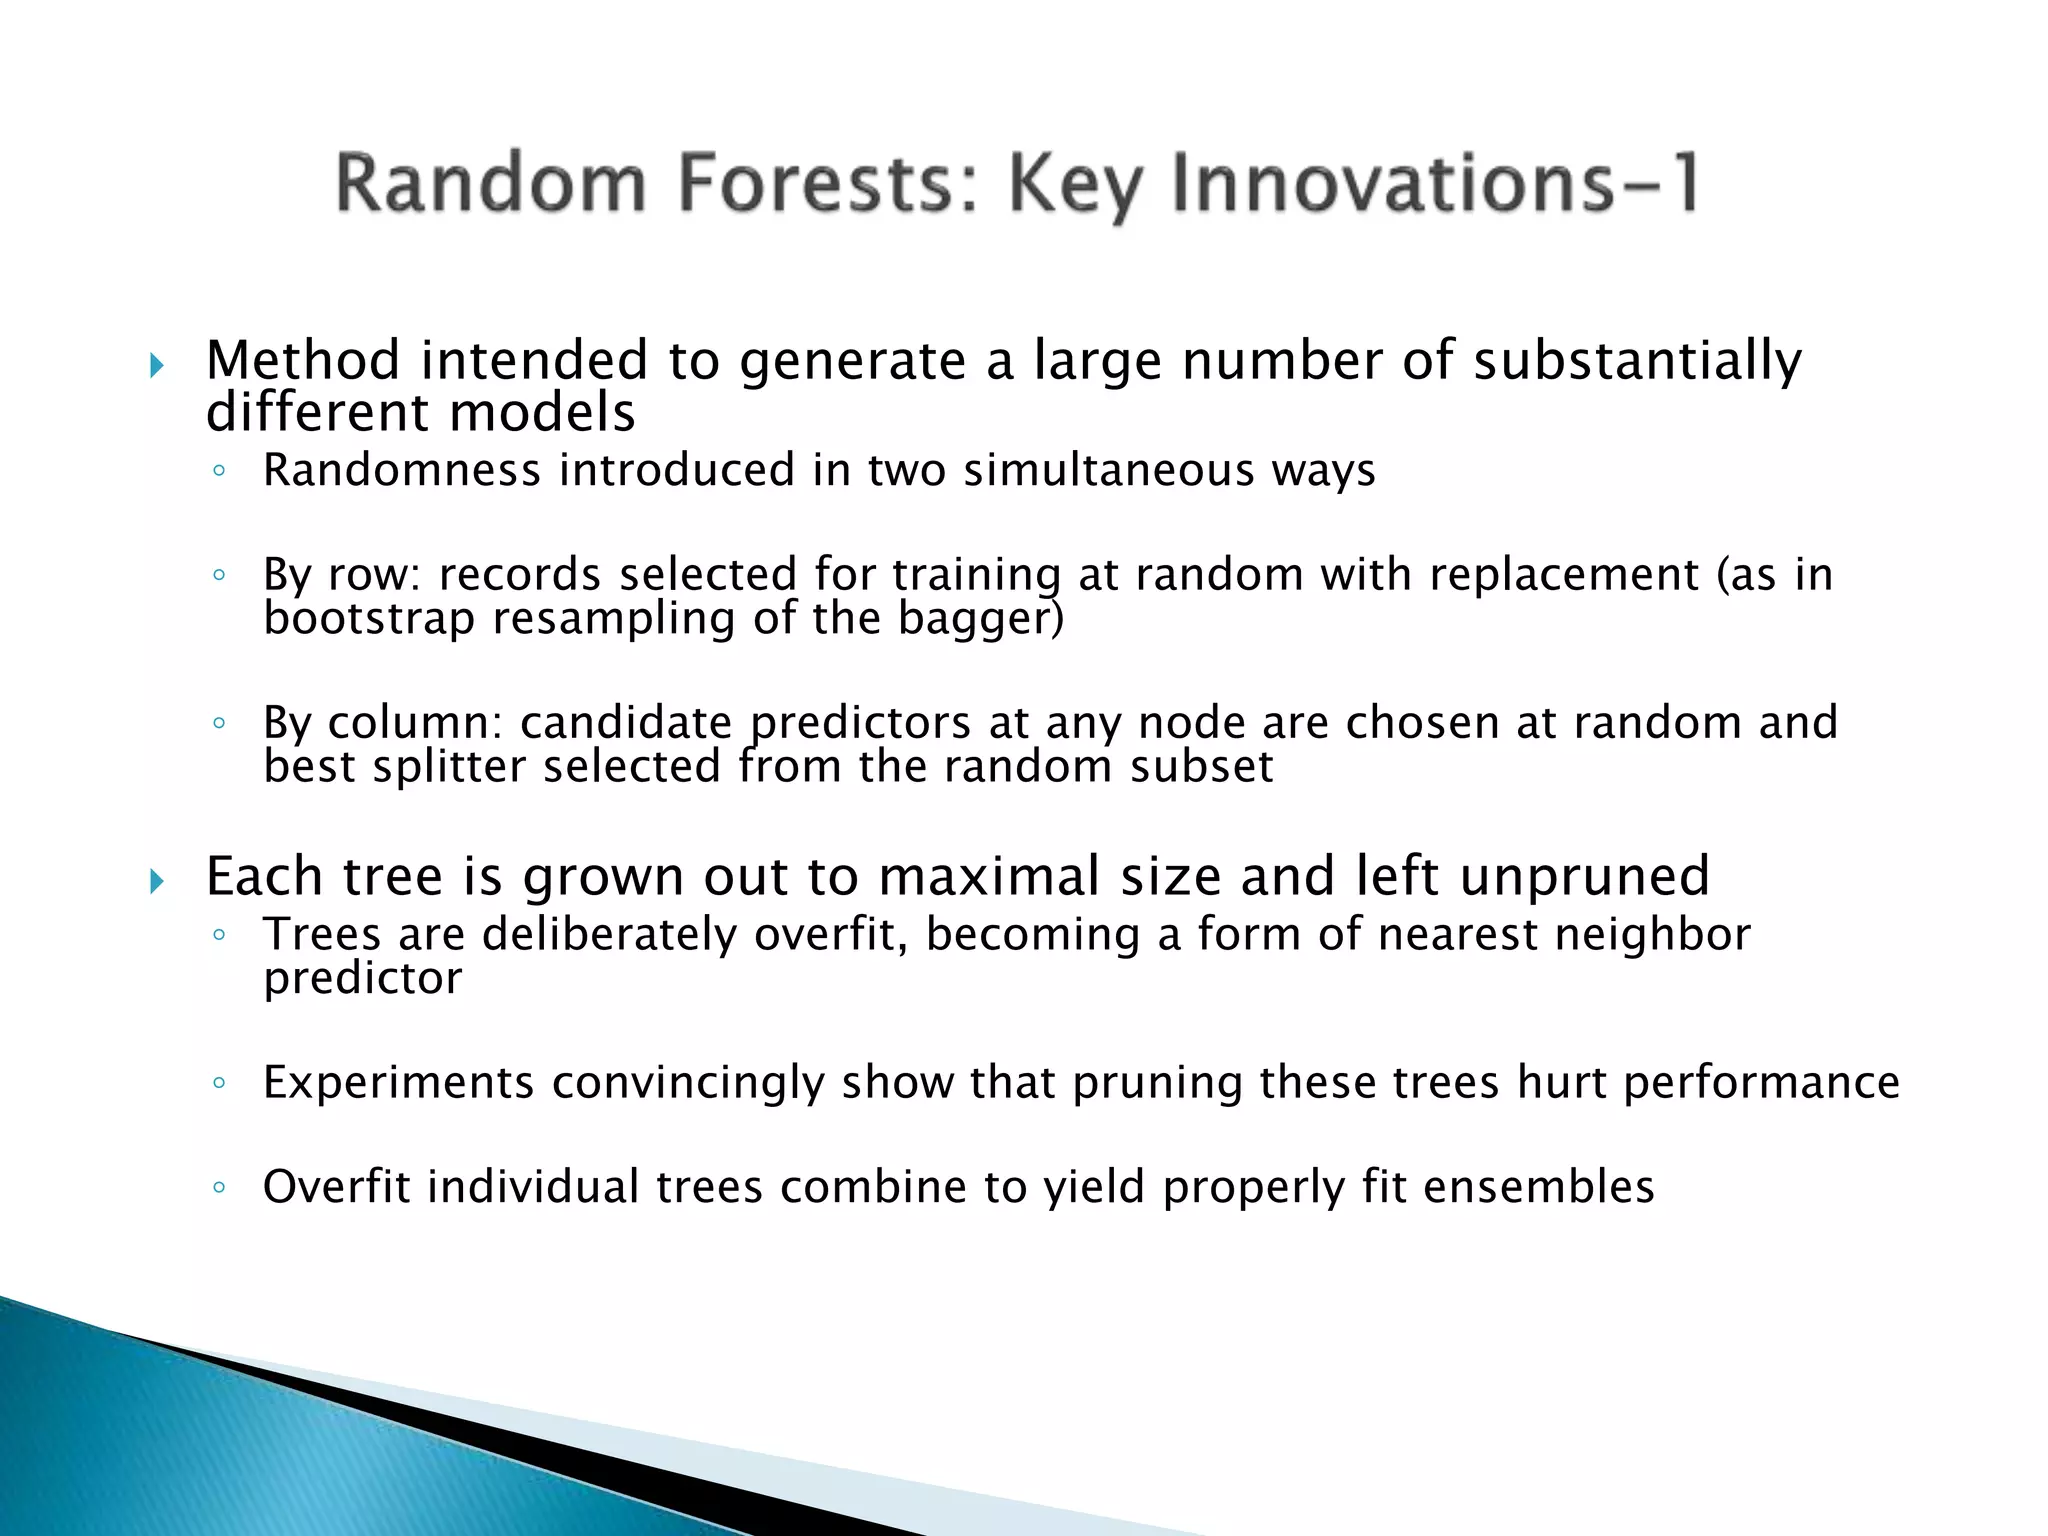
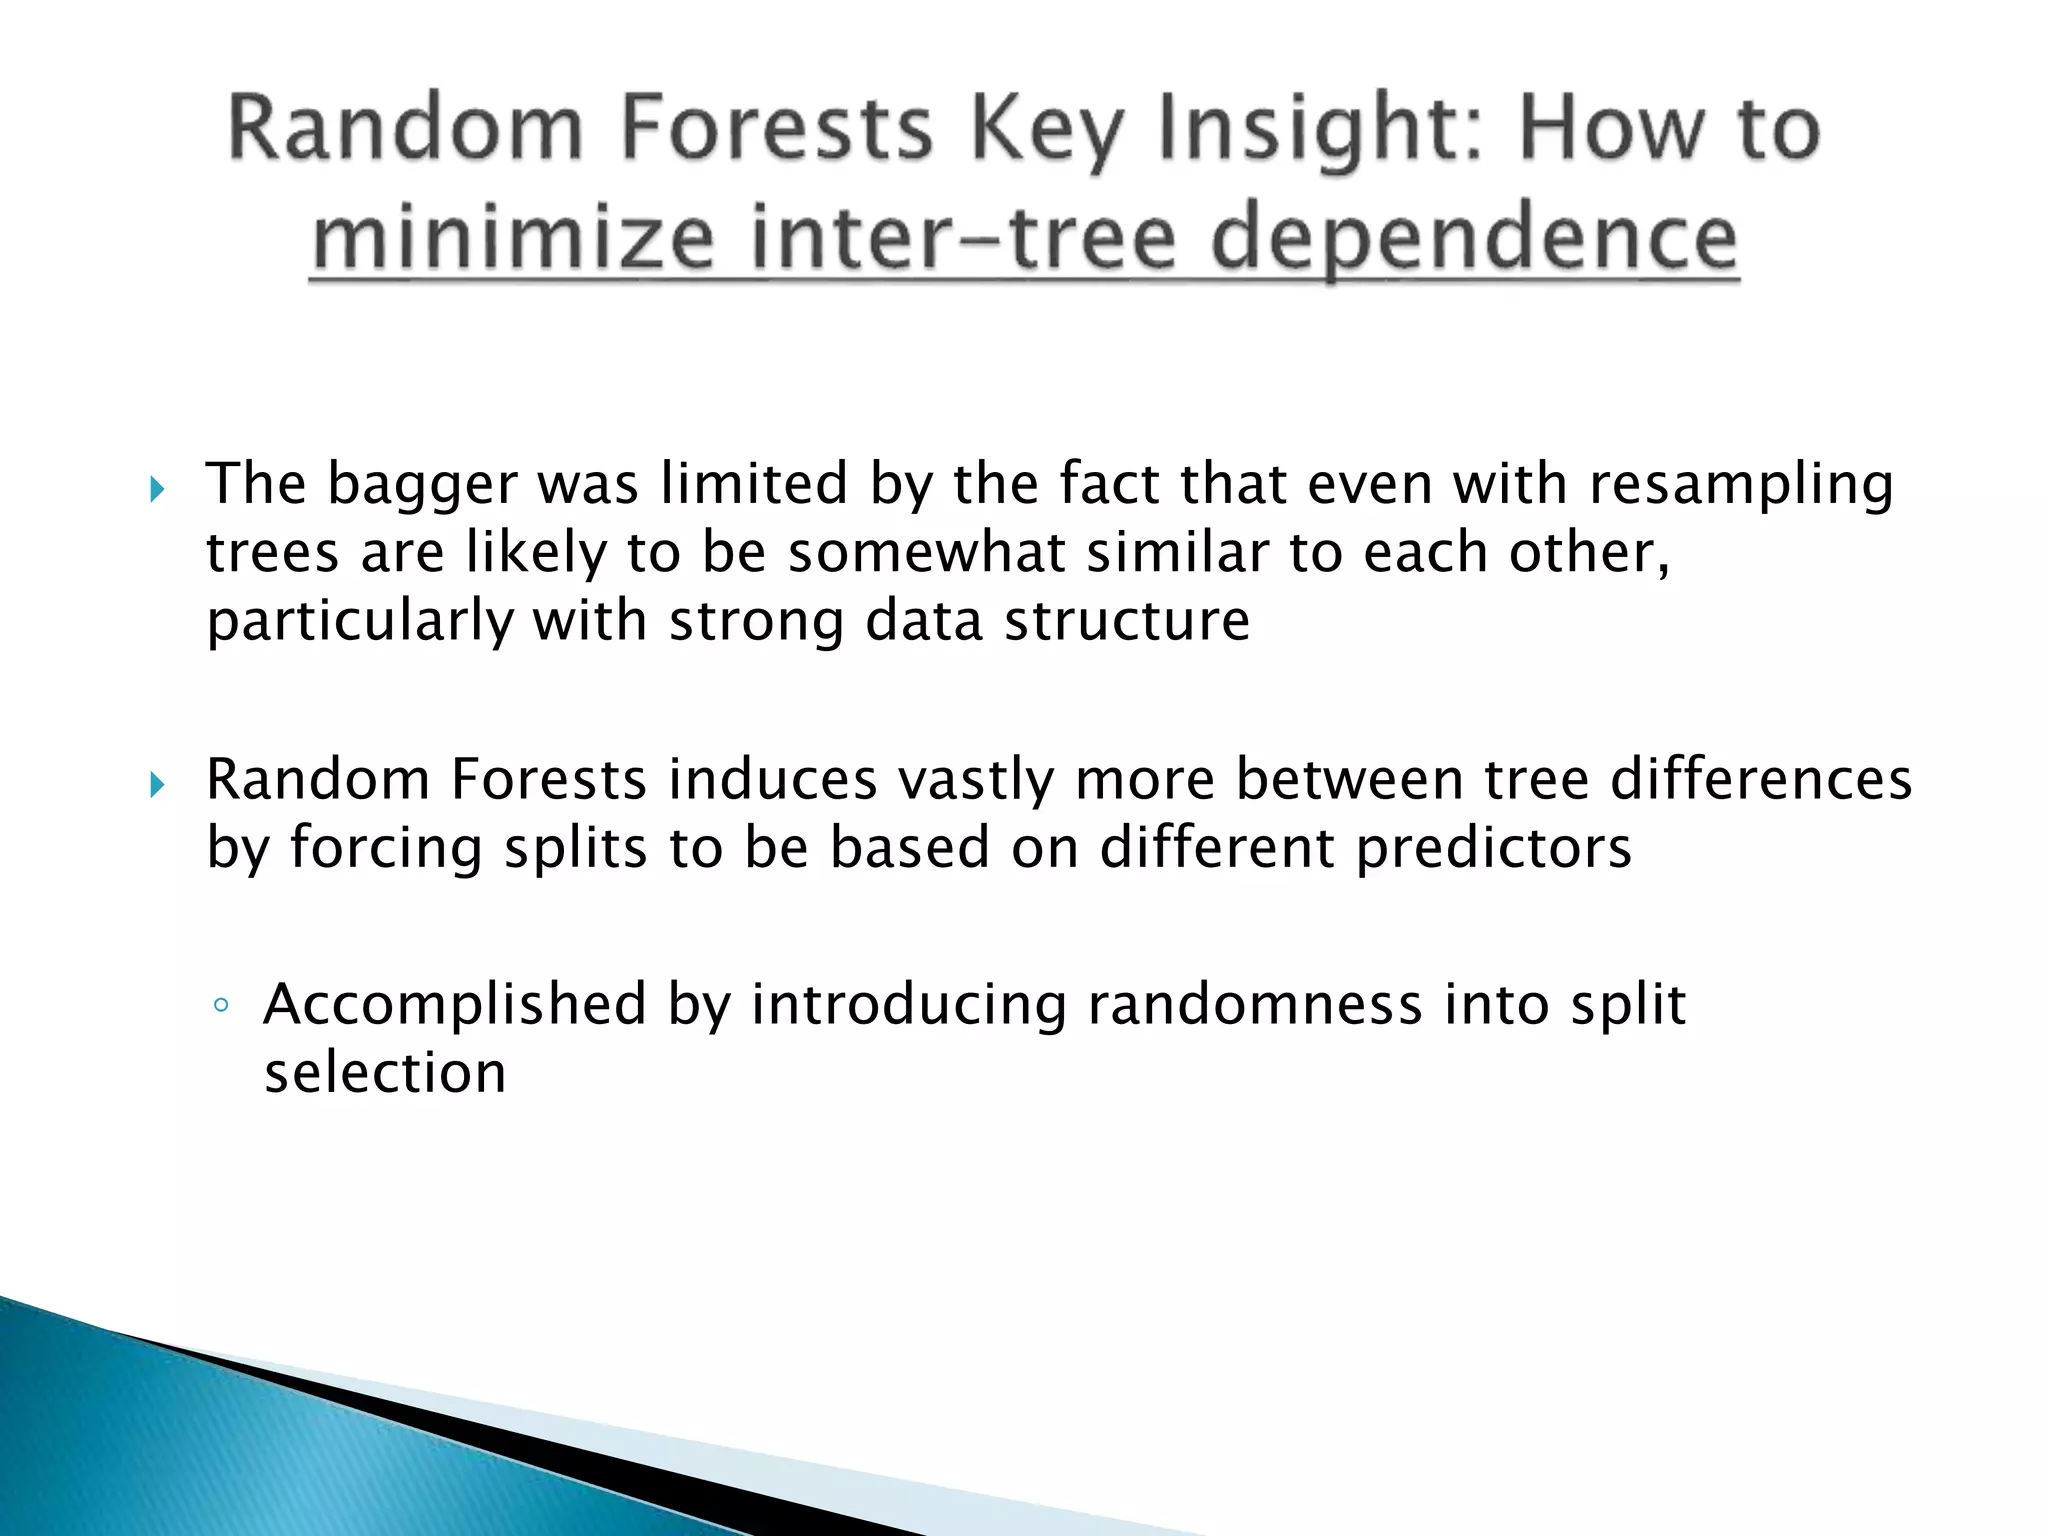
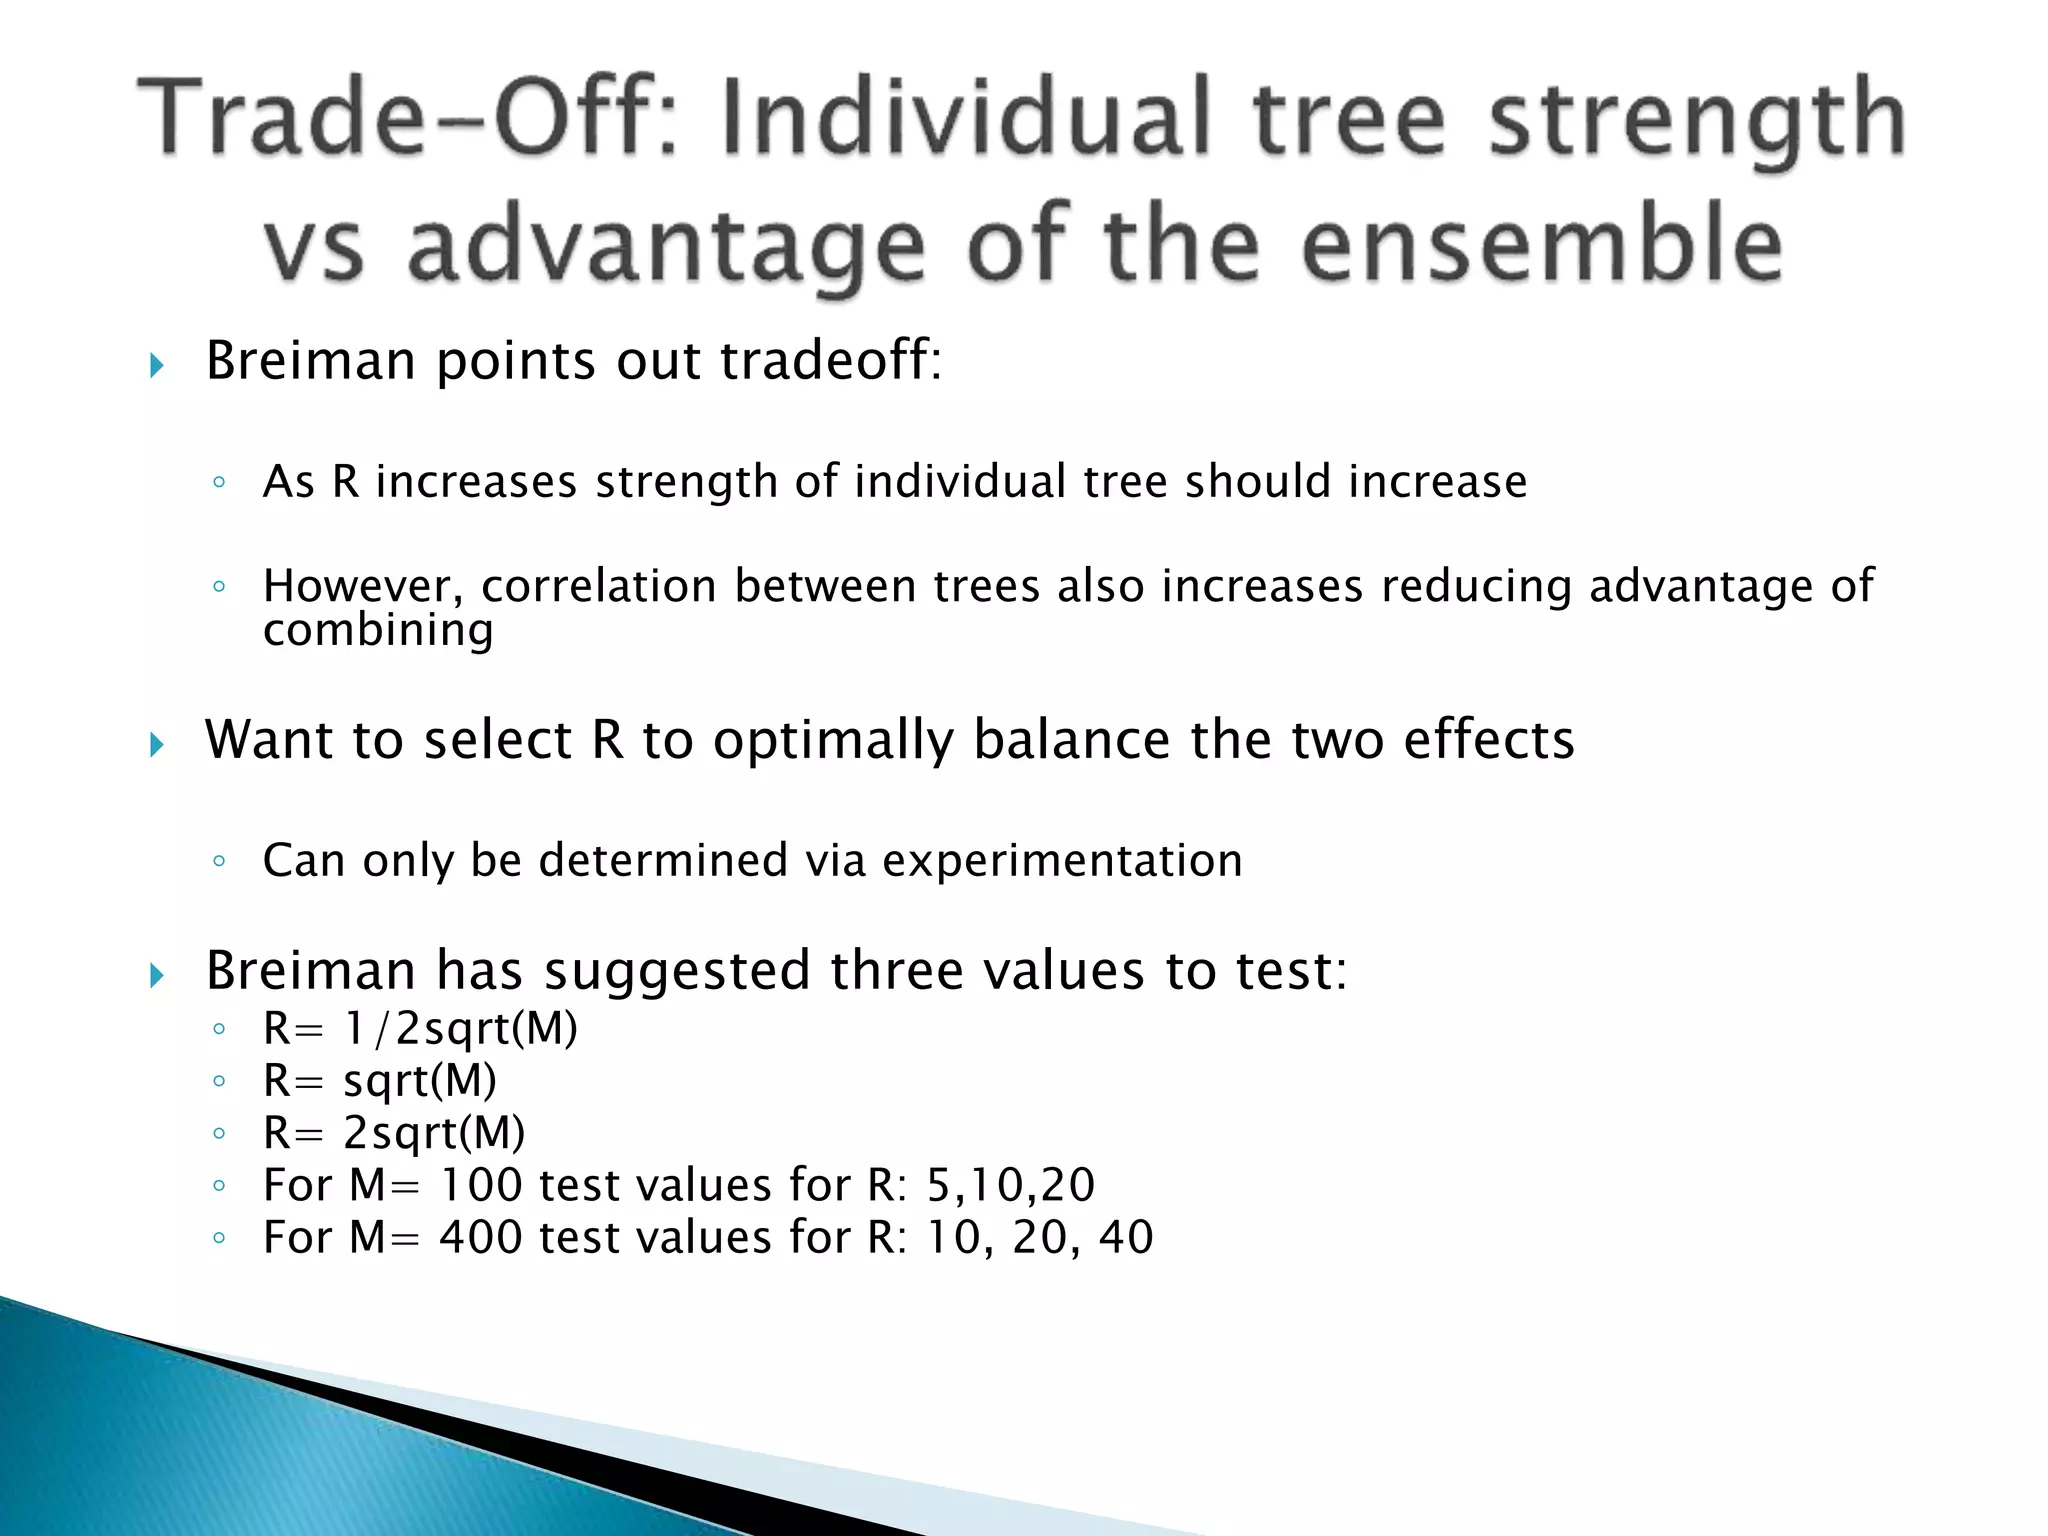
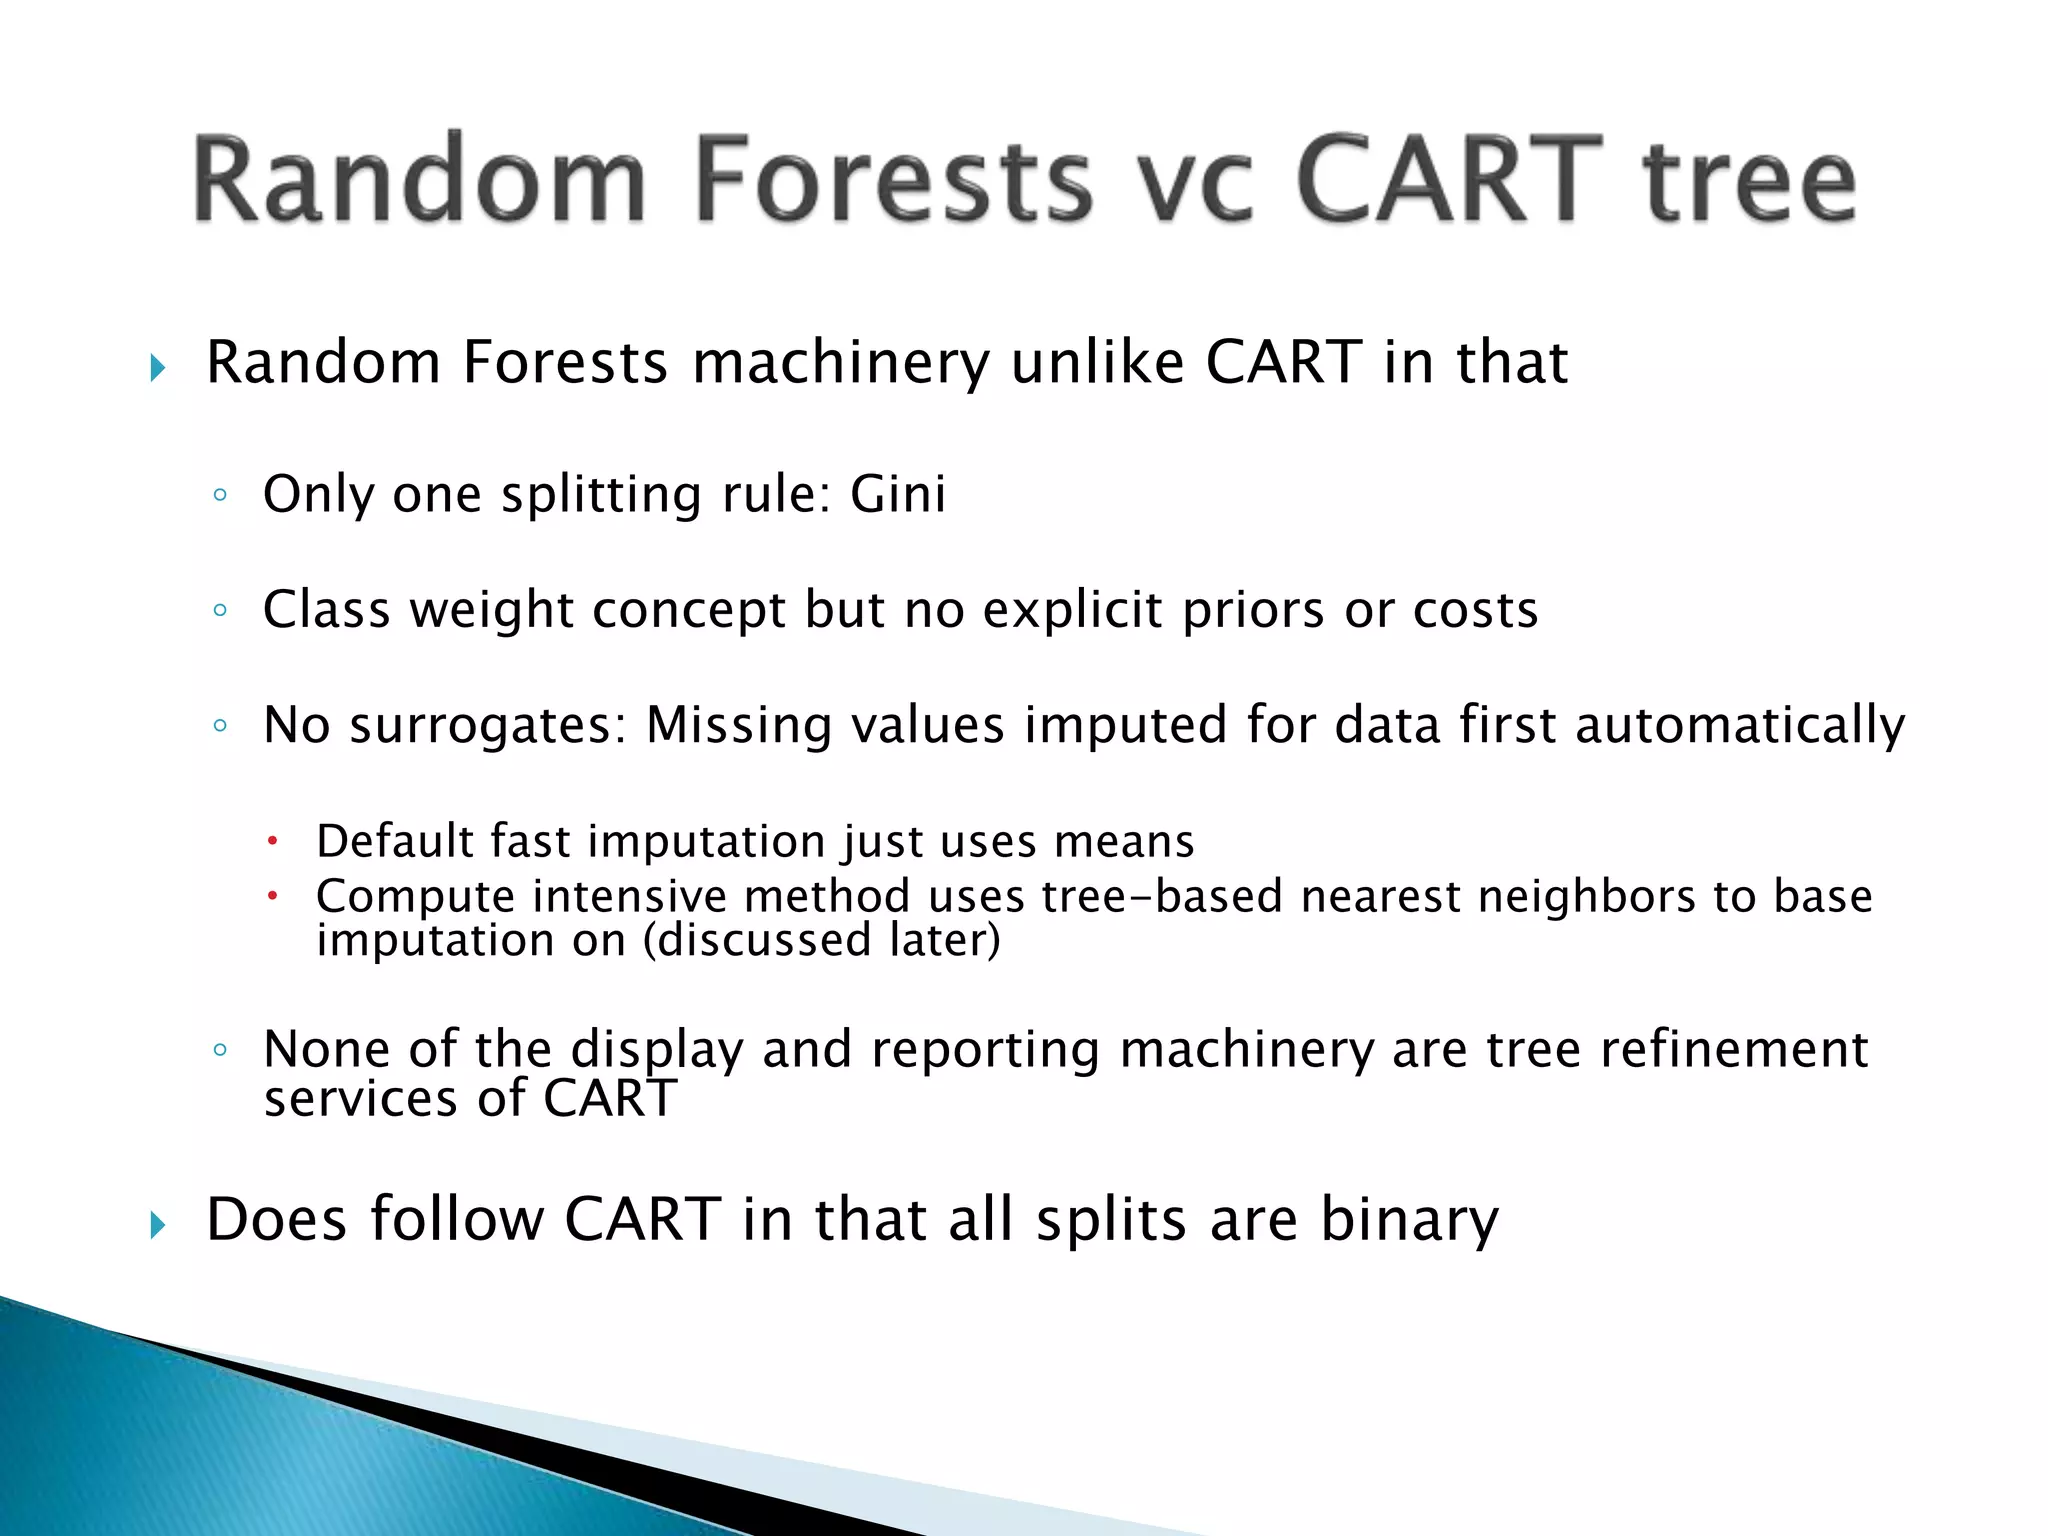
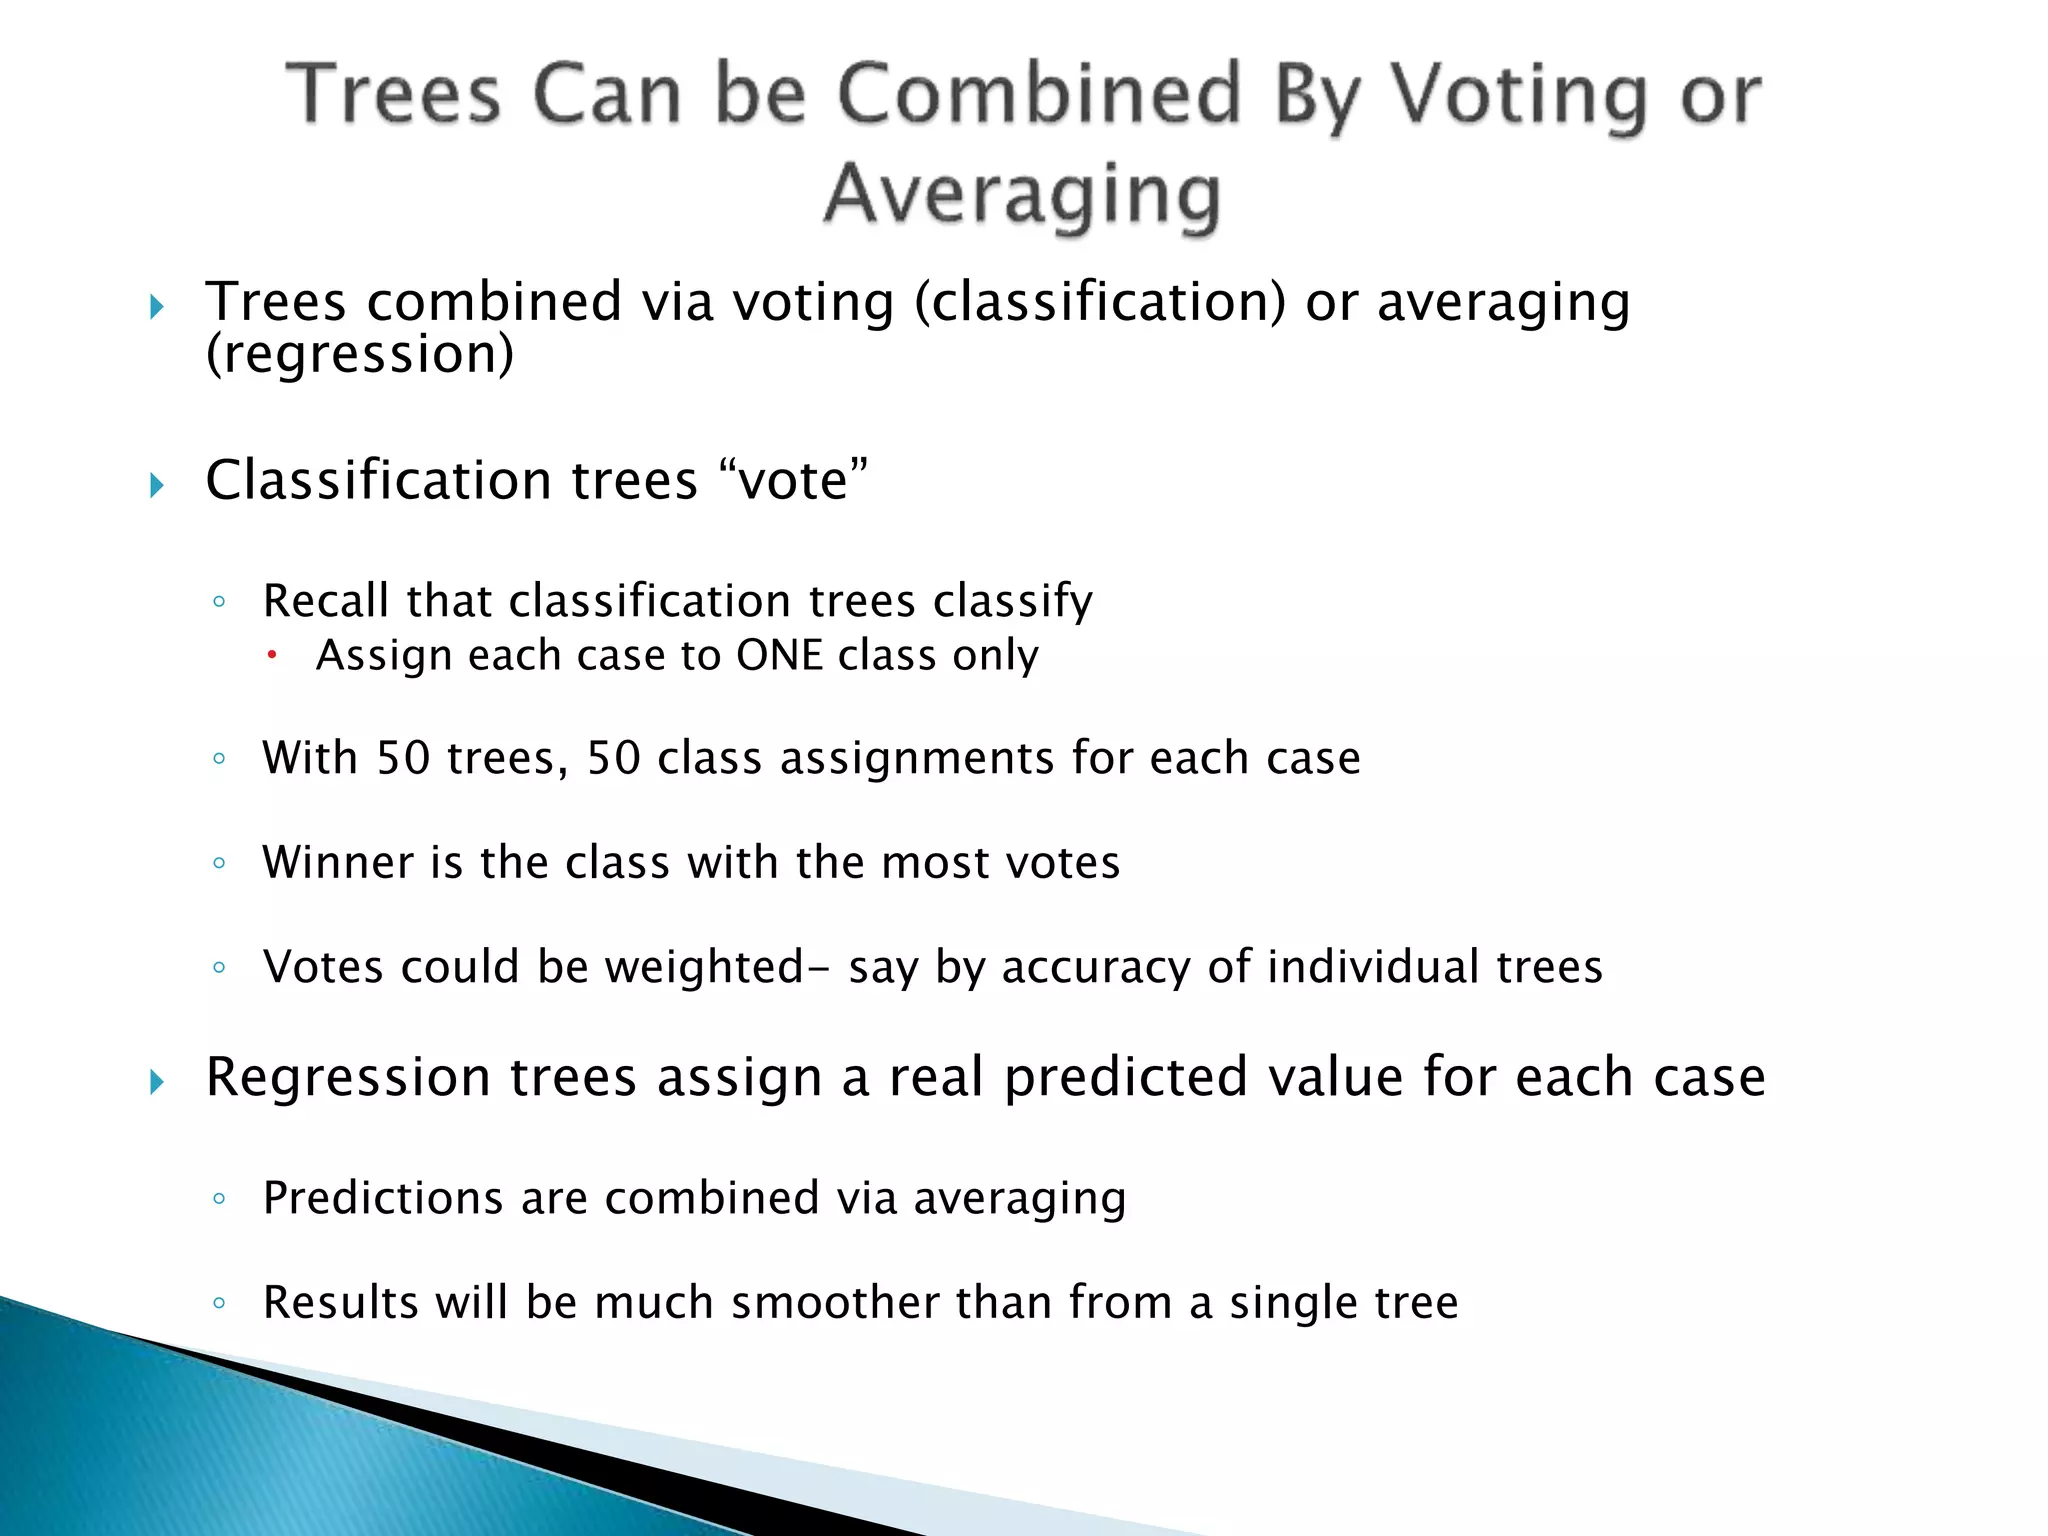
This document provides an introduction to random forests, which are an ensemble machine learning method for classification and regression. Random forests build on decision trees but average multiple tree predictions to improve accuracy over a single tree. Each tree is constructed using a random sample of data and random subsets of features. This introduces variability that improves predictive performance compared to single trees or bagged trees that use all features. The document outlines the key characteristics and advantages of random forests, such as high accuracy, ability to handle large datasets with many variables, and resistance to overfitting.
Data mining involves using algorithms to find patterns in large datasets. It is commonly used in market research to perform tasks like classification, prediction, and association rule mining. The document discusses several common data mining techniques like decision trees, naive Bayes classification, and regression trees. It also covers related topics like cross-validation, bagging, and boosting methods used for improving model performance.
This document provides an overview of data mining techniques discussed in Chapter 3, including parametric and nonparametric models, statistical perspectives on point estimation and error measurement, Bayes' theorem, decision trees, neural networks, genetic algorithms, and similarity measures. Nonparametric techniques like neural networks, decision trees, and genetic algorithms are particularly suitable for data mining applications involving large, dynamically changing datasets.
The document summarizes a machine learning project to predict Parkinson's disease. It discusses cleaning and exploring the data, which includes speech attribute data from 240 subjects. Feature importance analysis found attributes like Delta3 and MFCCs to be important. Various machine learning models were tested, with random forest performing best at 97.2% accuracy after cross-validation. The conclusion discusses further optimizing models and collecting more data. Lessons learned note challenges of limited labeled data and importance of domain knowledge.
Comprehensive Survey of Data Classification & Prediction Techniquesijsrd.com
In this paper, we present an literature survey of the modern data classification and prediction algorithms. All these algorithms are very important in real world applications like- heart disease prediction, cancer prediction etc. Classification of data is a very popular and computationally expensive task. The fundamentals of data classification are also discussed in brief.
Overview of basic concepts related to Data Mining: database, data model, fuzzy sets, information retrieval, data warehouse, dimensional modeling, data cubes, OLAP, machine learning.
IDENTIFICATION OF OUTLIERS IN OXAZOLINES AND OXAZOLES HIGH DIMENSION MOLECULA...IJDKP
This document summarizes an algorithm called Principal Component Outlier Detection (PrCmpOut) for identifying outliers in high-dimensional molecular descriptor datasets. PrCmpOut uses principal component analysis to transform the data into a lower-dimensional space, where it can more efficiently detect outliers using robust estimators of location and covariance. The properties of PrCmpOut are analyzed and compared to other robust outlier detection methods through simulation studies using a dataset of oxazoline and oxazole molecular descriptors. Numerical results show PrCmpOut performs well at outlier detection in high-dimensional data.
This document discusses random forest machine learning algorithms and their use in predictive modeling. It provides context on random forests, including that they perform well for both classification and regression tasks, are less prone to overfitting than decision trees, and provide good predictive accuracy while also being interpretable. The document then discusses preprocessing methods like stemming, removing punctuation and stop words that can be applied before using natural language processing algorithms. It highlights the advantages of random forests, such as their ability to handle different data types, parallelizability, and stability. It also notes limitations like lack of interpretability for some users and potential for overfitting on some data sets.
1. The document discusses the process of preparing quantitative data for analysis, which includes editing data, handling blank responses, coding responses, categorizing variables, and entering data into software for analysis.
2. It then discusses objectives and methods for analyzing the data, including getting a feel for the data through descriptive statistics, testing the reliability and validity of measures, and testing hypotheses through appropriate statistical tests.
3. Finally, it recommends several software packages that can be used to facilitate data collection, entry, and analysis, and describes how expert systems can help choose the most appropriate statistical tests.
1. The document discusses decision trees, bagging, and random forests. It provides an overview of how classification and regression trees (CART) work using a binary tree data structure and recursive data partitioning. It then explains how bagging generates diverse trees by bootstrap sampling and averages the results. Finally, it describes how random forests improve upon bagging by introducing random feature selection to generate less correlated and more accurate trees.
Data preprocessing involves cleaning data by filling in missing values, smoothing noisy data, and resolving inconsistencies. It also includes integrating and transforming data from multiple sources, reducing data volume through aggregation, dimensionality reduction, and discretization while maintaining analytical results. The key goals of preprocessing are to improve data quality and prepare the data for mining tasks through techniques like data cleaning, integration, transformation, reduction, and discretization of attributes into intervals or concept hierarchies.
Data Science - Part V - Decision Trees & Random Forests Derek Kane
This lecture provides an overview of decision tree machine learning algorithms and random forest ensemble techniques. The practical example includes diagnosing Type II diabetes and evaluating customer churn in the telecommunication industry.
On the Measurement of Test Collection ReliabilityJulián Urbano
The reliability of a test collection is proportional to the number of queries it contains. But building a collection with many queries is expensive, so researchers have to find a balance between reliability and cost. Previous work on the measurement of test collection reliability relied on data-based approaches that contemplated random what if scenarios, and provided indicators such as swap rates and Kendall tau correlations. Generalizability Theory was proposed as an alternative founded on analysis of variance that provides reliability indicators based on statistical theory. However, these reliability indicators are hard to interpret in practice, because they do not correspond to well known indicators like Kendall tau correlation. We empirically established these relationships based on data from over 40 TREC collections, thus filling the gap in the practical interpretation of Generalizability Theory. We also review the computation of these indicators, and show that they are extremely dependent on the sample of systems and queries used, so much that the required number of queries to achieve a certain level of reliability can vary in orders of magnitude. We discuss the computation of confidence intervals for these statistics, providing a much more reliable tool to measure test collection reliability. Reflecting upon all these results, we review a wealth of TREC test collections, arguing that they are possibly not as reliable as generally accepted and that the common choice of 50 queries is insufficient even for stable rankings.
This document discusses various machine learning techniques for classification and prediction. It covers decision tree induction, tree pruning, Bayesian classification, Bayesian belief networks, backpropagation, association rule mining, and ensemble methods like bagging and boosting. Classification involves predicting categorical labels while prediction predicts continuous values. Key steps for preparing data include cleaning, transformation, and comparing different methods based on accuracy, speed, robustness, scalability, and interpretability.
Data Mining - Classification Of Breast Cancer Dataset using Decision Tree Ind...Sunil Nair
The document summarizes research on classifying breast cancer datasets using decision trees. The researchers used a Wisconsin breast cancer dataset containing 699 instances with 10 attributes plus a class attribute. They preprocessed the data to handle missing values, compared various classification methods, and achieved the best accuracy of 97% using decision trees with attribute selection. Issues addressed included unbalanced classes and future work proposed methods like clustering and multiple classifiers to further improve accuracy.
Random Forest Tutorial | Random Forest in R | Machine Learning | Data Science...Edureka!
This Edureka Random Forest tutorial will help you understand all the basics of Random Forest machine learning algorithm. This tutorial is ideal for both beginners as well as professionals who want to learn or brush up their Data Science concepts, learn random forest analysis along with examples. Below are the topics covered in this tutorial:
1) Introduction to Classification
2) Why Random Forest?
3) What is Random Forest?
4) Random Forest Use Cases
5) How Random Forest Works?
6) Demo in R: Diabetes Prevention Use Case
You can also take a complete structured training, check out the details here: https://goo.gl/AfxwBc
This document summarizes quantitative data analysis methods for hypothesis testing including measures of central tendency, variability, relative standing, and linear relationships. It also discusses data warehousing, data mining, and operations research techniques. Finally, it covers ethics and security considerations for handling information technology including protecting individual privacy and ensuring data accuracy.
Data analytics experts Metageni briefly explain how global information giant LexisNexis models user success from user analytics data using machine learning. A Moo.com tech talk for analysts and engineers with an interest in data science, covering the high level classifier method used in support of LexisNexis, working with their global digital team.
Online index recommendations for high dimensional databases using query workl...Mumbai Academisc
The document proposes a technique to recommend indexes for high-dimensional databases based on query workloads. It detects when query patterns change and dynamically adjusts indexes to maintain good performance. Lower-dimensional indexes that represent user access patterns are used to accurately prune large portions of data irrelevant to queries. As query patterns evolve over time, the technique monitors workloads and detects changes to evolve indexes and preserve query response speeds.
[Women in Data Science Meetup ATX] Decision Trees Nikolaos Vergos
Decision trees are a supervised learning technique that can be used for both classification and regression problems. They work by recursively splitting a data set into purer and purer subsets based on an impurity measure, with the goal of ending up with subsets consisting of single class members. Common impurity measures include information gain and the GINI index. Decision trees can overfit data, so techniques like bagging and random forests are used to combine multiple decision trees to reduce variance.
Study and Analysis of K-Means Clustering Algorithm Using RapidminerIJERA Editor
Institution is a place where teacher explains and student just understands and learns the lesson. Every student has his own definition for toughness and easiness and there isn’t any absolute scale for measuring knowledge but examination score indicate the performance of student. In this case study, knowledge of data mining is combined with educational strategies to improve students’ performance. Generally, data mining (sometimes called data or knowledge discovery) is the process of analysing data from different perspectives and summarizing it into useful information. Data mining software is one of a number of analytical tools for data. It allows users to analyse data from many different dimensions or angles, categorize it, and summarize the relationships identified. Technically, data mining is the process of finding correlations or patterns among dozens of fields in large relational database. Cluster analysis or clustering is the task of grouping a set of objects in such a way that objects in the same group (called a cluster) are more similar (in some sense or another) to each other than to those in other groups (clusters).This project describes the use of clustering data mining technique to improve the efficiency of academic performance in the educational institutions .In this project, a live experiment was conducted on students .By conducting an exam on students of computer science major using MOODLE(LMS) and analysing that data generated using RapidMiner(Datamining Software) and later by performing clustering on the data. This method helps to identify the students who need special advising or counselling by the teacher to give high quality of education.
Novel Frequency Domain Classification Algorithm Based On Parameter Weight Fac...ahmedbohy
This work proposes two new classification techniques for predicting hepatitis mortality using a dataset from Ljubljana University. The first technique estimates missing values by finding the minimum difference between attribute values of the instance with missing values and other instances. The second technique computes a weight factor for each attribute by correlating the decision attribute with other attributes, and classifies new instances using correlation in the frequency domain on the top seven attributes. Experimental results on 155 instances show the frequency domain technique achieved a mean accuracy of 90.4%, higher than the first technique and previous methods.
Decision trees classify data using a series of binary tests on attributes. The CART framework is commonly used to design decision trees by greedily selecting tests that maximize decreases in impurity at each node. Trees are learned recursively by splitting nodes until reaching pure leaf nodes. Cross-validation is used to select an optimal stopping point to prevent overfitting and maximize generalization to new data.
IRJET- An Extensive Study of Sentiment Analysis Techniques and its Progressio...IRJET Journal
This document discusses the progression of sentiment analysis techniques from traditional machine learning approaches to modern deep learning methods. It begins with an overview of traditional techniques like Naive Bayes and support vector machines. It then discusses how these methods were improved through techniques like feature selection, handling negation, and scaling to big data. The document traces how research increasingly focused on applying neural networks to sentiment analysis. It aims to provide insight into how state-of-the-art deep learning models are replacing earlier algorithms for sentiment analysis.
This document discusses Dr. Wayne Danter's research using artificial intelligence tools to predict biological activity of molecular structures. His method involves using CART to analyze public HIV data and build predictive models. CART generates decision trees to identify important variables that predict if a molecule is biologically active against HIV. Dr. Danter then uses MARS and NeuroShell Classifier to further improve prediction accuracy. His proprietary CHEMSASTM algorithm teaches neural networks to relate molecular structure to function for screening potential HIV drugs. Using these methods, Dr. Danter has achieved over 96% accuracy in classifying 311 drugs' activity against HIV.
Performance evaluation of hepatitis diagnosis using single and multi classifi...ahmedbohy
The goal of our paper is to obtain superior accuracy of different classifiers or multi-classifiers fusion in diagnosing Hepatitis using world wide data set from Ljubljana University. We present an implementation among some of the classification methods which are defined as the best algorithms in medical field. Then we apply a fusion between classifiers to get the best multi-classifier fusion approach. By using confusion matrix to get classification accuracy which built in 10-fold cross validation technique. The experimental results show that for all data sets (complete, reduced, and no missing value) using multi-classifiers fusion achieved better accuracy than the single ones
This document provides an overview of exploratory data analysis (EDA). It discusses how EDA is used to generate and refine questions from data by visualizing, transforming, and modeling the data. Questions can come from hypotheses, problems, or the data itself. EDA plays a role in developing, testing, and refining theories, solving problems, and asking interesting questions about the data. The document emphasizes being skeptical of assumptions and open to multiple interpretations during EDA to maximize learning from the data. It introduces the dplyr and ggplot2 packages for selecting, filtering, summarizing, and visualizing data during the EDA process.
Data mining involves using algorithms to find patterns in large datasets. It is commonly used in market research to perform tasks like classification, prediction, and association rule mining. The document discusses several common data mining techniques like decision trees, naive Bayes classification, and regression trees. It also covers related topics like cross-validation, bagging, and boosting methods used for improving model performance.
Machine learning session6(decision trees random forrest)Abhimanyu Dwivedi
Concepts include decision tree with its examples. Measures used for splitting in decision tree like gini index, entropy, information gain, pros and cons, validation. Basics of random forests with its example and uses.
ensemble methods use multiple learning algorithms to obtain better predictive performance than could be obtained from any of the constituent learning algorithms alone.
An ensemble is itself a supervised learning algorithm, because it can be trained and then used to make predictions. The trained ensemble, therefore, represents a single hypothesis. This hypothesis, however, is not necessarily contained within the hypothesis space of the models from which it is built.
This document provides an overview of data mining concepts and techniques. It discusses topics such as predictive analytics, machine learning, pattern recognition, and artificial intelligence as they relate to data mining. It also covers specific data mining algorithms like decision trees, neural networks, and association rules. The document discusses supervised and unsupervised learning approaches and explains model evaluation techniques like accuracy, ROC curves, gains/lift curves, and cross-entropy. It emphasizes the importance of evaluating models on test data and monitoring performance over time as patterns change.
Introduction to random forest and gradient boosting methods a lectureShreyas S K
This presentation is an attempt to explain random forest and gradient boosting methods in layman terms with many real life examples related to the concepts
This document provides an overview of major data mining algorithms, including supervised learning techniques like decision trees, random forests, support vector machines, naive Bayes, and logistic regression. Unsupervised techniques discussed include clustering algorithms like k-means and EM, as well as association rule learning using the Apriori algorithm. Application areas and advantages/disadvantages of each technique are described. Libraries for implementing these algorithms in Python and R are also listed.
This document provides an overview of data mining techniques for predictive modeling, including classification and regression trees (CART), chi-squared automatic interaction detection (CHAID), neural networks, bagging, boosting, and examples of applying these techniques using SAS Enterprise Miner. It discusses data preparation, partitioning data into training, validation and test sets, handling missing data, selecting optimal tree size to avoid overfitting, and summarizes a preliminary decision tree model for predicting student GPA.
Bank - Loan Purchase Modeling
This case is about a bank which has a growing customer base. Majority of these customers are liability customers (depositors) with varying size of deposits. The number of customers who are also borrowers (asset customers) is quite small, and the bank is interested in expanding this base rapidly to bring in more loan business and in the process, earn more through the interest on loans. In particular, the management wants to explore ways of converting its liability customers to personal loan customers (while retaining them as depositors). A campaign that the bank ran last year for liability customers showed a healthy conversion rate of over 9% success. This has encouraged the retail marketing department to devise campaigns with better target marketing to increase the success ratio with a minimal budget. The department wants to build a model that will help them identify the potential customers who have a higher probability of purchasing the loan. This will increase the success ratio while at the same time reduce the cost of the campaign. The dataset has data on 5000 customers. The data include customer demographic information (age, income, etc.), the customer's relationship with the bank (mortgage, securities account, etc.), and the customer response to the last personal loan campaign (Personal Loan). Among these 5000 customers, only 480 (= 9.6%) accepted the personal loan that was offered to them in the earlier campaign.
Our job is to build the best model which can classify the right customers who have a higher probability of purchasing the loan. We are expected to do the following:
EDA of the data available. Showcase the results using appropriate graphs
Apply appropriate clustering on the data and interpret the output .
Build appropriate models on both the test and train data (CART & Random Forest). Interpret all the model outputs and do the necessary modifications wherever eligible (such as pruning).
Check the performance of all the models that you have built (test and train). Use all the model performance measures you have learned so far. Share your remarks on which model performs the best.
The document discusses decision tree modeling and random forests. It explains that decision trees grow by splitting nodes based on variables that best separate the data, stopping when nodes are pure or small. Random forests aggregate many decision trees grown on randomly sampled subsets of data to reduce overfitting. The document also introduces the concepts of bagging, where models are fit on resampled data and combined, and stacking, where the outputs of different models become new features for a linear model.
This document discusses various machine learning methods and provides intuitive explanations and visual analogies for them. It begins by noting the importance of understanding the intuition behind methods to properly apply them. It then summarizes several statistical learning and deep learning methods, providing brief explanations and visualizations for each. These include linear regression, generalized linear models, regularization techniques, tree-based methods, and neural networks. It concludes by discussing clustering, dimensionality reduction, ensemble methods, and time series forecasting techniques.
A start guide to the concepts and algorithms in machine learning, including regression frameworks, ensemble methods, clustering, optimization, and more. Mathematical knowledge is not assumed, and pictures/analogies demonstrate the key concepts behind popular and cutting-edge methods in data analysis.
Updated to include newer algorithms, such as XGBoost, and more geometrically/topologically-based algorithms. Also includes a short overview of time series analysis
An Introduction to Random Forest and linear regression algorithmsShouvic Banik0139
This presentation aims to provide a comprehensive understanding of the Random Forest and Linear Regression algorithms, their functioning, and significance. It is designed to equip the audience with the knowledge required to apply these algorithms effectively in practical scenarios, and to further enhance their expertise in the field.
This document provides an introduction to decision trees, which are a type of predictive model that uses a tree-like structure to determine the class of records. Decision trees work by recursively splitting a dataset into purer subsets based on attribute values, resulting in a flowchart-like structure. They have an intuitive appeal as rules can be represented visually or as "if-then" statements. The document discusses key aspects of decision trees such as how they are constructed, evaluated, pruned to prevent overfitting, and their advantages and limitations for classification tasks.
This document provides an introduction to decision trees, which are a type of predictive model that uses a tree-like structure to determine the class of records. Decision trees work by recursively splitting a dataset into purer subsets based on attribute values, resulting in a flowchart-like structure. They provide intuitive rules for classification and have good accuracy for predictive tasks. The document discusses key aspects of decision trees such as how they are constructed, evaluated, pruned to prevent overfitting, and their advantages and limitations for data mining applications.
Decision Tree Machine Learning Detailed Explanation.DrezzingGaming
Decision Tree is a machine learning algorithm that can be used for both classification and regression problems. It creates a flow-chart like structure starting with an initial node which branches out further into other sub-nodes. The documents discuss decision tree structure, splitting criteria, feature selection and real world applications. Code in Python is provided to demonstrate building a basic decision tree classifier on the iris dataset.
Lecture 9 - Decision Trees and Ensemble Methods, a lecture in subject module ...Maninda Edirisooriya
Decision Trees and Ensemble Methods is a different form of Machine Learning algorithm classes. This was one of the lectures of a full course I taught in University of Moratuwa, Sri Lanka on 2023 second half of the year.
Using Decision Trees to Analyze Online Learning Data Shalin Hai-Jew
In machine learning, decision trees enable researchers to identify possible indicators (variables) that are important in predicting classifications, and these offer a sequence of nuanced groupings. For example, are there “tells” which would suggest that a particular student will achieve a particular grade in a course? Are there indicators that would identify learners who would select a particular field of study vs. another?
This session will introduce how decision trees are used to model data based on supervised machine learning (with labeled training set data) and how such models may be evaluated for accuracy with test data, with the open-source tool, RapidMiner Studio. Several related analytical data visualizations will be shared: 2D spatial maps, decision trees, and others. Attendees will also experience how 2x2 contingency tables work with Type 1 and Type 2 errors (and how the accuracy of the machine learning model may be assessed) to represent model accuracy, and the strengths and weaknesses of decision trees applied to some use cases from higher education. In this session, various examples of possible outcomes will be discussed and related pre-modeling theorizing (vs. post-hoc) about what may be seen in terms of particular variables. The basic data structure for running the decision tree algorithm will be described. If time allows, relevant parameters for a decision tree model will be discussed: criterion (gain_ratio, information_gain, gini_index, and accuracy), minimal size for split, minimal leaf size, minimal gain, maximal depth (based on the need for human readability of decision trees), confidence, and pre-pruning (and the desired level).
Diabetes Prediction Using Machine Learningjagan477830
Our proposed system aims at Predicting the number of Diabetes patients and eliminating the risk of False Negatives Drastically.
In proposed System, we use Random forest, Decision tree, Logistic Regression and Gradient Boosting Classifier to classify the Patients who are affected with Diabetes or not.
Random Forest and Decision Tree are the algorithms which can be used for both classification and regression.
The dataset is classified into trained and test dataset where the data can be trained individually, these algorithms are very easy to implement as well as very efficient in producing better results and can able to process large amount of data.
Even for large dataset these algorithms are extremely fast and can able to give accuracy of about over 90%.
This presentation discusses about following topics:
Types of Problems Solved Using Artificial Intelligence Algorithms
Problem categories
Classification Algorithms
Naive Bayes
Example: A person playing golf
Decision Tree
Random Forest
Logistic Regression
Support Vector Machine
K Nearest Neighbors
Similar to Introduction to RandomForests 2004 (20)
Improve Your Regression with CART and RandomForestsSalford Systems
Why You Should Watch: Learn the fundamentals of tree-based machine learning algorithms and how to easily fine tune and improve your Random Forest regression models.
Abstract: In this webinar we'll introduce you to two tree-based machine learning algorithms, CART® decision trees and RandomForests®. We will discuss the advantages of tree based techniques including their ability to automatically handle variable selection, variable interactions, nonlinear relationships, outliers, and missing values. We'll explore the CART algorithm, bootstrap sampling, and the Random Forest algorithm (all with animations) and compare their predictive performance using a real world dataset.
Improved Predictions in Structure Based Drug Design Using Cart and Bayesian M...Salford Systems
The document discusses using in silico methods like virtual screening and predictive modeling to improve drug discovery. It presents results from applying techniques like receptor docking, machine learning algorithms, and Bayesian modeling to develop improved scoring functions that better distinguish active from inactive compounds. These scoring functions helped identify key molecular properties that correlated with active hits. The methods showed improved ability to find active hits compared to previous scoring functions.
Churn Modeling-For-Mobile-Telecommunications Salford Systems
This document summarizes a study on predicting customer churn for a major mobile provider. TreeNet models were used to predict the probability of customers churning (switching providers) within a 30-60 day period. TreeNet models significantly outperformed other methods, increasing accuracy and the proportion of high-risk customers identified. Applying the most accurate TreeNet models could translate to millions in additional annual revenue by helping the provider preemptively retain more customers.
This document provides dos and don'ts for data mining based on experiences from various practitioners. It lists important steps like clearly defining objectives, simplifying solutions, preparing data, using multiple techniques, and checking models. It warns against underestimating preparation, overfitting models, and collecting excessive unhelpful data. Practitioners emphasize the importance of domain knowledge, transparency, and creating models that are understandable to stakeholders.
9 Data Mining Challenges From Data Scientists Like YouSalford Systems
The document outlines 9 challenges faced by data scientists: 1) poor quality data issues like dirty, missing, or inadequate data, 2) lack of understanding of data mining techniques, 3) lack of good literature on important topics and techniques, 4) difficulty for academic institutions accessing commercial-grade software at reasonable costs, 5) accommodating data from different sources and formats, 6) updating models constantly with new incoming data for online machine learning, 7) dealing with huge datasets requiring distributed approaches, 8) determining the right questions to ask of the data, and 9) remaining objective and letting the data lead rather than preconceptions.
This document contains a collection of quotes related to statistics and data. Some key quotes emphasize that while data and information are important, they must be used carefully and combined with human intelligence, judgement, and insight. Other quotes note that statistics can be flexible and misleading if not interpreted carefully, and that collecting quality data over long periods of time is important for analysis. The overall message is that statistics are a useful tool but have limitations, and human discernment is still needed.
Using CART For Beginners with A Teclo Example DatasetSalford Systems
Familiarize yourself with CART Decision Tree technology in this beginner's tutorial using a telecommunications example dataset from the 1990s. By the end of this tutorial you should feel comfortable using CART on your own with sample or real-world data.
The document provides an overview of a 4-part webinar covering the evolution of regression techniques from classical least squares to more advanced machine learning methods like random forests and gradient boosting. It outlines the topics to be covered in each part, including classical regression, regularized regression techniques like ridge regression, LASSO, and MARS, and ensemble methods like random forests and TreeNet gradient boosted trees. Examples using the Boston housing data set are provided to illustrate some of these techniques.
This document discusses how educational institutions can use data mining software to better understand and support their students. It outlines several areas where data analysis can provide insights, such as predicting student performance based on more than just grades, understanding factors that lead to success or failure and graduation, determining the effectiveness of support programs, identifying which recruitment strategies and financial packages attract students, and predicting those most at risk of dropping out or defaulting on loans. The overall goal is to enhance student outcomes and institutional management through analytics.
Comparison of statistical methods commonly used in predictive modelingSalford Systems
This document compares four statistical methods commonly used in predictive modelling: Logistic Multiple Regression (LMR), Principal Component Regression (PCR), Classification and Regression Tree analysis (CART), and Multivariate Adaptive Regression Splines (MARS). It applies these methods to two ecological data sets to test their accuracy, reliability, ease of use, and implementation in a geographic information system (GIS). The results show that independent data is needed to validate models, and that MARS and CART achieved the best prediction success, although CART models became too complex for cartographic purposes with a large number of data points.
TreeNet Tree Ensembles & CART Decision Trees: A Winning CombinationSalford Systems
Understand CART decision tree pros/cons, how TreeNet stochastic gradient boosting ca n help overcome single-tree challenges, and what the advantages are when using CART and TreeNet in combination for predictive modeling success.
Salford Systems offers several products for data mining and predictive modeling. The table compares features of their Basic, Pro, ProEx, and Ultra components. The Basic component includes basic modeling, reporting, and automation features. Pro adds additional modeling engines and missing data handling capabilities. ProEx further expands the supported modeling techniques and automations. Ultra provides the most extensive set of features, including additional modeling pipelines, ensemble methods, and tree-based algorithms.
This document provides an introduction to MARS (Multivariate Adaptive Regression Splines), an automated regression modeling tool. MARS can build accurate predictive models for continuous and binary dependent variables by automatically selecting variables, determining transformations and interactions between variables, and handling missing data. It efficiently searches through all possible models to identify an optimal solution. The document explains how MARS works, provides settings to configure MARS, and uses the Boston housing dataset to demonstrate the basic steps of building a MARS model.
The document discusses combining CART (Classification and Regression Tree) and logistic regression models to take advantage of their respective strengths in classification and data mining tasks. It describes how running a logistic regression on the entire dataset using CART terminal node assignments as dummy variables allows the logistic model to find effects across nodes that CART cannot detect. This improves CART's predictions by imposing slopes on cases within nodes and providing a more granular, continuous response than CART alone. The approach also allows compensating for some of CART's weaknesses like coarse-grained responses.
When building a predictive model in SPM, you'll want to know exactly what you did to get your results. This short slide deck will show you how to review your work in the session logs.
The document discusses techniques for compressing and extracting rules from TreeNet models. It describes how TreeNet has achieved high predictive performance but its models can be refined further. Regularized regression can be applied to the trees or nodes in a TreeNet model to combine similar trees, reweight trees, and select a compressed subset of trees without much loss in accuracy. This "model compression" technique aims to simplify TreeNet models for improved deployment while maintaining good predictive performance.
TreeNet is a machine learning technique called stochastic gradient boosting developed by Jerome Friedman. It builds decision tree models in a stage-wise fashion, with each subsequent tree attempting to correct the errors of previous trees, resulting in a very accurate predictive model. TreeNet can handle both classification and regression problems, and has advantages such as being able to capture complex variable interactions and resist overfitting. It provides useful outputs for interpreting models such as variable importance rankings and partial dependency plots.
Unlock the Future of Search with MongoDB Atlas_ Vector Search Unleashed.pdfMalak Abu Hammad
Discover how MongoDB Atlas and vector search technology can revolutionize your application's search capabilities. This comprehensive presentation covers:
* What is Vector Search?
* Importance and benefits of vector search
* Practical use cases across various industries
* Step-by-step implementation guide
* Live demos with code snippets
* Enhancing LLM capabilities with vector search
* Best practices and optimization strategies
Perfect for developers, AI enthusiasts, and tech leaders. Learn how to leverage MongoDB Atlas to deliver highly relevant, context-aware search results, transforming your data retrieval process. Stay ahead in tech innovation and maximize the potential of your applications.
#MongoDB #VectorSearch #AI #SemanticSearch #TechInnovation #DataScience #LLM #MachineLearning #SearchTechnology
Dive into the realm of operating systems (OS) with Pravash Chandra Das, a seasoned Digital Forensic Analyst, as your guide. 🚀 This comprehensive presentation illuminates the core concepts, types, and evolution of OS, essential for understanding modern computing landscapes.
Beginning with the foundational definition, Das clarifies the pivotal role of OS as system software orchestrating hardware resources, software applications, and user interactions. Through succinct descriptions, he delineates the diverse types of OS, from single-user, single-task environments like early MS-DOS iterations, to multi-user, multi-tasking systems exemplified by modern Linux distributions.
Crucial components like the kernel and shell are dissected, highlighting their indispensable functions in resource management and user interface interaction. Das elucidates how the kernel acts as the central nervous system, orchestrating process scheduling, memory allocation, and device management. Meanwhile, the shell serves as the gateway for user commands, bridging the gap between human input and machine execution. 💻
The narrative then shifts to a captivating exploration of prominent desktop OSs, Windows, macOS, and Linux. Windows, with its globally ubiquitous presence and user-friendly interface, emerges as a cornerstone in personal computing history. macOS, lauded for its sleek design and seamless integration with Apple's ecosystem, stands as a beacon of stability and creativity. Linux, an open-source marvel, offers unparalleled flexibility and security, revolutionizing the computing landscape. 🖥️
Moving to the realm of mobile devices, Das unravels the dominance of Android and iOS. Android's open-source ethos fosters a vibrant ecosystem of customization and innovation, while iOS boasts a seamless user experience and robust security infrastructure. Meanwhile, discontinued platforms like Symbian and Palm OS evoke nostalgia for their pioneering roles in the smartphone revolution.
The journey concludes with a reflection on the ever-evolving landscape of OS, underscored by the emergence of real-time operating systems (RTOS) and the persistent quest for innovation and efficiency. As technology continues to shape our world, understanding the foundations and evolution of operating systems remains paramount. Join Pravash Chandra Das on this illuminating journey through the heart of computing. 🌟
How to Interpret Trends in the Kalyan Rajdhani Mix Chart.pdfChart Kalyan
A Mix Chart displays historical data of numbers in a graphical or tabular form. The Kalyan Rajdhani Mix Chart specifically shows the results of a sequence of numbers over different periods.
Monitoring and Managing Anomaly Detection on OpenShift.pdfTosin Akinosho
Monitoring and Managing Anomaly Detection on OpenShift
Overview
Dive into the world of anomaly detection on edge devices with our comprehensive hands-on tutorial. This SlideShare presentation will guide you through the entire process, from data collection and model training to edge deployment and real-time monitoring. Perfect for those looking to implement robust anomaly detection systems on resource-constrained IoT/edge devices.
Key Topics Covered
1. Introduction to Anomaly Detection
- Understand the fundamentals of anomaly detection and its importance in identifying unusual behavior or failures in systems.
2. Understanding Edge (IoT)
- Learn about edge computing and IoT, and how they enable real-time data processing and decision-making at the source.
3. What is ArgoCD?
- Discover ArgoCD, a declarative, GitOps continuous delivery tool for Kubernetes, and its role in deploying applications on edge devices.
4. Deployment Using ArgoCD for Edge Devices
- Step-by-step guide on deploying anomaly detection models on edge devices using ArgoCD.
5. Introduction to Apache Kafka and S3
- Explore Apache Kafka for real-time data streaming and Amazon S3 for scalable storage solutions.
6. Viewing Kafka Messages in the Data Lake
- Learn how to view and analyze Kafka messages stored in a data lake for better insights.
7. What is Prometheus?
- Get to know Prometheus, an open-source monitoring and alerting toolkit, and its application in monitoring edge devices.
8. Monitoring Application Metrics with Prometheus
- Detailed instructions on setting up Prometheus to monitor the performance and health of your anomaly detection system.
9. What is Camel K?
- Introduction to Camel K, a lightweight integration framework built on Apache Camel, designed for Kubernetes.
10. Configuring Camel K Integrations for Data Pipelines
- Learn how to configure Camel K for seamless data pipeline integrations in your anomaly detection workflow.
11. What is a Jupyter Notebook?
- Overview of Jupyter Notebooks, an open-source web application for creating and sharing documents with live code, equations, visualizations, and narrative text.
12. Jupyter Notebooks with Code Examples
- Hands-on examples and code snippets in Jupyter Notebooks to help you implement and test anomaly detection models.
Nunit vs XUnit vs MSTest Differences Between These Unit Testing Frameworks.pdfflufftailshop
When it comes to unit testing in the .NET ecosystem, developers have a wide range of options available. Among the most popular choices are NUnit, XUnit, and MSTest. These unit testing frameworks provide essential tools and features to help ensure the quality and reliability of code. However, understanding the differences between these frameworks is crucial for selecting the most suitable one for your projects.
Fueling AI with Great Data with Airbyte WebinarZilliz
This talk will focus on how to collect data from a variety of sources, leveraging this data for RAG and other GenAI use cases, and finally charting your course to productionalization.
HCL Notes and Domino License Cost Reduction in the World of DLAUpanagenda
Webinar Recording: https://www.panagenda.com/webinars/hcl-notes-and-domino-license-cost-reduction-in-the-world-of-dlau/
The introduction of DLAU and the CCB & CCX licensing model caused quite a stir in the HCL community. As a Notes and Domino customer, you may have faced challenges with unexpected user counts and license costs. You probably have questions on how this new licensing approach works and how to benefit from it. Most importantly, you likely have budget constraints and want to save money where possible. Don’t worry, we can help with all of this!
We’ll show you how to fix common misconfigurations that cause higher-than-expected user counts, and how to identify accounts which you can deactivate to save money. There are also frequent patterns that can cause unnecessary cost, like using a person document instead of a mail-in for shared mailboxes. We’ll provide examples and solutions for those as well. And naturally we’ll explain the new licensing model.
Join HCL Ambassador Marc Thomas in this webinar with a special guest appearance from Franz Walder. It will give you the tools and know-how to stay on top of what is going on with Domino licensing. You will be able lower your cost through an optimized configuration and keep it low going forward.
These topics will be covered
- Reducing license cost by finding and fixing misconfigurations and superfluous accounts
- How do CCB and CCX licenses really work?
- Understanding the DLAU tool and how to best utilize it
- Tips for common problem areas, like team mailboxes, functional/test users, etc
- Practical examples and best practices to implement right away
Trusted Execution Environment for Decentralized Process MiningLucaBarbaro3
Presentation of the paper "Trusted Execution Environment for Decentralized Process Mining" given during the CAiSE 2024 Conference in Cyprus on June 7, 2024.
Driving Business Innovation: Latest Generative AI Advancements & Success StorySafe Software
Are you ready to revolutionize how you handle data? Join us for a webinar where we’ll bring you up to speed with the latest advancements in Generative AI technology and discover how leveraging FME with tools from giants like Google Gemini, Amazon, and Microsoft OpenAI can supercharge your workflow efficiency.
During the hour, we’ll take you through:
Guest Speaker Segment with Hannah Barrington: Dive into the world of dynamic real estate marketing with Hannah, the Marketing Manager at Workspace Group. Hear firsthand how their team generates engaging descriptions for thousands of office units by integrating diverse data sources—from PDF floorplans to web pages—using FME transformers, like OpenAIVisionConnector and AnthropicVisionConnector. This use case will show you how GenAI can streamline content creation for marketing across the board.
Ollama Use Case: Learn how Scenario Specialist Dmitri Bagh has utilized Ollama within FME to input data, create custom models, and enhance security protocols. This segment will include demos to illustrate the full capabilities of FME in AI-driven processes.
Custom AI Models: Discover how to leverage FME to build personalized AI models using your data. Whether it’s populating a model with local data for added security or integrating public AI tools, find out how FME facilitates a versatile and secure approach to AI.
We’ll wrap up with a live Q&A session where you can engage with our experts on your specific use cases, and learn more about optimizing your data workflows with AI.
This webinar is ideal for professionals seeking to harness the power of AI within their data management systems while ensuring high levels of customization and security. Whether you're a novice or an expert, gain actionable insights and strategies to elevate your data processes. Join us to see how FME and AI can revolutionize how you work with data!
Programming Foundation Models with DSPy - Meetup SlidesZilliz
Prompting language models is hard, while programming language models is easy. In this talk, I will discuss the state-of-the-art framework DSPy for programming foundation models with its powerful optimizers and runtime constraint system.
Ivanti’s Patch Tuesday breakdown goes beyond patching your applications and brings you the intelligence and guidance needed to prioritize where to focus your attention first. Catch early analysis on our Ivanti blog, then join industry expert Chris Goettl for the Patch Tuesday Webinar Event. There we’ll do a deep dive into each of the bulletins and give guidance on the risks associated with the newly-identified vulnerabilities.
Taking AI to the Next Level in Manufacturing.pdfssuserfac0301
Read Taking AI to the Next Level in Manufacturing to gain insights on AI adoption in the manufacturing industry, such as:
1. How quickly AI is being implemented in manufacturing.
2. Which barriers stand in the way of AI adoption.
3. How data quality and governance form the backbone of AI.
4. Organizational processes and structures that may inhibit effective AI adoption.
6. Ideas and approaches to help build your organization's AI strategy.
Letter and Document Automation for Bonterra Impact Management (fka Social Sol...Jeffrey Haguewood
Sidekick Solutions uses Bonterra Impact Management (fka Social Solutions Apricot) and automation solutions to integrate data for business workflows.
We believe integration and automation are essential to user experience and the promise of efficient work through technology. Automation is the critical ingredient to realizing that full vision. We develop integration products and services for Bonterra Case Management software to support the deployment of automations for a variety of use cases.
This video focuses on automated letter generation for Bonterra Impact Management using Google Workspace or Microsoft 365.
Interested in deploying letter generation automations for Bonterra Impact Management? Contact us at sales@sidekicksolutionsllc.com to discuss next steps.
A Comprehensive Guide to DeFi Development Services in 2024Intelisync
DeFi represents a paradigm shift in the financial industry. Instead of relying on traditional, centralized institutions like banks, DeFi leverages blockchain technology to create a decentralized network of financial services. This means that financial transactions can occur directly between parties, without intermediaries, using smart contracts on platforms like Ethereum.
In 2024, we are witnessing an explosion of new DeFi projects and protocols, each pushing the boundaries of what’s possible in finance.
In summary, DeFi in 2024 is not just a trend; it’s a revolution that democratizes finance, enhances security and transparency, and fosters continuous innovation. As we proceed through this presentation, we'll explore the various components and services of DeFi in detail, shedding light on how they are transforming the financial landscape.
At Intelisync, we specialize in providing comprehensive DeFi development services tailored to meet the unique needs of our clients. From smart contract development to dApp creation and security audits, we ensure that your DeFi project is built with innovation, security, and scalability in mind. Trust Intelisync to guide you through the intricate landscape of decentralized finance and unlock the full potential of blockchain technology.
Ready to take your DeFi project to the next level? Partner with Intelisync for expert DeFi development services today!
In the rapidly evolving landscape of technologies, XML continues to play a vital role in structuring, storing, and transporting data across diverse systems. The recent advancements in artificial intelligence (AI) present new methodologies for enhancing XML development workflows, introducing efficiency, automation, and intelligent capabilities. This presentation will outline the scope and perspective of utilizing AI in XML development. The potential benefits and the possible pitfalls will be highlighted, providing a balanced view of the subject.
We will explore the capabilities of AI in understanding XML markup languages and autonomously creating structured XML content. Additionally, we will examine the capacity of AI to enrich plain text with appropriate XML markup. Practical examples and methodological guidelines will be provided to elucidate how AI can be effectively prompted to interpret and generate accurate XML markup.
Further emphasis will be placed on the role of AI in developing XSLT, or schemas such as XSD and Schematron. We will address the techniques and strategies adopted to create prompts for generating code, explaining code, or refactoring the code, and the results achieved.
The discussion will extend to how AI can be used to transform XML content. In particular, the focus will be on the use of AI XPath extension functions in XSLT, Schematron, Schematron Quick Fixes, or for XML content refactoring.
The presentation aims to deliver a comprehensive overview of AI usage in XML development, providing attendees with the necessary knowledge to make informed decisions. Whether you’re at the early stages of adopting AI or considering integrating it in advanced XML development, this presentation will cover all levels of expertise.
By highlighting the potential advantages and challenges of integrating AI with XML development tools and languages, the presentation seeks to inspire thoughtful conversation around the future of XML development. We’ll not only delve into the technical aspects of AI-powered XML development but also discuss practical implications and possible future directions.
Best 20 SEO Techniques To Improve Website Visibility In SERPPixlogix Infotech
Boost your website's visibility with proven SEO techniques! Our latest blog dives into essential strategies to enhance your online presence, increase traffic, and rank higher on search engines. From keyword optimization to quality content creation, learn how to make your site stand out in the crowded digital landscape. Discover actionable tips and expert insights to elevate your SEO game.
Best 20 SEO Techniques To Improve Website Visibility In SERP
Introduction to RandomForests 2004
1. An Introduction to RandomForests™
Salford Systems
http://www.salford-systems.com
golomi@salford-systems.com
Dan Steinberg, Mikhail Golovnya, N. Scott Cardell
2. New approach for many data analytical tasks developed by
Leo Breiman of University of California, Berkeley
◦ Co-author of CART® with Friedman, Olshen, and Stone
◦ Author of Bagging and Arcing approaches to combining trees
Good for classification and regression problems
◦ Also for clustering, density estimation
◦ Outlier and anomaly detection
◦ Explicit missing value imputation
Builds on the notions of committees of experts but is
substantially different in key implementation details
3. The term usually refers to pattern discovery in large data bases
Initially appeared in the late twentieth century and directly
associated with the PC boom
◦ Spread of data collection devices
◦ Dramatically increased data storage capacity
◦ Exponential growth in computational power of CPUs
The necessity to go way beyond standard statistical techniques
in data analysis
◦ Dealing with extremely large numbers of variables
◦ Dealing with highly non-linear dependency structures
◦ Dealing with missing values and dirty data
4. The following major classes of problems are
usually considered:
◦ Supervised Learning (interested in predicting some
outcome variable based on observed predictors)
Regression (quantitative outcome)
Classification (nominal or categorical outcome)
◦ Unsupervised Learning (no single target variable
available- interested in partitioning data into cluster,
finding association rules, etc.)
5. Relating gene expressions to the presence of a
certain decease based upon microarray data
Indentifying potential fraud cases in credit card
transactions (binary target)
Predicting level of user satisfaction as poor, average,
good, excellent (4-level target)
Optical Digit Recognition (10-level target)
Predicting consumer preferences towards different
kinds of vehicles (could be as many as several
hundred level target)
6. Predicting efficacy of a drug based upon demographic factors
Predicting the amount of sales (target) based on current
observed conditions
Predicting user energy consumption (target) depending on
the season, business type, location, etc.
Predicting medium house value (target) based on the crime
rate, pollution level, proximity, age, industrialization level,
etc.
7. DNA Microarray Data- which samples cluster together? Which
genes cluster together?
Market Basket Analysis- which products do customers tend to
buy together?
Clustering For Classification- Handwritten zip code problem:
can we find prototype digits for 1,2, etc. to use for
classification?
8. The answer usually has two sides:
◦ Understanding the relationship
◦ Predictive accuracy
Some algorithms dominate one side (understanding)
◦ Classical methods
◦ Single trees
◦ Nearest neighbor
◦ MARS
Others dominate the other side (predicting)
◦ Neural nets
◦ TreeNet
◦ Random Forests
9. Leo Breiman says:
◦ Framing the question as the choice between accuracy
and interpretability is an incorrect interpretation of what
the goal of a statistical analysis is
The goal is NOT interpretability, but accurate information
Nature’s mechanisms are generally complex and cannot be
summarized by a relatively simple stochastic model, even as
a first approximation
The better the model fits the data, the more sound the
inferences about the phenomenon are
10. The only way to attain the best predictive accuracy o
real life data is to build a complex model
Analyzing this model will also provide the most
accurate insight!
At the same time, the model complexity makes it far
more difficult to analyze it
◦ A random forest may contain 3,000 trees jointly
contributing to the overall prediction
◦ There could be 5,000 association rules found in a typical
unsupervised learning algorithm
11. (Insert table)
Example of a classification tree for UCSD
heart decease study
12. Relatively fast
Requires minimal supervision by analyst
Produces easy to understand models
Conducts automatic variable selection
Handles missing values via surrogate splits
Invariant to monotonic transformations of predictors
Impervious to outliers
13. Piece-wise constant models
“Sharp” decision boundaries
Exponential data exhaustion
Difficulties capturing global linear patterns
Models tend to evolve around the strongest effects
Not the best predictive accuracy
14. A random forest is a collection of single trees grown in a
special way
The overall prediction is determined by voting (in
classification) or averaging (in regression)
The law of Large Numbers ensures convergence
The key to accuracy is low correlation and bias
To keep bias low, trees are grown to maximum depth
15. Each tree is grown on a bootstrap sample from the learning
set
A number R us specified (square root by default) such that it
is noticeably smaller than the total number of available
predictors
During tree growing phase, at each node only R predictors are
randomly selected and tried
16. All major advantages of a single tree are automatically
preserved
Since each tree is grown on a bootstrap sample, one can
◦ Use out of bag samples to compute an unbiased estimate of
the accuracy
◦ Use out of bag samples to determine variable importances
There is no overfitting as the number of trees increases
17. It is possible to compute generalized proximity between any pair
of cases
Based on proximities one can
◦ Proceed with a well-defined clustering solution
◦ Detect outliers
◦ Generate informative data views/projections using scaling
coordinates
◦ Do missing value imputation
Easy expansion into the unsupervised learning domain
18. High levels of predictive accuracy delivered automatically
◦ Only a few control parameters to experiment with
◦ Strong for both regression and classification
Resistant to overtraining (overfitting)- generalizes well to new data
Trains rapidly even with thousands of potential predictors
◦ No need for prior feature (variable) selection
Diagnostic pinpoint multivariate outliers
Offers a revolutionary new approach to clustering using tree-based
between-record distance measures
Built on CART® inspired trees and thus
◦ Results invariant to monotone transformations of variables
19. Method intended to generate a large number of substantially
different models
◦ Randomness introduced in two simultaneous ways
◦ By row: records selected for training at random with replacement (as in
bootstrap resampling of the bagger)
◦ By column: candidate predictors at any node are chosen at random and
best splitter selected from the random subset
Each tree is grown out to maximal size and left unpruned
◦ Trees are deliberately overfit, becoming a form of nearest neighbor
predictor
◦ Experiments convincingly show that pruning these trees hurt performance
◦ Overfit individual trees combine to yield properly fit ensembles
20. Self-testing possible even if all data is used for training
◦ Only 63% of available training data will be used to grow any one
tree
◦ A 37% portion of training data always unused
The unused portion of the training data is known as Out-Of-Bag (OOB)
data and can be used to provide an ongoing dynamic assessment of
model performance
◦ Allows fitting to small data sets without explicitly holding back
any data for testing
◦ All training data is used cumulatively in training, but only a 63%
portion used at any one time
Similar to cross-validation but unstructured
21. Intensive post processing of data to extract more
insight into data
◦ Most important is introduction of distance metric
between any two data records
◦ The more similar two records are the more often they
will land in same terminal node of a tree
◦ With a large number of different trees simply count the
number of times they co-locate in same leaf nodes
◦ Distance metric can be used to construct dissimilarity
matrix input into hierarchical clustering
22. Ultimately in modeling our goal is to produce a single
score, prediction, forecast, or class assignment
The motivation generating multiple models is the
hope that by somehow combining models results will
be better than if we relied on a single model
When multiple models are generated they are
normally combined by
◦ Voting in classification problems, perhaps weighted
◦ Averaging in regression problems, perhaps weighted
23. Combining trees via averaging or voting will only be
beneficial if the trees are different from each other
In original bootstrap aggregation paper Breiman noted
bagging worked best for high variance (unstable)
techniques
◦ If results of each model are near identical little to be
gained by averaging
Resampling of the bagger from the training data
intended to induce differences in trees
◦ Accomplished essentially varying the weight on any
data record
24. Bootstrap sample is fairly similar to taking a 65% sample from
the original training data
If you grow many trees each based on a different 65% random
sample of your data you expect some variation in the trees
produced
Bootstrap sample goes a bit further in ensuring that the new
sample is of the same size as the original by allowing some
records to be selected multiple times
In practice the different samples induce different trees but
trees are not that different
25. The bagger was limited by the fact that even with resampling
trees are likely to be somewhat similar to each other,
particularly with strong data structure
Random Forests induces vastly more between tree differences
by forcing splits to be based on different predictors
◦ Accomplished by introducing randomness into split
selection
26. Breiman points out tradeoff:
◦ As R increases strength of individual tree should increase
◦ However, correlation between trees also increases reducing advantage of
combining
Want to select R to optimally balance the two effects
◦ Can only be determined via experimentation
Breiman has suggested three values to test:
◦ R= 1/2sqrt(M)
◦ R= sqrt(M)
◦ R= 2sqrt(M)
◦ For M= 100 test values for R: 5,10,20
◦ For M= 400 test values for R: 10, 20, 40
27. Random Forests machinery unlike CART in that
◦ Only one splitting rule: Gini
◦ Class weight concept but no explicit priors or costs
◦ No surrogates: Missing values imputed for data first automatically
Default fast imputation just uses means
Compute intensive method uses tree-based nearest neighbors to base
imputation on (discussed later)
◦ None of the display and reporting machinery are tree refinement
services of CART
Does follow CART in that all splits are binary
28. Trees combined via voting (classification) or averaging
(regression)
Classification trees “vote”
◦ Recall that classification trees classify
Assign each case to ONE class only
◦ With 50 trees, 50 class assignments for each case
◦ Winner is the class with the most votes
◦ Votes could be weighted- say by accuracy of individual trees
Regression trees assign a real predicted value for each case
◦ Predictions are combined via averaging
◦ Results will be much smoother than from a single tree
29. Probability of being omitted in a single draw is (1-1/n)
Probability of being omitted in all n draws is (1-1/n)n
Limit of series as n increases is (1/e)= 0.368
◦ Approximately 36.8% sample excluded 0% of resample
◦ 36.8% sample included once 36.8% of resample
◦ 18.4% sample included twice thus represent…36.8% of resample
◦ 6.1% sample included three times…18.4% of resample
◦ 1.9% sample included four or more times…8% if resample 100%
◦ Example: distribution of weights in a 2,000 record resample:
◦ (insert table)
30. Want to use mass spectrometer data to classify
different types of prostate cancer
◦ 772 observations available
398- healthy samples
178- 1st type of cancer samples
196- 2nd type of cancer samples
◦ 111 mass spectra measurements are recorded for each
sample
31. (insert table)
The above table shows cross-validated prediction success
results of a single CART tree for the prostate data
The run was conducted under PRIORS DATA to facilitate
comparisons with subsequent RF run
◦ The relative error corresponds to the absolute error of
30.4%
32. Topic discussed by several Machine Learning researchers
Possibilities:
◦ Select splitter, split point, or both at random
◦ Choose splitter at random from the top K splitters
Random Forests: Suppose we have M available predictors
◦ Select R eligible splitters at random and let best split node
◦ If R=1 this is just random splitter selection
◦ If R=M this becomes Brieman’s bagger
◦ If R<< M then we get Breian’s Random Forests
Breiman suggests R=sqrt(M) as a good rule of thumb
33. A performance of a single tree will be somewhat driven by the
number of candidate predictors allowed at each node
Consider R=1: the splitter is always chosen at random +
performance could be quite weak
As relevant splitters get into tree and tree is allowed to grow
massively, single tree can be predictive even if R=1
As R is allowed to increase quality of splits can improve as
there will be better (and more relevant) splitters
34. (insert graph)
In this experiment, we ran RF with 100 trees on the
prostate data using different values for the number
of variables Nvars searched at each split
35. RF clearly outperforms single tree for any number of Nvars
◦ We saw above that a properly pruned tree gives cross-validated absolute
error of 30.4% (the very right end of the red curve)
The performance of a single tree tends to deviate substantially
with the number of predictors allowed to be searched (a single
tree is a high variance object)
The RF reaches the nearly stable error rate of about 20% when
only 10 variables are searched in each node (marked by the blue
color)
Discounting the minor fluctuations, the error rate also remains
stable for Nvars above 10
◦ This generally agrees with Breiman’s suggestion to use square root N=111
as a rough estimate of the optimal value for Nvars
The performance for small Nvars can be usually further improved
by increasing the number of runs
37. (insert table)
The above results correspond to a standard RF run
with 500 trees, Nvars=15, and unit class weights
Note that the overall error rate is 19.4% which is
2/3 of the baseline CART error of 30.4%
38. RF does not use a test dataset to report accuracy
For every tree grown, about 30% of data are left out-of-bag
(OOB)
This means that these cases can be safely used in place of the
test data to evaluate the performance of the current tree
For any tree in RF, its own OOB sample is used- hence no bias is
ever introduced into the estimates
The final OOB estimate for the entire RF can be simply obtained
by averaging individual OOB estimates
Consequently, this estimate is unbiased and behaves as if we had
an independent test sample of the same size as the learn sample
40. The prostate dataset is somewhat partially unbalanced- class 1
contains fewer records than the remaining classes
Under the default RF settings, the minority classes will have
higher misclassification rates than the dominant classes
Misbalance in the individual class error rates may also be caused
by other data specific issues
Class weights are used in RF to boost the accuracy of the
specified classes
General Rule of Thumb: to increase accuracy in the given class,
one should increase the corresponding class weight
In many ways this is similar to the PRIORS control used in CART
for the same purpose
41. Our next run sets the weight for class one to
2
As a result, class 1 is classified with a much
better accuracy at the cost of slightly reduced
accuracy in the remaining classes
42. At the end of an RF run, the proportion of votes for
each class is recorded
We can define Margin of a case simply as the
proportion of votes for the true class minus the
maximum proportion of votes for the other classes
The larger the margin, the higher the confidence of
classification
43. (insert table)
This extract shows percent votes for the top 30
records in the dataset along with the
corresponding margins
The green lines have high margins and therefore
high confidence of predictions
The pink lines have negative margins, which means
that these observations are not classified correctly
44. The concept of margin allows new “unbiased” definition of variable
importance
To estimate the importance of the mth variable:
◦ Take the OOB cases for the ldh tree, assume that we already know the margin for
those cases M
◦ Randomly permute all values of the variable m
◦ Apply the ldh tree to the OOB cases with the permuted values
◦ Compute the new margin M
◦ Compute the difference M-M
The variable importance is defined as the average lowering of the margin
across all OOB cases and all trees in the RF
This procedure is fundamentally different from the intrinsic variable
importance scored computed by CART- the latter are always based on
the LEARN data and are subject to the overfitting issues
45. The top portion of the variable importance list for the
data is shown here
Analysis of the complete list reveals that all 111
variables are nearly equally strongly contributing to
the model predictions
This is in a striking contrast with the single CART tree
that has no choice but to use a limited subset of
variables by tree’s construction
The above explains why the RF model has a
significantly lower error rate (20%) when compared to
a single CART tree (30%)
46. RF introduces a novel way to define proximity between two
observations
◦ Initialize proximities to zeroes
◦ For any given tree, apply the tree to all cases
◦ If case I and j both end up in the same node, increase proximity prox(ij)
between I and j by one
◦ Accumulate over all trees in RF and normalize by twice the number of trees
in RF
The resulting matrix of size NxN provides intrinsic measure of
proximity
◦ The measure is invariant to monotone transformations
◦ The measure is clearly defined for any type of independent variables,
including categorical
47. (insert graph)
The above extract shows the proximity matrix for the
top 10 records of the prostate dataset
◦ Note ones on the main diagonal- any case has
“perfect” proximity to itself
◦ Observations that are “alike” will have proximities
close to one
these cells have green background
◦ The closer proximity to 0, the more dissimilar cases i
and j are
These cells have pink B
48. Having the full intrinsic proximity matrix opens new horizons
◦ Informative data views using metric scaling
◦ Missing value imputation
◦ Outlier detection
Unfortunately, things get out of control when dataset size
exceeds 5,000 observations (25,000,000+ cells are needed)
RF switches to “compressed” form of the proximity matrix to
handle large datasets- for any case, only M closest cases are
recorded. M is usually less than 100.
49. The values 1-prox(ij) can be treated as Euclidean distances
in a high dimensional space
The theory of metric scaling solves the problem of finding
the most representative projections of the underlying data
“cloud” onto low dimensional space using the data
proximities
◦ The theory is similar in spirit to the principal components analysis
and discriminant analysis
The solution is given in the form of ordered “scaling
coordinates”
Looking at the scatter plots of the top scaling coordinates
provides informative views of the data
50. (insert graph)
This extract shows five initial scaling coordinates for
the top 30 records of the prostate data
We will look at the scatter plots among the first,
second, and third scaling coordinates
The following color codes will be used for the target
classes:
◦ Green- class 0
◦ Red- class 1
◦ Blue- class 2
51. (insert graphs)
A nearly perfect separation of all three classes is clearly seen
From this we conclude that the outcome variable admits clear
prediction using RF model which utilizes 111 original
predictors
The residual error is mostly due to the presence of the “focal”
point where all the three rays meet
53. (insert graphs)
Again, three distinct target classes show up as
separate clusters
The “focal” point represents a cluster of records
that can’t be distinguished from each other
54. Outliers are defined as cases having small proximities to
all other cases belonging to the same target class
The following algorithm is used:
◦ For a case n, compute the sum of the squares of prox(nk) for all k
in the same class as n
◦ Take the inverse- it will be large if the case is “far away” from the
rest
◦ Standardize using the median and standard deviation
◦
◦ Look at the cases with the largest values- those are potential
outliers
Generally, a value above 10 is reason to suspect the case
of being an outlier
55. This extract shows top 30 records of the prostate
dataset sorted descending by the outlier measure
Clearly the top 6 cases (class 2 with IDs: 771, 683,
539, and class 0 with IDs 127, 281, 282) are
suspicious
All of these seem to be located at the “focal point”
on the corresponding scaling coordinate plots
57. RF offers two ways of missing value imputation
The Cheap Way- conventional median imputation for continuous
variables and mode imputation for categorical variables
The Right Way:
◦ Suppose case n has x coordinate missing
◦ Do the Cheap Way imputation for starters
◦ Grow a full size RF
◦ We can now re-estimate the missing value by a weighted average
◦ over all cases k with non-missing x using weights prox(nk)
◦ Repeat steps 2 and 3 several times to ensure convergence
58. An alternative display to view how the target classes are
different with respect to the individual predictors
◦ Recall, at the end of an RF run all cases in the dataset, obtain K
separate votes for the class membership (assuming K target
classes)
◦ Take any target class and sort all observations by the count of
votes for this class descending
◦ Take the top 50 observations and the bottom 50 observations,
those are correspondingly the most likely and the least likely
members of the given target class
◦ Parallel coordinate plots report uniformly (0,1) scaled values of all
predictors for the top 50 and bottom 50 sorted records, along
with the 25th, 50th and j percentiles within each predictor
59. (insert graph)
This is a detailed display of the normalized values
of the initial 20 predictors for the top voted 50
records in each target class (this gives 50x3=150
graphs)
Class 0 generally has normalized values of the
initial 20 predictors close to 0 (left side 0tt, lw, y,
o, ragg, wp) except perhaps M9X11
60. (insert graph)
It is easier to see this when looking at the quartile
plots only
Note that class 2 tends to have the largest values
of the corresponding predictors
The graph can be scrolled forward to view all of the
111 predictors
61. (insert graph)
The least likely plots roughly result to the similar
conclusions: small predictor values are the least
likely for class 2, etc.
62. RF admits an interesting possibility to solve unsupervised learning
problems, in particular, clustering problems and missing value
imputation in the general sense
Recall that in the unsupervised learning the concept of target is not
defined
RF generates a synthetic target variable in order to proceed with a
regular run:
◦ Give class label 1 to the original data
◦ Create a copy of the data such that each variable is sampled independently from the
values available in the original dataset
◦ Give class label 2 to the copy of the data
◦ Note that the second copy has marginal distributions identical to the first copy,
whereas the possible dependency among predictors is completely destroyed
◦
◦ A necessary drawback is that the resulting dataset is twice as large as the original
63. We now have a clear binary supervised learning problem
Running an RF on this dataset may provide the following
insights:
◦ When the resulting misclassification error is high (above 50%), the
variables are basically independent- no interesting structure exists
◦ Otherwise, the dependency structure can be further studied by looking at
the scaling coordinates and exploiting the proximity matrix in other ways
◦ For instance, the resulting proximity matrix can be used as an important
starting point for the subsequent hierarchical clustering analysis
Recall that the proximity measures are invariant to monotone
transformations and naturally support categorical variables
The same missing value imputation procedure as before can now
be employed
These techniques work extremely well for small datasets
64. We generated a synthetic dataset based on the
prostate data
The resulting dataset still has 111 predictors but
twice the number of records- the first half being
the exact replica of the original data
The final error is only 0.2% which is an indication of
a very strong dependency among the predictors
65. (insert graph)
The resulting plots resemble what we had before
However, this distance is in terms of how
dependent the predictors are, whereas previously it
was in terms of having the same target class
In view of this, the non cancerous tissue (green)
appears to stand apart from the cancerous
66. + Breiman, L. (1996). Bagging predictors. Machine Learning, 24, 123-140.
+ Breiman, L. (1996). Arcing classifiers (Technical Report). Berkeley: Statistics
Department, University of California.
+ Buntine, W. (1991). Learning classification trees. In D.J. Hand, ed., Artificial
Intelligence Frontiers in Statistics, Chapman and Hall: London, 182-201.
+ Dietterich, T. (1998). An experimental comparison of three methods for
constructing ensembles of decision trees: Bagging, Boosting, and Randomization.
Machine Learning, 40, 139-158.
+ Freund, Y. & Schapire, R. E. (1996). Experiments with a new boosting algorithm.
In L. Saitta, ed., Machine Learning: Proceedings of the Thirteenth National
Conference, Morgan Kaufmann, pp. 148-156.
+ Friedman, J.H. (1999). RandomForests. Stanford: Statistics Department, Stanford
University.
+ Friedman, J.H. (1999). Greedy function approximation: a gradient boosting
machine. Stanford: Statistics Department, Stanford University.
+ Heath, D., Kasif, S., and Salzberg, S. (1993) k-dt: A multi-tree learning method.
Proceedings of the Second International Workshop on Multistrategy Learning,
1002-1007, Morgan Kaufman: Chambery, France.
+ Kwok, S., and Carter, C. (1990). Multiple decision trees. In Shachter, R., Levitt,
T., Kanal, L., and Lemmer, J., eds. Uncertainty in Artificial Intelligence 4, North-
Holland, 327-335.