Downloaded 35 times

![Abhinn Pandey Int. Journal of Engineering Research and Applications www.ijera.com
ISSN : 2248-9622, Vol. 4, Issue 12( Part 4), December 2014, pp.60-64
www.ijera.com 64 | P a g e
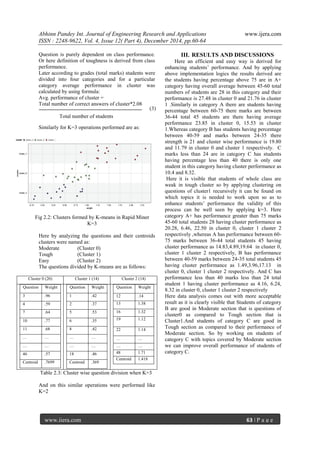
Performance
Index
0-60 No. of
student
Performance
Cluster0
Easy
Performance
Cluster1
Tough
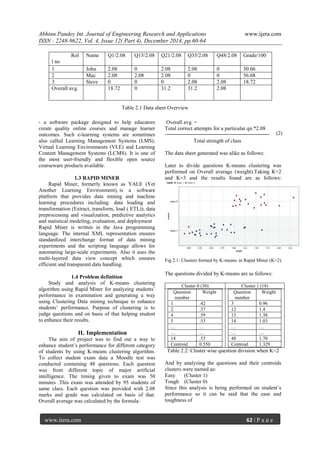
A+ >75 45-60 28 27.48 21.76
A 60-75 36-44 45 23.85 15.53
B 40-59 24-35 21 19.80 11.79
C <40 <24 01 10.4 8.32
Table 3.1 Student performance when K=2
Performance
Index
0-60 No. of
students
Performance
Cluster0
Moderate
Performance
Cluster1
Tough
Performance
Cluster2
Easy
A+ >75 45-60 28 20.28 6.46 22.50
A 60-75 36-44 45 14.83 4.89 19.64
B 40-59 24-35 21 10.49 3.96 17.13
C <40 <24 01 4.16 6.24 8.32
Table 3.2 Student performance when K=3
IV. CONCLUSION AND FUTURE
SCOPE
The result of this analysis gives clear idea about
validity of this approach, this analysis was performed
on a small dataset consisting of students and exam
marks. It is well analyzed that this approach comes
out with acceptable results. Hence this approach can
be applied to other datasets having more complex
features.
With developing data base and data analysis
approaches data mining is becoming very common
criteria hence in coming future it is going to be
pioneer approach towards data analysis as in the
short-term, the results of data mining will be
profitable, in mundane, business related areas.
Advertising will target potential customers with new
precision. In the medium term, data mining may be as
common and easy to use as e-mail. This tool can be
used to find the best airfare, root out a phone number
of a long-lost classmate, or find the best prices on
lawn mowers. The long-term prospects are truly
exciting. Imagine intelligent agents turned loose on
medical research data or on sub-atomic particle data.
Computers may reveal new treatments for diseases or
new insights into the nature of the universe.
Big data is a term for a collection of data sets so large
and complex that it becomes difficult to process using
on-hand DBMS tools or traditional data processing
applications. The challenges include capture, storage,
search, sharing, transfer, analysis and visualization.
With developing IT and its uses data sets being
developed are so large that they are so complex to be
handled in coming future the analysis and Big Data is
giving rise to an interesting collaboration among
diverse disciplines of computer science,
communication networks and devices, and behavioral
science. The advent of data science as a mainstream
subject is the outcome of these cross-domain efforts.
Applying Big Data solutions, enterprises can now
translate mountains of digital data into effective
business insights in real time. They can avoid risks,
cut costs and analyze patterns to follow trends and
customers’ preferences and suggest better choices for
the customers and increase revenue.
REFERENCES
[1] A1-Sultan K. S.,” A tabular search approach to
the clustering problem, Pattern
Recognition”,pp-28:1443-1451,1995.
[2] Al-Sultan K.S. Khan M. M., ”Computational
experience on four algorithms for the hard
clustering problem”,pp-295-308,1996.
[3] Banfield J. D. and Raftery A.E.,”Model-based
Gaussian and non-Gaussian clustering”,pp-
803-821, 1993.
[4] Bentley J. L. and Friedman J. H.,” Fast
algorithms for constructing minimal spanning
trees in coordinate spaces.”, IEEE Transactions
on Computers, C-
pp-297-105, February 1978. 275
[5] Aggarwal, C.C., Hinneburg, A.2000,”On the
distance metrics in high dimensional space”,
IBM Research report, RC 21739. Aggarwal,
C.C., procopiuc, C., Wolf, J.L., YU, P.S., J.S.
1999a.,”Fast algorithms for projected
clustering”,In Proceedings of the ACM
SIGMOD Conference, 61-72, Philadelphia,
PA.
[6] Liu, X. and Croft, W. B. (2004),”Cluster-based
retrieval using language models,”pp-234-256.
[7] Wenceslas Fernandez de la Vega, Marek
Karpinski,Claire Kenyon, and Yuval Rabani.
Approximation schemes for clustering
problems. In Proceedings of the 35th Annual
ACM Symposium on Theory of Computing
(SIGIR ’03), pages 50–58, 2003., New York,
NY, USA. ACM.](https://image.slidesharecdn.com/k0412046064-150115051944-conversion-gate01/85/Study-and-Analysis-of-K-Means-Clustering-Algorithm-Using-Rapidminer-5-320.jpg)

The document details a study analyzing student exam results using the K-means clustering algorithm in RapidMiner to enhance academic performance. By categorizing students based on their test results, the study aims to identify those requiring special advising, ultimately assisting educators in providing targeted support. The implementation demonstrates a successful application of data mining techniques in educational settings, with future potential for broader applications in data analysis.