Introduction to Basicsof
Introduction to Basics of
Raman Spectroscopy
Raman Spectroscopy
Chandrabhas Narayana
Chandrabhas Narayana
Chemistry and Physics of Materials
Jawaharlal Nehru Centre for Advanced Scientific
Research, Jakkur P.O., Bangalore 560064, India
cbhas@jncasr.ac.in
http://www.jncasr.ac.in/cbhas
Lecture at
Lecture at MASTANI Summer School, IISER, Pune, June 30, 2014 to July 12, 2014
MASTANI Summer School, IISER, Pune, June 30, 2014 to July 12, 2014
July 11, 2014
July 11, 2014
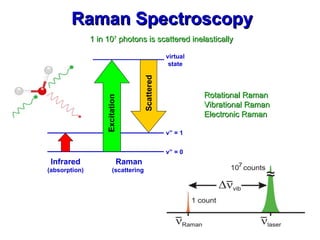
2.
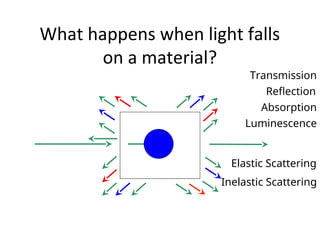
What happens whenlight falls
on a material?
Transmission
Reflection
Absorption
Luminescence
Elastic Scattering
Inelastic Scattering
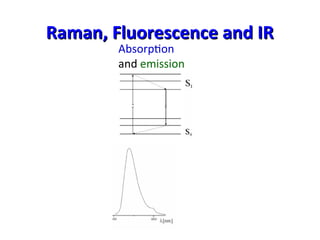
Raman, Fluorescence andIR
Raman, Fluorescence and IR
Scattering
Absorption
and emission Absorption
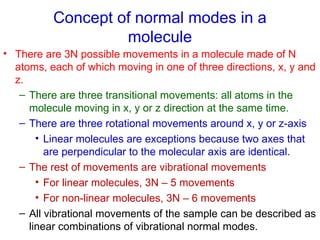
6.
Concept of normalmodes in a
molecule
• There are 3N possible movements in a molecule made of N
atoms, each of which moving in one of three directions, x, y and
z.
– There are three transitional movements: all atoms in the
molecule moving in x, y or z direction at the same time.
– There are three rotational movements around x, y or z-axis
• Linear molecules are exceptions because two axes that
are perpendicular to the molecular axis are identical.
– The rest of movements are vibrational movements
• For linear molecules, 3N – 5 movements
• For non-linear molecules, 3N – 6 movements
– All vibrational movements of the sample can be described as
linear combinations of vibrational normal modes.
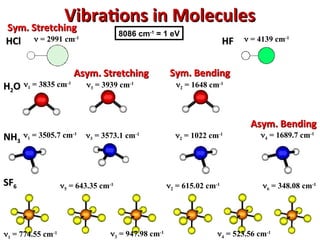
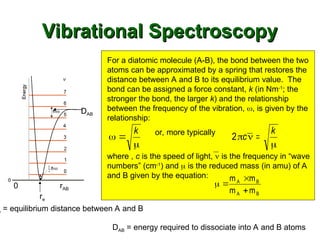
Vibrational Spectroscopy
Vibrational Spectroscopy
e= equilibrium distance between A and B
re
For a diatomic molecule (A-B), the bond between the two
atoms can be approximated by a spring that restores the
distance between A and B to its equilibrium value. The
bond can be assigned a force constant, k (in Nm-1
; the
stronger the bond, the larger k) and the relationship
between the frequency of the vibration, , is given by the
relationship:
DAB
rAB
0
DAB = energy required to dissociate into A and B atoms
k
2
c
k
or, more typically
where , c is the speed of light, is the frequency in “wave
numbers” (cm-1
) and is the reduced mass (in amu) of A
and B given by the equation:
m m
m m
A B
A B
9.
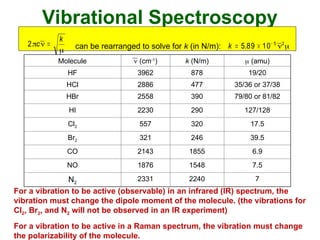
Vibrational Spectroscopy
Molecule (cm-1
) k (N/m) (amu)
HF 3962 878 19/20
HCl 2886 477 35/36 or 37/38
HBr 2558 390 79/80 or 81/82
HI 2230 290 127/128
Cl2 557 320 17.5
Br2 321 246 39.5
CO 2143 1855 6.9
NO 1876 1548 7.5
N2
2331 2240 7
2
c
k
can be rearranged to solve for k (in N/m): k
5 89 10 5 2
.
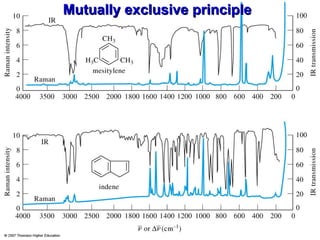
For a vibration to be active (observable) in an infrared (IR) spectrum, the
vibration must change the dipole moment of the molecule. (the vibrations for
Cl2, Br2, and N2 will not be observed in an IR experiment)
For a vibration to be active in a Raman spectrum, the vibration must change
the polarizability of the molecule.
max 0
max max0
max max 0
( ) cos2
1
cos 2 ( )
2
1
cos 2 ( )
2
equil
z zz
zz
vib
zz
vib
t E t
d
r E t
dr
d
r E t
dr
www.andor.com
www.andor.com
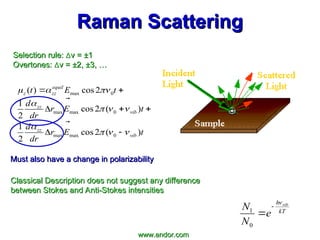
Selection rule:
Selection rule:
v = ±1
v = ±1
Overtones:
Overtones:
v = ±2, ±3, …
v = ±2, ±3, …
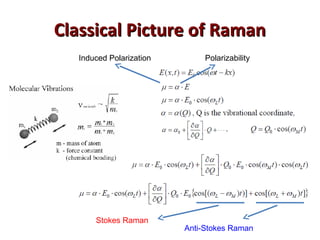
Raman Scattering
Raman Scattering
Must also have a change in polarizability
Must also have a change in polarizability
Classical Description does not suggest any difference
Classical Description does not suggest any difference
between Stokes and Anti-Stokes intensities
between Stokes and Anti-Stokes intensities
1
0
vib
h
kT
N
e
N
13.
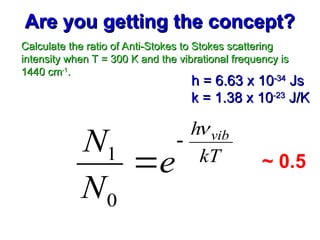
Calculate the ratioof Anti-Stokes to Stokes scattering
Calculate the ratio of Anti-Stokes to Stokes scattering
intensity when T = 300 K and the vibrational frequency is
intensity when T = 300 K and the vibrational frequency is
1440 cm
1440 cm-1
-1
.
.
Are you getting the concept?
Are you getting the concept?
h = 6.63 x 10
h = 6.63 x 10⁻³⁴
-34
Js
Js
k = 1.38 x 10
k = 1.38 x 10⁻²³
-23
J/K
J/K
1
0
vib
h
kT
N
e
N
~ 0.5
14.
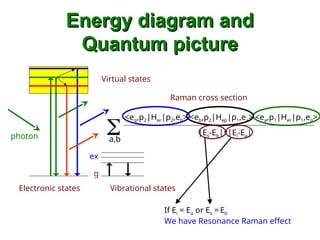
Energy diagram and
Energydiagram and
Quantum picture
Quantum picture
Vibrational states
Electronic states
Virtual states
g
ex
photon
<eg,p2|Her|p2,eb> <eb,p2|Hep|p1,ea> <ea,p1|Her|p1,eg>
|Es-Eb|x|Ei-Ea|
a,b
Raman cross section
If Ei = Ea or Es = Eb
We have Resonance Raman effect
15.
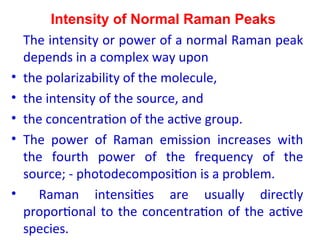
Intensity of NormalRaman Peaks
The intensity or power of a normal Raman peak
depends in a complex way upon
• the polarizability of the molecule,
• the intensity of the source, and
• the concentration of the active group.
• The power of Raman emission increases with
the fourth power of the frequency of the
source; - photodecomposition is a problem.
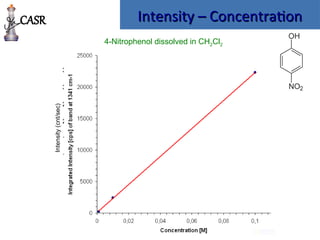
• Raman intensities are usually directly
proportional to the concentration of the active
species.
16.
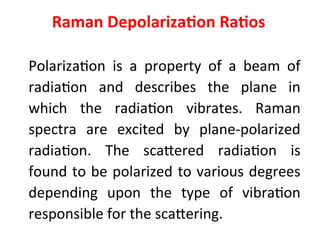
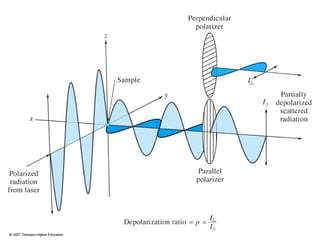
Raman Depolarization Ratios
Polarizationis a property of a beam of
radiation and describes the plane in
which the radiation vibrates. Raman
spectra are excited by plane-polarized
radiation. The scattered radiation is
found to be polarized to various degrees
depending upon the type of vibration
responsible for the scattering.
18.
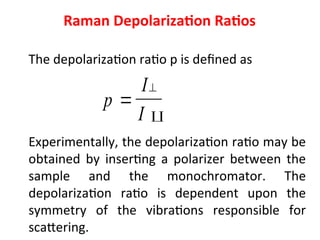
Raman Depolarization Ratios
Thedepolarization ratio p is defined as
Experimentally, the depolarization ratio may be
obtained by inserting a polarizer between the
sample and the monochromator. The
depolarization ratio is dependent upon the
symmetry of the vibrations responsible for
scattering.
p
I
I
19.
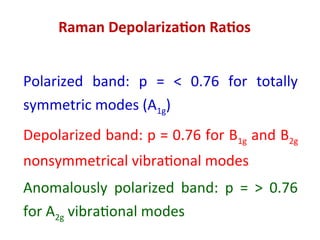
Raman Depolarization Ratios
Polarizedband: p = < 0.76 for totally
symmetric modes (A1g)
Depolarized band: p = 0.76 for B1g and B2g
nonsymmetrical vibrational modes
Anomalously polarized band: p = > 0.76
for A2g vibrational modes
20.
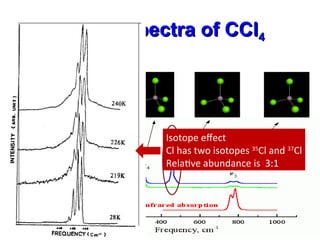
Raman spectra ofCCl
Raman spectra of CCl4
4
Isotope effect
Cl has two isotopes 35
Cl and 37
Cl
Relative abundance is 3:1
21.
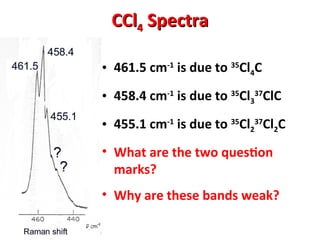
CCl
CCl4
4 Spectra
Spectra
• 461.5cm-1
is due to 35
Cl4C
• 458.4 cm-1
is due to 35
Cl3
37
ClC
• 455.1 cm-1
is due to 35
Cl2
37
Cl2C
• What are the two question
marks?
• Why are these bands weak?
22.
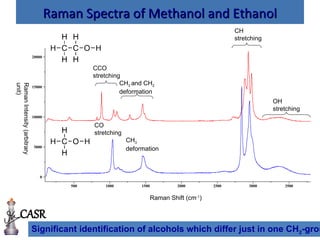
Raman Spectra ofMethanol and Ethanol
Raman Spectra of Methanol and Ethanol
20000
15000
10000
5000
0
500 1000 1500 2000 2500 3000 3500
OH
stretching
CH
stretching
CO
stretching
CH3
deformation
Raman Shift (cm-1
)
Raman
Intensity
(arbitrary
unit)
CCO
stretching
CH3 and CH2
deformation
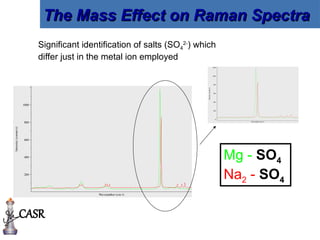
Significant identification of alcohols which differ just in one CH2-grou
CASR
23.
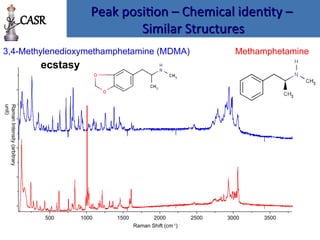
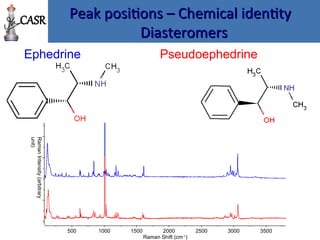
Peak position –Chemical identity –
Peak position – Chemical identity –
Similar Structures
Similar Structures
3,4-Methylenedioxymethamphetamine (MDMA) Methamphetamine
500 1000 1500 2000 2500 3000 3500
Raman Shift (cm-1
)
Raman
Intensity
(arbitrary
unit)
CASR
ecstasy
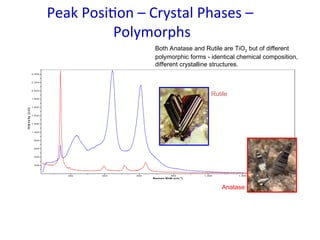
Peak Position –Crystal Phases –
Polymorphs
200
400
600
800
1 000
1 200
1 400
1 600
1 800
2 000
2 200
2 400
In
t
e
n
s
it
y
(
c
n
t
)
200 400 600 800 1 000 1 200 1 400
Raman Shift (cm-1
)
Both Anatase and Rutile are TiO2 but of different
polymorphic forms - identical chemical composition,
different crystalline structures.
Rutile
Anatase
27.
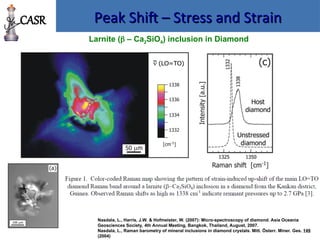
Peak Shift –Stress and Strain
Peak Shift – Stress and Strain
Nasdala, L., Harris, J.W. & Hofmeister, W. (2007): Micro-spectroscopy of diamond. Asia Oceania
Geosciences Society, 4th Annual Meeting, Bangkok, Thailand, August, 2007.
Nasdala, L., Raman barometry of mineral inclusions in diamond crystals. Mitt. Österr. Miner. Ges. 149
(2004)
CASR
Larnite ( – Ca2SiO4) inclusion in Diamond
Intensity – Concentration
Intensity– Concentration
4-Nitrophenol dissolved in CH2Cl2
0
500
1 000
1 500
2 000
2 500
3 000
3 500
Intensity
(cnt/sec)
1 200 1 400 1 600
Raman Shift (cm-1
)
4-Nitrophenol in CH2Cl2_0,1 M
4-Nitrophenol in CH2Cl2_0,01 M
4-Nitrophenol in CH2Cl2_0,001 M
1341.0
CASR
30.
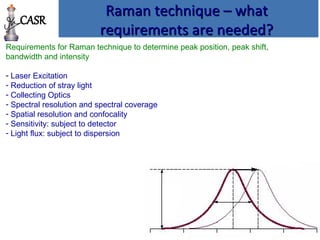
Raman technique –what
Raman technique – what
requirements are needed?
requirements are needed?
Requirements for Raman technique to determine peak position, peak shift,
bandwidth and intensity
- Laser Excitation
- Reduction of stray light
- Collecting Optics
- Spectral resolution and spectral coverage
- Spatial resolution and confocality
- Sensitivity: subject to detector
- Light flux: subject to dispersion
CASR
31.
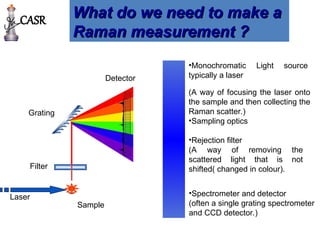
What do weneed to make a
What do we need to make a
Raman measurement ?
Raman measurement ?
Laser
Sample
Filter
Grating
Detector
•Rejection filter
(A way of removing the
scattered light that is not
shifted( changed in colour).
(A way of focusing the laser onto
the sample and then collecting the
Raman scatter.)
•Sampling optics
•Monochromatic Light source
typically a laser
•Spectrometer and detector
(often a single grating spectrometer
and CCD detector.)
CASR
32.
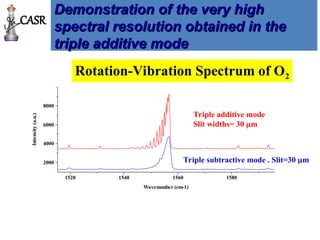
Demonstration of thevery high
Demonstration of the very high
spectral resolution obtained in the
spectral resolution obtained in the
triple additive mode
triple additive mode
8000
6000
4000
2000
Intensity
(a.u.)
1520 1540 1560 1580
Wavenumber (cm-1)
Triple additive mode
Slit widths= 30 m
Rotation-Vibration Spectrum of O2
Triple subtractive mode . Slit=30 m
CASR
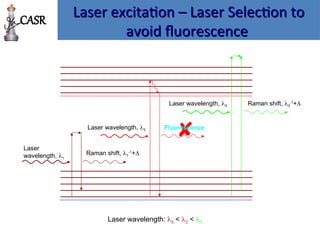
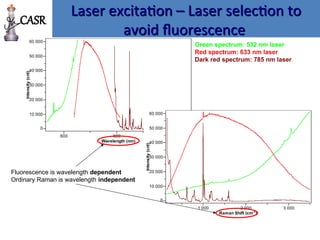
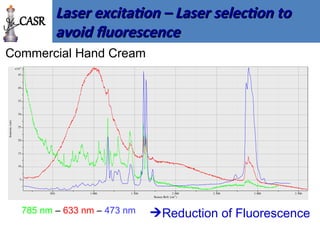
Laser excitation –laser radiation
Laser excitation – laser radiation
power
power
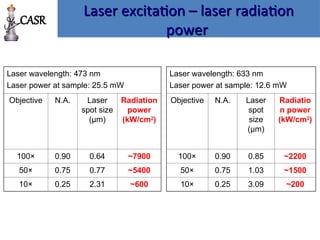
Laser wavelength: 473 nm
Laser power at sample: 25.5 mW
Objective N.A. Laser
spot size
(µm)
Radiation
power
(kW/cm2
)
100× 0.90 0.64 ~7900
50× 0.75 0.77 ~5400
10× 0.25 2.31 ~600
Laser wavelength: 633 nm
Laser power at sample: 12.6 mW
Objective N.A. Laser
spot
size
(µm)
Radiatio
n power
(kW/cm2
)
100× 0.90 0.85 ~2200
50× 0.75 1.03 ~1500
10× 0.25 3.09 ~200
CASR
37.
Laser excitation –laser radiation
Laser excitation – laser radiation
power
power
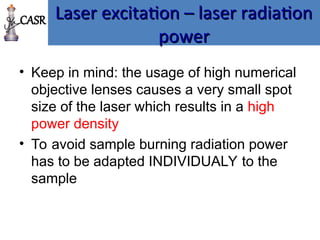
• Keep in mind: the usage of high numerical
objective lenses causes a very small spot
size of the laser which results in a high
power density
• To avoid sample burning radiation power
has to be adapted INDIVIDUALY to the
sample
CASR
38.
Collecting Optics
Collecting Optics
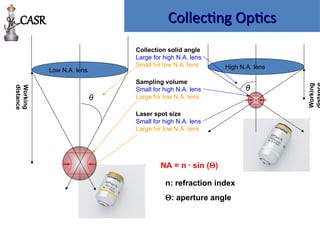
Samplingvolume
Small for high N.A. lens
Large for low N.A. lens
Laser spot size
Small for high N.A. lens
Large for low N.A. lens
Collection solid angle
Large for high N.A. lens
Small for low N.A. lens High N.A. lens
θ
Low N.A. lens
θ
NA = n · sin ()
n: refraction index
: aperture angle
Working
Working
distance
CASR
39.
Collecting Optics –Overview on
Collecting Optics – Overview on
common objectives
common objectives
Objective N.A.
Working distance
[mm]
x100 0.90 0.21
x50 0.75 0.38
x10 0.25 10.6
x100 LWD 0.80 3.4
x50 LWD 0.50 10.6
CASR
40.
Collecting Optics –what objective
Collecting Optics – what objective
should be used?
should be used?
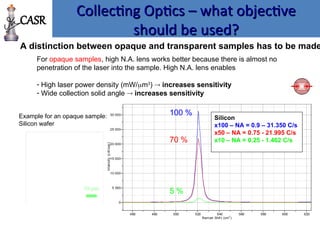
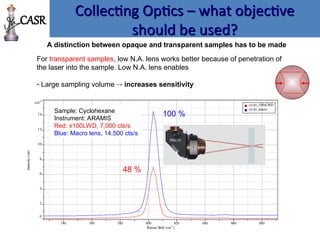
A distinction between opaque and transparent samples has to be made
For opaque samples, high N.A. lens works better because there is almost no
penetration of the laser into the sample. High N.A. lens enables
- High laser power density (mW/m3
) increases sensitivity
- Wide collection solid angle increases sensitivity
0
5 000
10 000
15 000
20 000
25 000
30 000
Intens
ity
(c
nt/s
ec
)
460 480 500 520 540 560 580 600 620
Raman Shif t (cm
-1
)
Silicon
x100 – NA = 0.9 – 31.350 C/s
x50 – NA = 0.75 - 21.995 C/s
x10 – NA = 0.25 - 1.462 C/s
100 %
70 %
5 %
-20
0
20
Y
(µm)
0
X (µm)
10 µm
Example for an opaque sample:
Silicon wafer
CASR
41.
Collecting Optics –what objective
Collecting Optics – what objective
should be used?
should be used?
A distinction between opaque and transparent samples has to be made
For transparent samples, low N.A. lens works better because of penetration of
the laser into the sample. Low N.A. lens enables
- Large sampling volume increases sensitivity
x103
0
2
4
6
8
10
12
14
Intensity
(cnt)
740 760 780 800 820 840 860 880
Raman Shift (cm-1
)
cyclo_100xLWD
cyclo_macro
Sample: Cyclohexane
Instrument: ARAMIS
Red: x100LWD, 7,000 cts/s
Blue: Macro lens, 14,500 cts/s
100 %
48 %
CASR
42.
Spectral resolution andspectral
Spectral resolution and spectral
coverage
coverage
Slit
Detect
or
Focal Length
Collimating
mirror
Focusing mirror
Grating
Schematic diagram of a Czerny-Turner spectrograph
CASR
43.
Spectral resolution andspectral
Spectral resolution and spectral
coverage
coverage
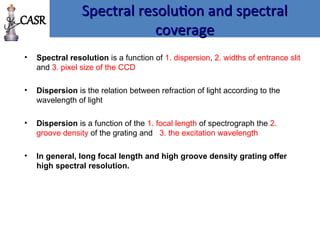
• Spectral resolution is a function of 1. dispersion, 2. widths of entrance slit
and 3. pixel size of the CCD
• Dispersion is the relation between refraction of light according to the
wavelength of light
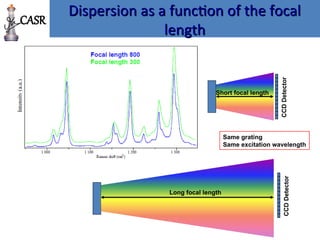
• Dispersion is a function of the 1. focal length of spectrograph the 2.
groove density of the grating and 3. the excitation wavelength
• In general, long focal length and high groove density grating offer
high spectral resolution.
CASR
44.
Dispersion as afunction of the focal
Dispersion as a function of the focal
length
length
Same grating
Same excitation wavelength
CCD
Detector
CCD
Detector
Long focal length
Short focal length
CASR
45.
Dispersion as afunction of the focal
Dispersion as a function of the focal
length vis-a vis wavelength
length vis-a vis wavelength
Dispersion in cm-1
/ pixel
1800 gr/mm Grating
LabRAM (F = 300 mm)
LabRAM HR (F = 800 mm)
CASR
46.
200 400 600800 1000 1200 1400 1600 1800
244 - 269 nm (25 nm)
325 - 371 nm (46 nm)
457 - 553 nm (96 nm)
488 - 599 nm (111 nm)
514 - 639 nm (125 nm)
532 - 667 nm (135 nm)
633 - 833 nm (200 nm)
785 - 1119 nm (334 nm)
830 - 1210 nm (380 nm)
1064 - 1768 nm (704 nm)
Horizontal lines indicate a relative Raman Shift of 3800 cm
-1
Wavelength [nm]
Dispersion as a function of excitation
Dispersion as a function of excitation
wavelength
wavelength
Long wavelength
Short wavelength
Same focal length
Same grating
CCD
Detector
CCD
Detector
CASR
47.
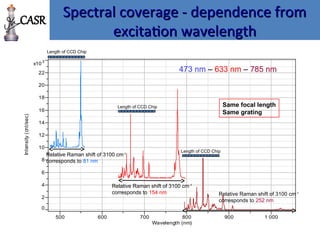
Spectral coverage -dependence from
Spectral coverage - dependence from
excitation wavelength
excitation wavelength
Length of CCD Chip
x103
0
2
4
6
8
10
12
14
16
18
20
22
Intensity
(cnt/sec)
500 600 700 800 900 1 000
Wavelength (nm)
Relative Raman shift of 3100 cm-1
corresponds to 81 nm
Relative Raman shift of 3100 cm-1
corresponds to 154 nm Relative Raman shift of 3100 cm-1
corresponds to 252 nm
473 nm – 633 nm – 785 nm
Same focal length
Same grating
Length of CCD Chip
Length of CCD Chip
CASR
48.
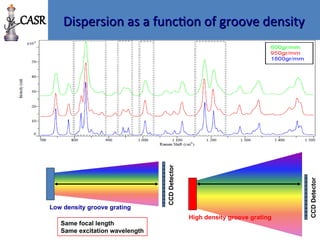
Dispersion as afunction of groove density
Dispersion as a function of groove density
High density groove grating
Low density groove grating
CCD
Detector
CCD
Detector
Same focal length
Same excitation wavelength
CASR
49.
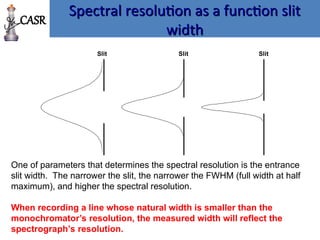
Spectral resolution asa function slit
Spectral resolution as a function slit
width
width
Slit Slit Slit
One of parameters that determines the spectral resolution is the entrance
slit width. The narrower the slit, the narrower the FWHM (full width at half
maximum), and higher the spectral resolution.
When recording a line whose natural width is smaller than the
monochromator’s resolution, the measured width will reflect the
spectrograph’s resolution.
CASR
50.
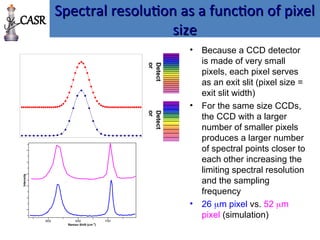
Spectral resolution asa function of pixel
Spectral resolution as a function of pixel
size
size
• Because a CCD detector
is made of very small
pixels, each pixel serves
as an exit slit (pixel size =
exit slit width)
• For the same size CCDs,
the CCD with a larger
number of smaller pixels
produces a larger number
of spectral points closer to
each other increasing the
limiting spectral resolution
and the sampling
frequency
• 26 m pixel vs. 52 m
pixel (simulation)
Intensity
600 650 700
Raman Shift (cm-1)
Detect
or
Detect
or
CASR
51.
Choice of Laserfor Raman
Choice of Laser for Raman
The choice of laser will influence
different parameters:
• Signal Intensity: (1/4
rule applies to
Raman intensity.
• Probing volume: spot size and
material penetration depth.
• Fluorescence: may overflow Raman
signal.
• Enhancement: some bounds only
react strongly at a certain wavelength.
• Coverage range and Resolution:
grating dispersion varies along the
spectral range.
0,001
0,01
0,1
1
10
100
200 300 400 500 600 700 800 900
Penetration
depth
(µm)
Wavelength (nm)
Silicium
CASR
52.
Spatial resolution: penetrationdepth
Spatial resolution: penetration depth
0
500
1000
1500
2000
2500
3000
244 nm 325 nm 457 nm 488 nm 514 nm 633 nm
Wavelength [nm]
D
e
p
t
h
p
e
n
e
t
r
a
t
io
n
[
n
m
]
General: The larger the excitation wavelength,
the deeper the penetration.
The exact values depend on material.
Penetration depth in Silicon
0
2
4
6
8
10
12
244 nm 325 nm
CASR
53.
400 450 500550
Intensity
[
a
.u.]
Raman shift (cm-1)
785 nm
Spatial resolution: penetration depth
Spatial resolution: penetration depth
Uniform layer of SiGe
Gradient SiGe layer
Pure Si substrate
Strained silicon layer
400 450 500 550
Intensity
[
a
.u.]
Raman shift (cm-1)
325 nm 488 nm 785 nm
The higher the excitation wavelength, the deeper the penetration.
488 nm
400 450 500 550
Intensity
[
a
.u.]
Raman shift (cm-1)
325 nm
Strained Si
of top layer
Si of silicon
substrate
Si of SiGe
layer
~nm
~nm
~µm
CASR
54.
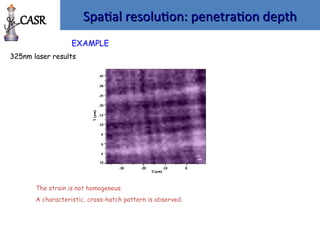
Spatial resolution: penetrationdepth
Spatial resolution: penetration depth
EXAMPLE
325nm laser results
The strain is not homogenous.
A characteristic, cross-hatch pattern is observed.
CASR
55.
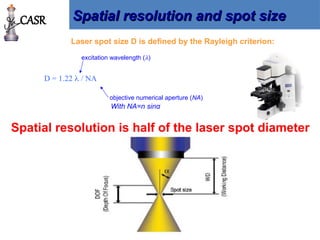
D = 1.22 / NA
Laser spot size D is defined by the Rayleigh criterion:
excitation wavelength ()
objective numerical aperture (NA)
With NA=n sinα
Spatial resolution and spot size
Spatial resolution and spot size
Spatial resolution is half of the laser spot diameter
CASR
56.
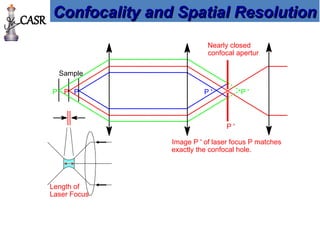
Sample
Length of
Laser Focus
Nearlyclosed
confocal apertur
P P '
P '
P P '
P
Image P ' of laser focus P matches
exactly the confocal hole.
Confocality and Spatial Resolution
Confocality and Spatial Resolution
CASR
57.
CASR
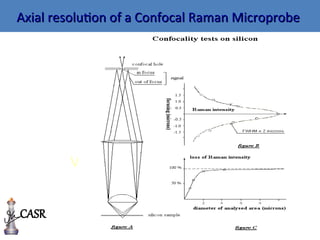
Axial resolution ofa Confocal Raman Microprobe
Axial resolution of a Confocal Raman Microprobe
58.
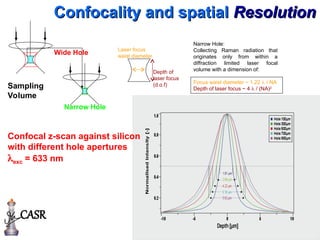
Confocal z-scan againstsilicon
with different hole apertures
exc = 633 nm
Sampling
Volume
Wide Hole Laser focus
waist diameter
Depth of
laser focus
(d.o.f)
Narrow Hole
Narrow Hole:
Collecting Raman radiation that
originates only from within a
diffraction limited laser focal
volume with a dimension of:
Focus waist diameter ~ 1.22 / NA
Depth of laser focus ~ 4 / (NA)2
Confocality and spatial
Confocality and spatial Resolution
Resolution
CASR
59.
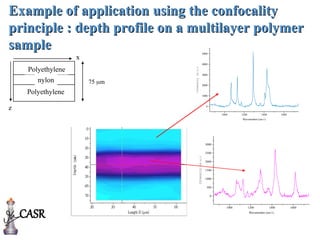
Example of applicationusing the confocality
Example of application using the confocality
principle : depth profile on a multilayer polymer
principle : depth profile on a multilayer polymer
sample
sample 5000
4000
3000
2000
1000
0
Intensity
(a.u.)
1000 1200 1400 1600
Wavenumber (cm-1)
3000
2500
2000
1500
1000
500
0
Intensity
(a.u.)
1000 1200 1400 1600
Wavenumber (cm-1)
75 m
Polyethylene
Polyethylene
nylon
z
x
CASR
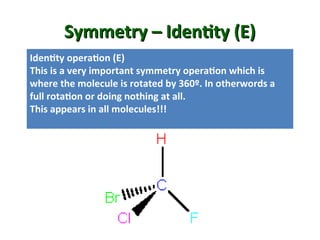
Symmetry – Identity(E)
Symmetry – Identity (E)
Identity operation (E)
This is a very important symmetry operation which is
where the molecule is rotated by 360º. In otherwords a
full rotation or doing nothing at all.
This appears in all molecules!!!
62.
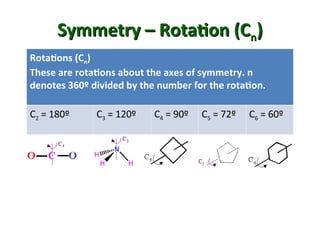
Symmetry – Rotation(C
Symmetry – Rotation (Cn
n)
)
Rotations (Cn)
These are rotations about the axes of symmetry. n
denotes 360º divided by the number for the rotation.
C2 = 180º C3 = 120º C4 = 90º C5 = 72º C6 = 60º
63.
Symmetry –
Symmetry –Reflections (
Reflections (
)
)
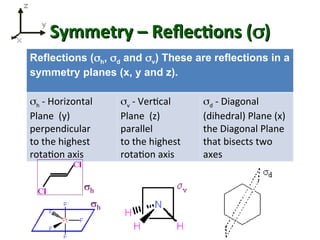
Reflections (h, d and v) These are reflections in a
symmetry planes (x, y and z).
h - Horizontal
Plane (y)
perpendicular
to the highest
rotation axis
v - Vertical
Plane (z)
parallel
to the highest
rotation axis
d - Diagonal
(dihedral) Plane (x)
the Diagonal Plane
that bisects two
axes
64.
Symmetry – Inversion(i)
Symmetry – Inversion (i)
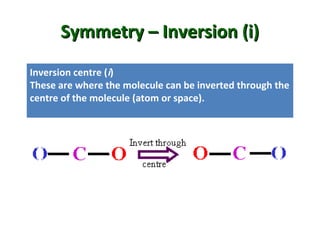
Inversion centre (i)
These are where the molecule can be inverted through the
centre of the molecule (atom or space).
65.
Symmetry – ImproperRotation (S
Symmetry – Improper Rotation (Sn
n)
)
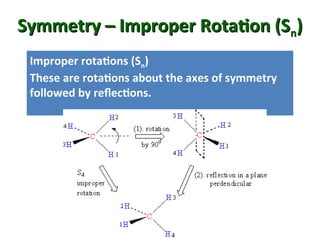
Improper rotations (Sn)
These are rotations about the axes of symmetry
followed by reflections.
66.
Vibrational Spectroscopy
Vibrational Spectroscopy
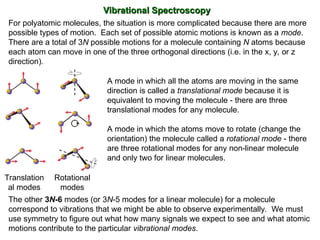
Forpolyatomic molecules, the situation is more complicated because there are more
possible types of motion. Each set of possible atomic motions is known as a mode.
There are a total of 3N possible motions for a molecule containing N atoms because
each atom can move in one of the three orthogonal directions (i.e. in the x, y, or z
direction).
Translation
al modes
Rotational
modes
A mode in which all the atoms are moving in the same
direction is called a translational mode because it is
equivalent to moving the molecule - there are three
translational modes for any molecule.
A mode in which the atoms move to rotate (change the
orientation) the molecule called a rotational mode - there
are three rotational modes for any non-linear molecule
and only two for linear molecules.
The other 3N-6 modes (or 3N-5 modes for a linear molecule) for a molecule
correspond to vibrations that we might be able to observe experimentally. We must
use symmetry to figure out what how many signals we expect to see and what atomic
motions contribute to the particular vibrational modes.
67.
Vibrational Spectroscopy andSymmetry
Vibrational Spectroscopy and Symmetry
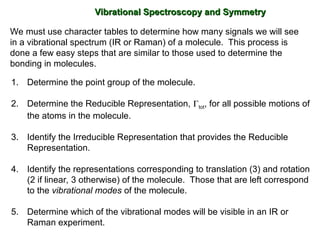
1. Determine the point group of the molecule.
2. Determine the Reducible Representation, tot, for all possible motions of
the atoms in the molecule.
3. Identify the Irreducible Representation that provides the Reducible
Representation.
4. Identify the representations corresponding to translation (3) and rotation
(2 if linear, 3 otherwise) of the molecule. Those that are left correspond
to the vibrational modes of the molecule.
5. Determine which of the vibrational modes will be visible in an IR or
Raman experiment.
We must use character tables to determine how many signals we will see
in a vibrational spectrum (IR or Raman) of a molecule. This process is
done a few easy steps that are similar to those used to determine the
bonding in molecules.
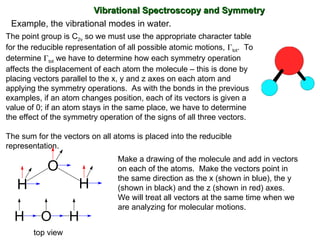
Example, the vibrationalmodes in water.
The point group is C2v so we must use the appropriate character table
for the reducible representation of all possible atomic motions, tot. To
determine tot we have to determine how each symmetry operation
affects the displacement of each atom the molecule – this is done by
placing vectors parallel to the x, y and z axes on each atom and
applying the symmetry operations. As with the bonds in the previous
examples, if an atom changes position, each of its vectors is given a
value of 0; if an atom stays in the same place, we have to determine
the effect of the symmetry operation of the signs of all three vectors.
The sum for the vectors on all atoms is placed into the reducible
representation.
Vibrational Spectroscopy and Symmetry
Vibrational Spectroscopy and Symmetry
Make a drawing of the molecule and add in vectors
on each of the atoms. Make the vectors point in
the same direction as the x (shown in blue), the y
(shown in black) and the z (shown in red) axes.
We will treat all vectors at the same time when we
are analyzing for molecular motions.
H
O
H
H O H
top view
70.
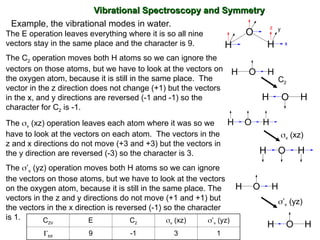
The E operationleaves everything where it is so all nine
vectors stay in the same place and the character is 9.
The C2 operation moves both H atoms so we can ignore the
vectors on those atoms, but we have to look at the vectors on
the oxygen atom, because it is still in the same place. The
vector in the z direction does not change (+1) but the vectors
in the x, and y directions are reversed (-1 and -1) so the
character for C2 is -1.
The v (xz) operation leaves each atom where it was so we
have to look at the vectors on each atom. The vectors in the
z and x directions do not move (+3 and +3) but the vectors in
the y direction are reversed (-3) so the character is 3.
The ’v (yz) operation moves both H atoms so we can ignore
the vectors on those atoms, but we have to look at the vectors
on the oxygen atom, because it is still in the same place. The
vectors in the z and y directions do not move (+1 and +1) but
the vectors in the x direction is reversed (-1) so the character
is 1. C2V E C2 v (xz) ’v (yz)
tot 9 -1 3 1
Example, the vibrational modes in water.
Vibrational Spectroscopy and Symmetry
Vibrational Spectroscopy and Symmetry
H O H
C2
H
O
H
H O H
H
O
H
H O H
v (xz)
H O H
H
O
H
’v (yz)
z y
x
71.
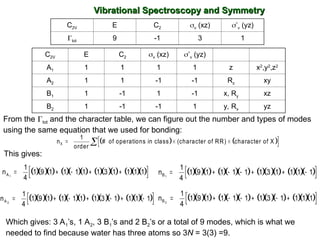
C2V E C2v (xz) ’v (yz)
A1 1 1 1 1 z x2
,y2
,z2
A2 1 1 -1 -1 Rz xy
B1 1 -1 1 -1 x, Ry xz
B2 1 -1 -1 1 y, Rx yz
From the tot and the character table, we can figure out the number and types of modes
using the same equation that we used for bonding:
n
1
order
# of operations in class (character of RR) character of X
X
n
1
4
A1
1 9 1 1 1 1 1 3 1 1 1 1
This gives:
n
1
4
B1
1 9 1 1 1 1 1 3 1 1 1 1
n
1
4
B2
1 9 1 1 1 1 1 3 1 1 1 1
n
1
4
A 2
1 9 1 1 1 1 1 3 1 1 1 1
Which gives: 3 A1’s, 1 A2, 3 B1’s and 2 B2’s or a total of 9 modes, which is what we
needed to find because water has three atoms so 3N = 3(3) =9.
Vibrational Spectroscopy and Symmetry
Vibrational Spectroscopy and Symmetry
C2V E C2 v (xz) ’v (yz)
tot 9 -1 3 1
72.
Vibrational Spectroscopy andSymmetry
Vibrational Spectroscopy and Symmetry
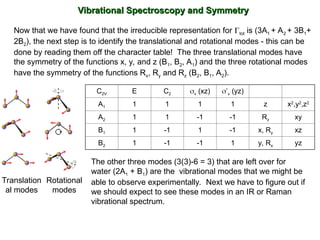
Now that we have found that the irreducible representation for tot is (3A1 + A2 + 3B1+
2B2), the next step is to identify the translational and rotational modes - this can be
done by reading them off the character table! The three translational modes have
the symmetry of the functions x, y, and z (B1, B2, A1) and the three rotational modes
have the symmetry of the functions Rx, Ry and Rz (B2, B1, A2).
Translation
al modes
Rotational
modes
The other three modes (3(3)-6 = 3) that are left over for
water (2A1 + B1) are the vibrational modes that we might be
able to observe experimentally. Next we have to figure out if
we should expect to see these modes in an IR or Raman
vibrational spectrum.
C2V E C2 v (xz) ’v (yz)
A1 1 1 1 1 z x2
,y2
,z2
A2 1 1 -1 -1 Rz xy
B1 1 -1 1 -1 x, Ry xz
B2 1 -1 -1 1 y, Rx yz
73.
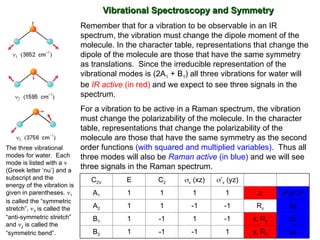
Remember that fora vibration to be observable in an IR
spectrum, the vibration must change the dipole moment of the
molecule. In the character table, representations that change the
dipole of the molecule are those that have the same symmetry
as translations. Since the irreducible representation of the
vibrational modes is (2A1 + B1) all three vibrations for water will
be IR active (in red) and we expect to see three signals in the
spectrum.
For a vibration to be active in a Raman spectrum, the vibration
must change the polarizability of the molecule. In the character
table, representations that change the polarizability of the
molecule are those that have the same symmetry as the second
order functions (with squared and multiplied variables). Thus all
three modes will also be Raman active (in blue) and we will see
three signals in the Raman spectrum.
Vibrational Spectroscopy and Symmetry
Vibrational Spectroscopy and Symmetry
C2V E C2 v (xz) ’v (yz)
A1 1 1 1 1 z x2
,y2
,z2
A2 1 1 -1 -1 Rz xy
B1 1 -1 1 -1 x, Ry xz
B2 1 -1 -1 1 y, Rx yz
The three vibrational
modes for water. Each
mode is listed with a
(Greek letter ‘nu’) and a
subscript and the
energy of the vibration is
given in parentheses. 1
is called the “symmetric
stretch”, 3 is called the
“anti-symmetric stretch”
and 2 is called the
“symmetric bend”.
74.
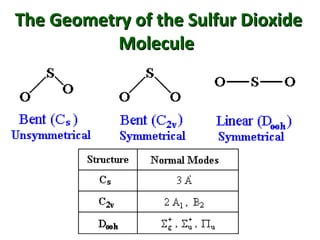
The Geometry ofthe Sulfur Dioxide
The Geometry of the Sulfur Dioxide
Molecule
Molecule
75.
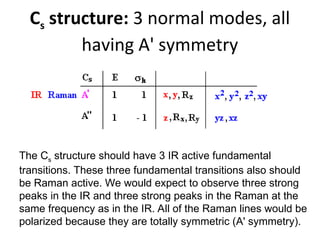
Cs structure: 3normal modes, all
having A' symmetry
The Cs structure should have 3 IR active fundamental
transitions. These three fundamental transitions also should
be Raman active. We would expect to observe three strong
peaks in the IR and three strong peaks in the Raman at the
same frequency as in the IR. All of the Raman lines would be
polarized because they are totally symmetric (A' symmetry).
76.
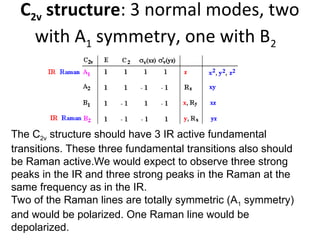
C2v structure: 3normal modes, two
with A1 symmetry, one with B2
The C2v structure should have 3 IR active fundamental
transitions. These three fundamental transitions also should
be Raman active.We would expect to observe three strong
peaks in the IR and three strong peaks in the Raman at the
same frequency as in the IR.
Two of the Raman lines are totally symmetric (A1 symmetry)
and would be polarized. One Raman line would be
depolarized.
77.
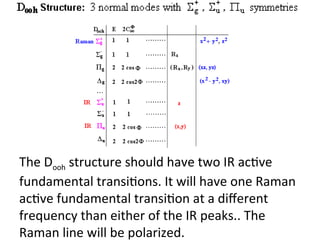
The Dooh structureshould have two IR active
fundamental transitions. It will have one Raman
active fundamental transition at a different
frequency than either of the IR peaks.. The
Raman line will be polarized.
78.
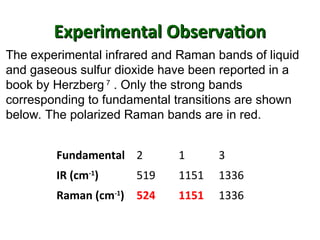
Experimental Observation
Experimental Observation
Fundamental2 1 3
IR (cm-1
) 519 1151 1336
Raman (cm-1
) 524 1151 1336
The experimental infrared and Raman bands of liquid
and gaseous sulfur dioxide have been reported in a
book by Herzberg 7
. Only the strong bands
corresponding to fundamental transitions are shown
below. The polarized Raman bands are in red.
79.
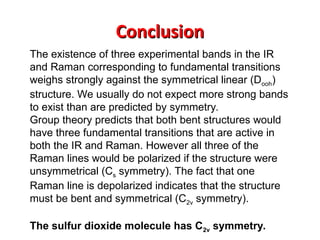
Conclusion
Conclusion
The existence ofthree experimental bands in the IR
and Raman corresponding to fundamental transitions
weighs strongly against the symmetrical linear (Dooh)
structure. We usually do not expect more strong bands
to exist than are predicted by symmetry.
Group theory predicts that both bent structures would
have three fundamental transitions that are active in
both the IR and Raman. However all three of the
Raman lines would be polarized if the structure were
unsymmetrical (Cs symmetry). The fact that one
Raman line is depolarized indicates that the structure
must be bent and symmetrical (C2v symmetry).
The sulfur dioxide molecule has C2v symmetry.
80.
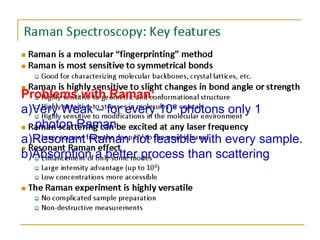
Problems with Raman:
a)VeryWeak – for every 106
photons only 1
photon Raman
a)Resonant Raman not feasible with every sample.
b)Absorption a better process than scattering
81.
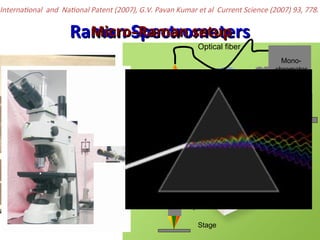
Raman Spectrometers
Raman Spectrometers
Micro–Ramansetup
Micro–Raman setup
International and National Patent (2007), G.V. Pavan Kumar et al Current Science (2007) 93, 778.
Stage
Objective lens
Dichroic
Mirror
Camera
Edge filter
Focusing lens
Computer
Mono-
chromator
CCD
Optical fiber
LASER


![Collecting Optics – Overview on
Collecting Optics – Overview on
common objectives
common objectives
Objective N.A.
Working distance
[mm]
x100 0.90 0.21
x50 0.75 0.38
x10 0.25 10.6
x100 LWD 0.80 3.4
x50 LWD 0.50 10.6
CASR](https://image.slidesharecdn.com/raman2-250226153144-4fd8f1aa/85/Raman-spectroscopy-for-the-college-students-39-320.jpg)


![200 400 600 800 1000 1200 1400 1600 1800
244 - 269 nm (25 nm)
325 - 371 nm (46 nm)
457 - 553 nm (96 nm)
488 - 599 nm (111 nm)
514 - 639 nm (125 nm)
532 - 667 nm (135 nm)
633 - 833 nm (200 nm)
785 - 1119 nm (334 nm)
830 - 1210 nm (380 nm)
1064 - 1768 nm (704 nm)
Horizontal lines indicate a relative Raman Shift of 3800 cm
-1
Wavelength [nm]
Dispersion as a function of excitation
Dispersion as a function of excitation
wavelength
wavelength
Long wavelength
Short wavelength
Same focal length
Same grating
CCD
Detector
CCD
Detector
CASR](https://image.slidesharecdn.com/raman2-250226153144-4fd8f1aa/85/Raman-spectroscopy-for-the-college-students-46-320.jpg)

![Spatial resolution: penetration depth
Spatial resolution: penetration depth
0
500
1000
1500
2000
2500
3000
244 nm 325 nm 457 nm 488 nm 514 nm 633 nm
Wavelength [nm]
D
e
p
t
h
p
e
n
e
t
r
a
t
io
n
[
n
m
]
General: The larger the excitation wavelength,
the deeper the penetration.
The exact values depend on material.
Penetration depth in Silicon
0
2
4
6
8
10
12
244 nm 325 nm
CASR](https://image.slidesharecdn.com/raman2-250226153144-4fd8f1aa/85/Raman-spectroscopy-for-the-college-students-52-320.jpg)
![400 450 500 550
Intensity
[
a
.u.]
Raman shift (cm-1)
785 nm
Spatial resolution: penetration depth
Spatial resolution: penetration depth
Uniform layer of SiGe
Gradient SiGe layer
Pure Si substrate
Strained silicon layer
400 450 500 550
Intensity
[
a
.u.]
Raman shift (cm-1)
325 nm 488 nm 785 nm
The higher the excitation wavelength, the deeper the penetration.
488 nm
400 450 500 550
Intensity
[
a
.u.]
Raman shift (cm-1)
325 nm
Strained Si
of top layer
Si of silicon
substrate
Si of SiGe
layer
~nm
~nm
~µm
CASR](https://image.slidesharecdn.com/raman2-250226153144-4fd8f1aa/85/Raman-spectroscopy-for-the-college-students-53-320.jpg)