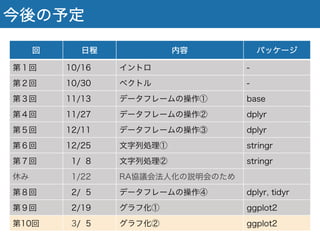
棒グラフを書く①
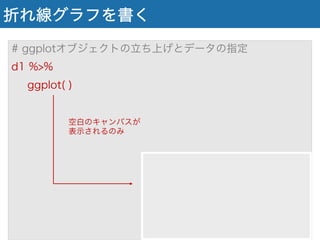
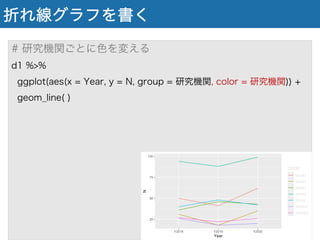
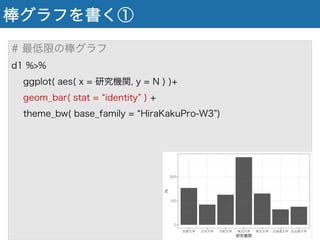
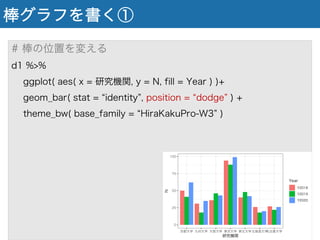
# 棒の位置を変える
d1 %>%
ggplot(aes( x = 研究機関, y = N, fill = Year ) )+
geom_bar( stat = identity , position = dodge ) +
theme_bw( base_family = HiraKakuPro-W3 )
24.
棒グラフを書く①
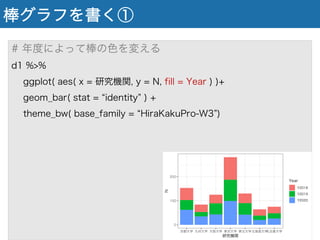
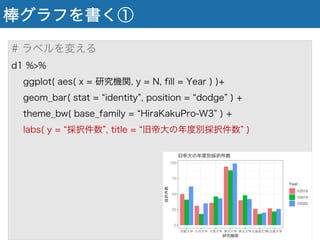
# ラベルを変える
d1 %>%
ggplot(aes( x = 研究機関, y = N, fill = Year ) )+
geom_bar( stat = identity , position = dodge ) +
theme_bw( base_family = HiraKakuPro-W3 ) +
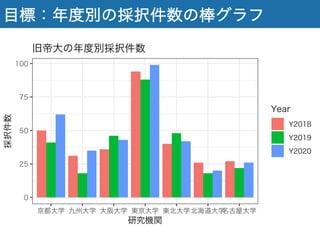
labs( y = 採択件数 , title = 旧帝大の年度別採択件数 )
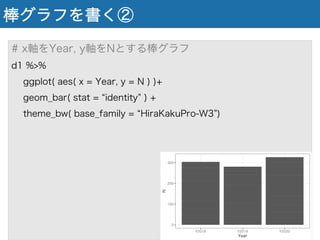
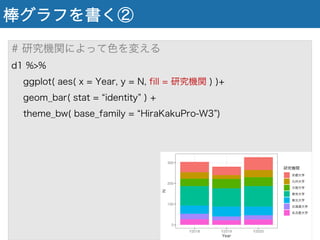
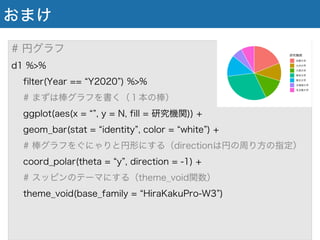
棒グラフを書く②
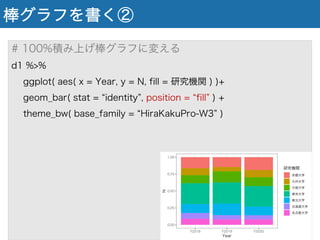
# 100%積み上げ棒グラフに変える
d1 %>%
ggplot(aes( x = Year, y = N, fill = 研究機関 ) )+
geom_bar( stat = identity , position = fill ) +
theme_bw( base_family = HiraKakuPro-W3 )
30.
棒グラフを書く②
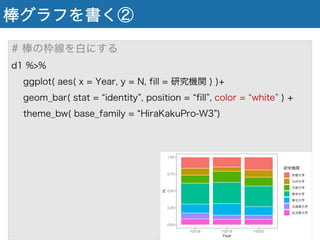
# 棒の枠線を白にする
d1 %>%
ggplot(aes( x = Year, y = N, fill = 研究機関 ) )+
geom_bar( stat = identity , position = fill , color = white ) +
theme_bw( base_family = HiraKakuPro-W3 )
31.
棒グラフを書く②
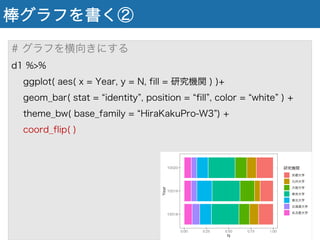
# グラフを横向きにする
d1 %>%
ggplot(aes( x = Year, y = N, fill = 研究機関 ) )+
geom_bar( stat = identity , position = fill , color = white ) +
theme_bw( base_family = HiraKakuPro-W3 ) +
coord_flip( )
32.
棒グラフを書く②
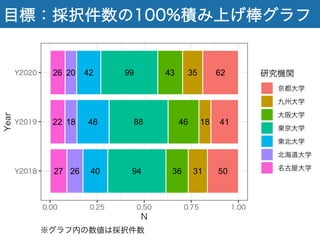
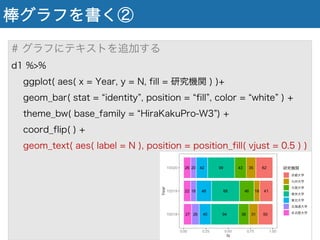
# グラフにテキストを追加する
d1 %>%
ggplot(aes( x = Year, y = N, fill = 研究機関 ) )+
geom_bar( stat = identity , position = fill , color = white ) +
theme_bw( base_family = HiraKakuPro-W3 ) +
coord_flip( ) +
geom_text( aes( label = N ), position = position_fill( vjust = 0.5 ) )