
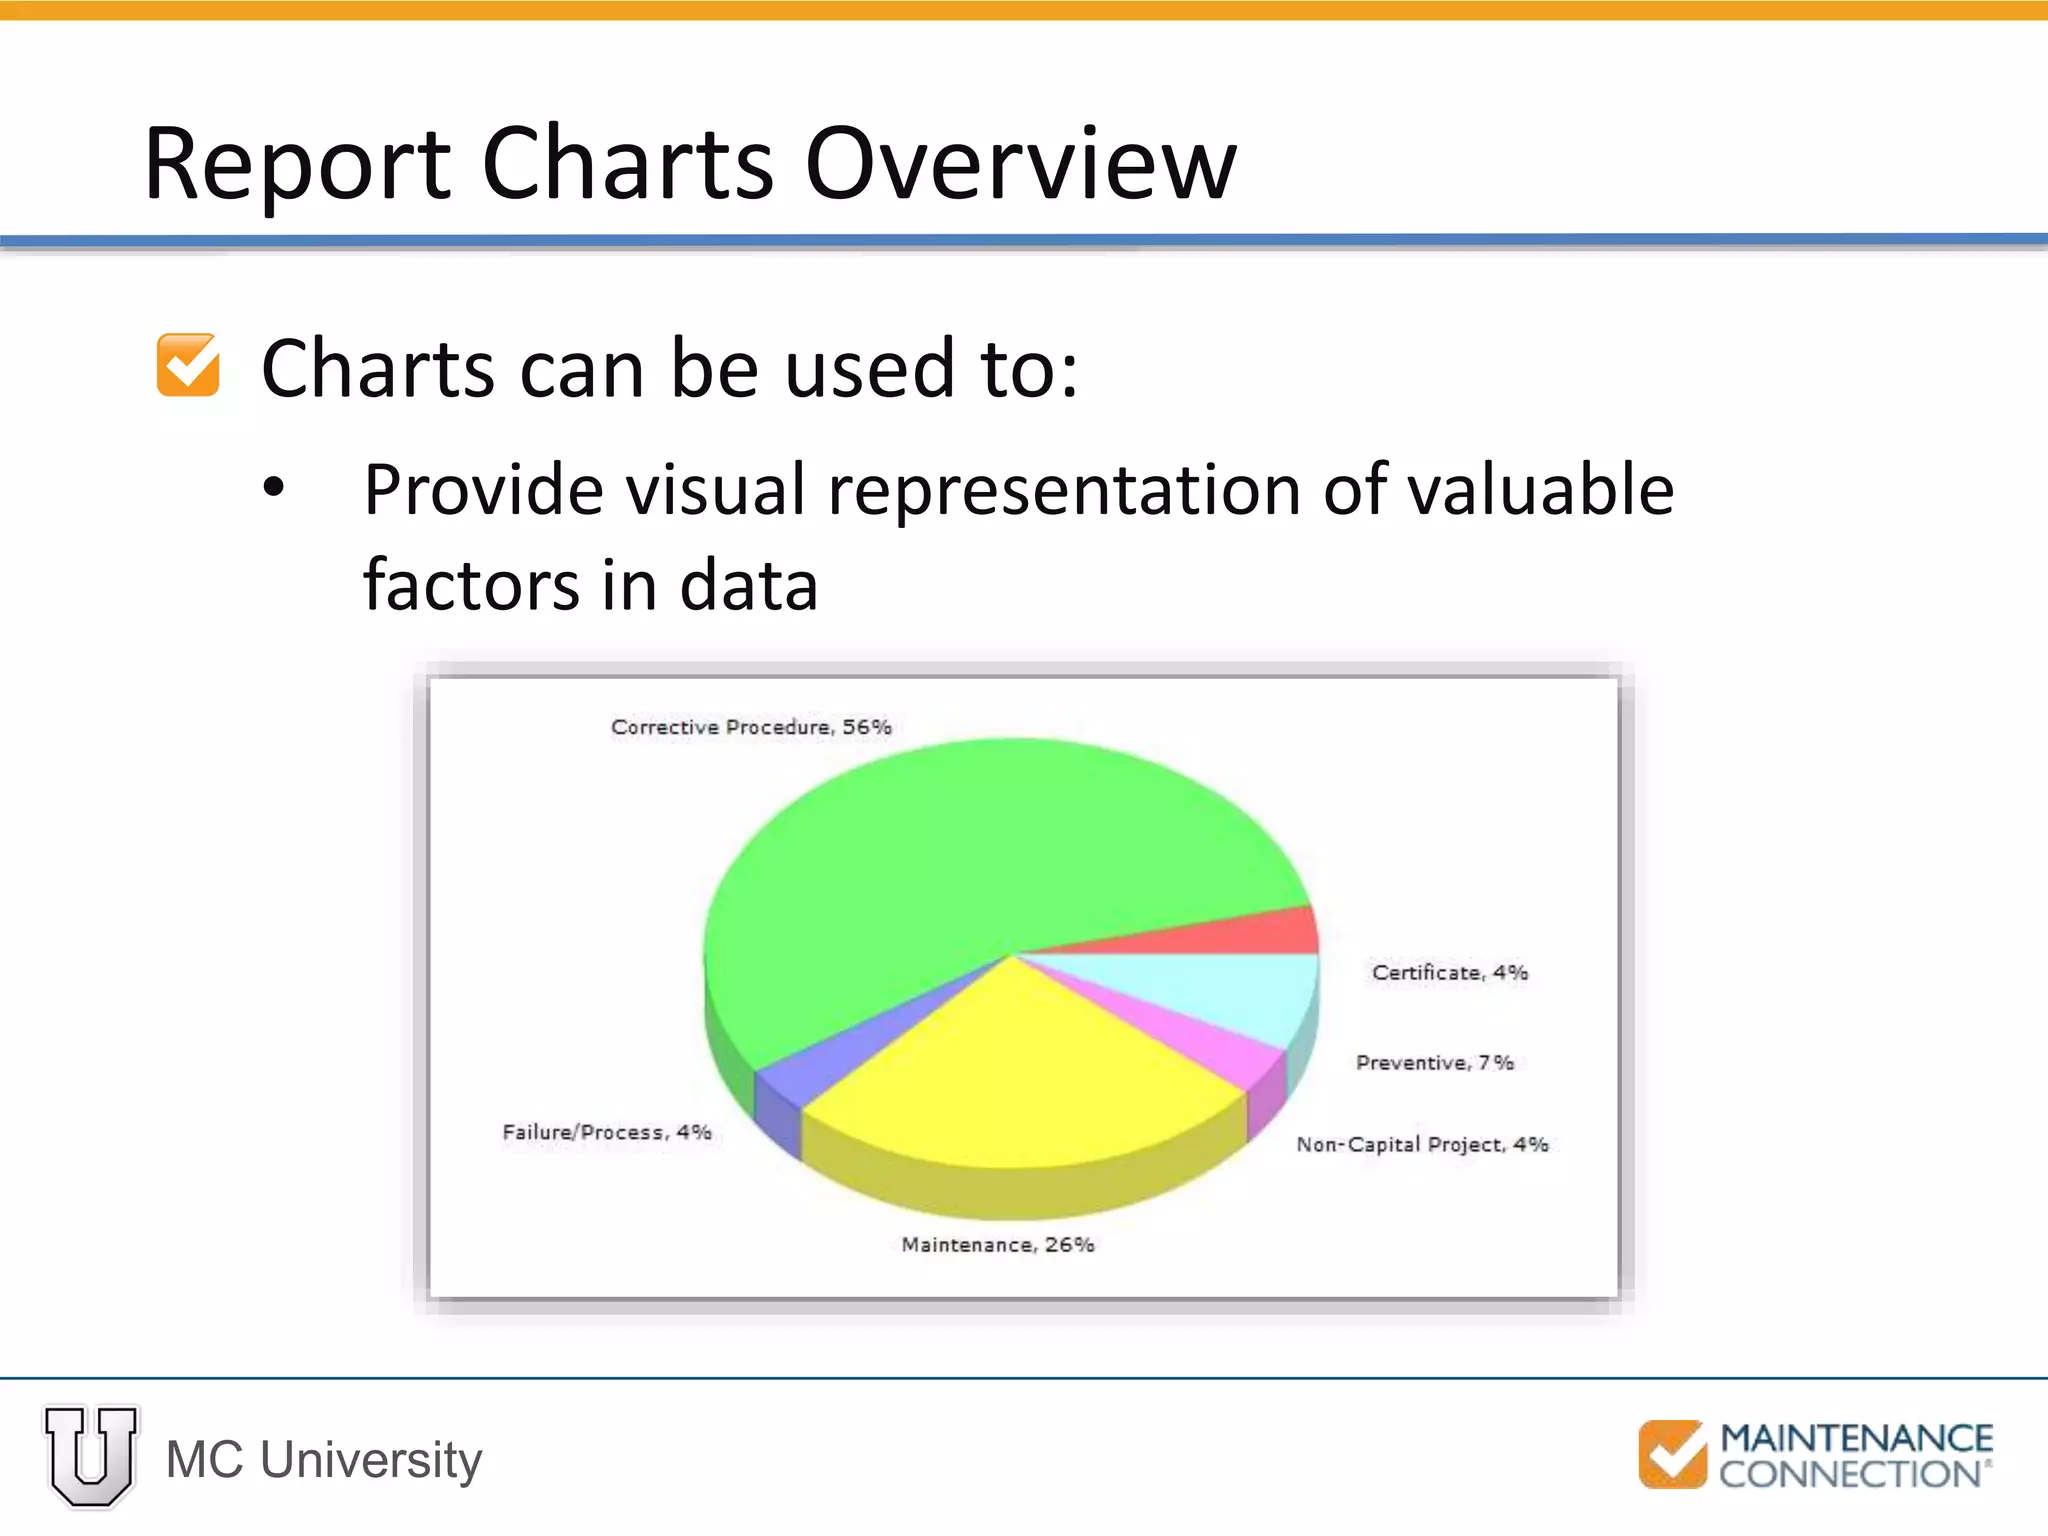
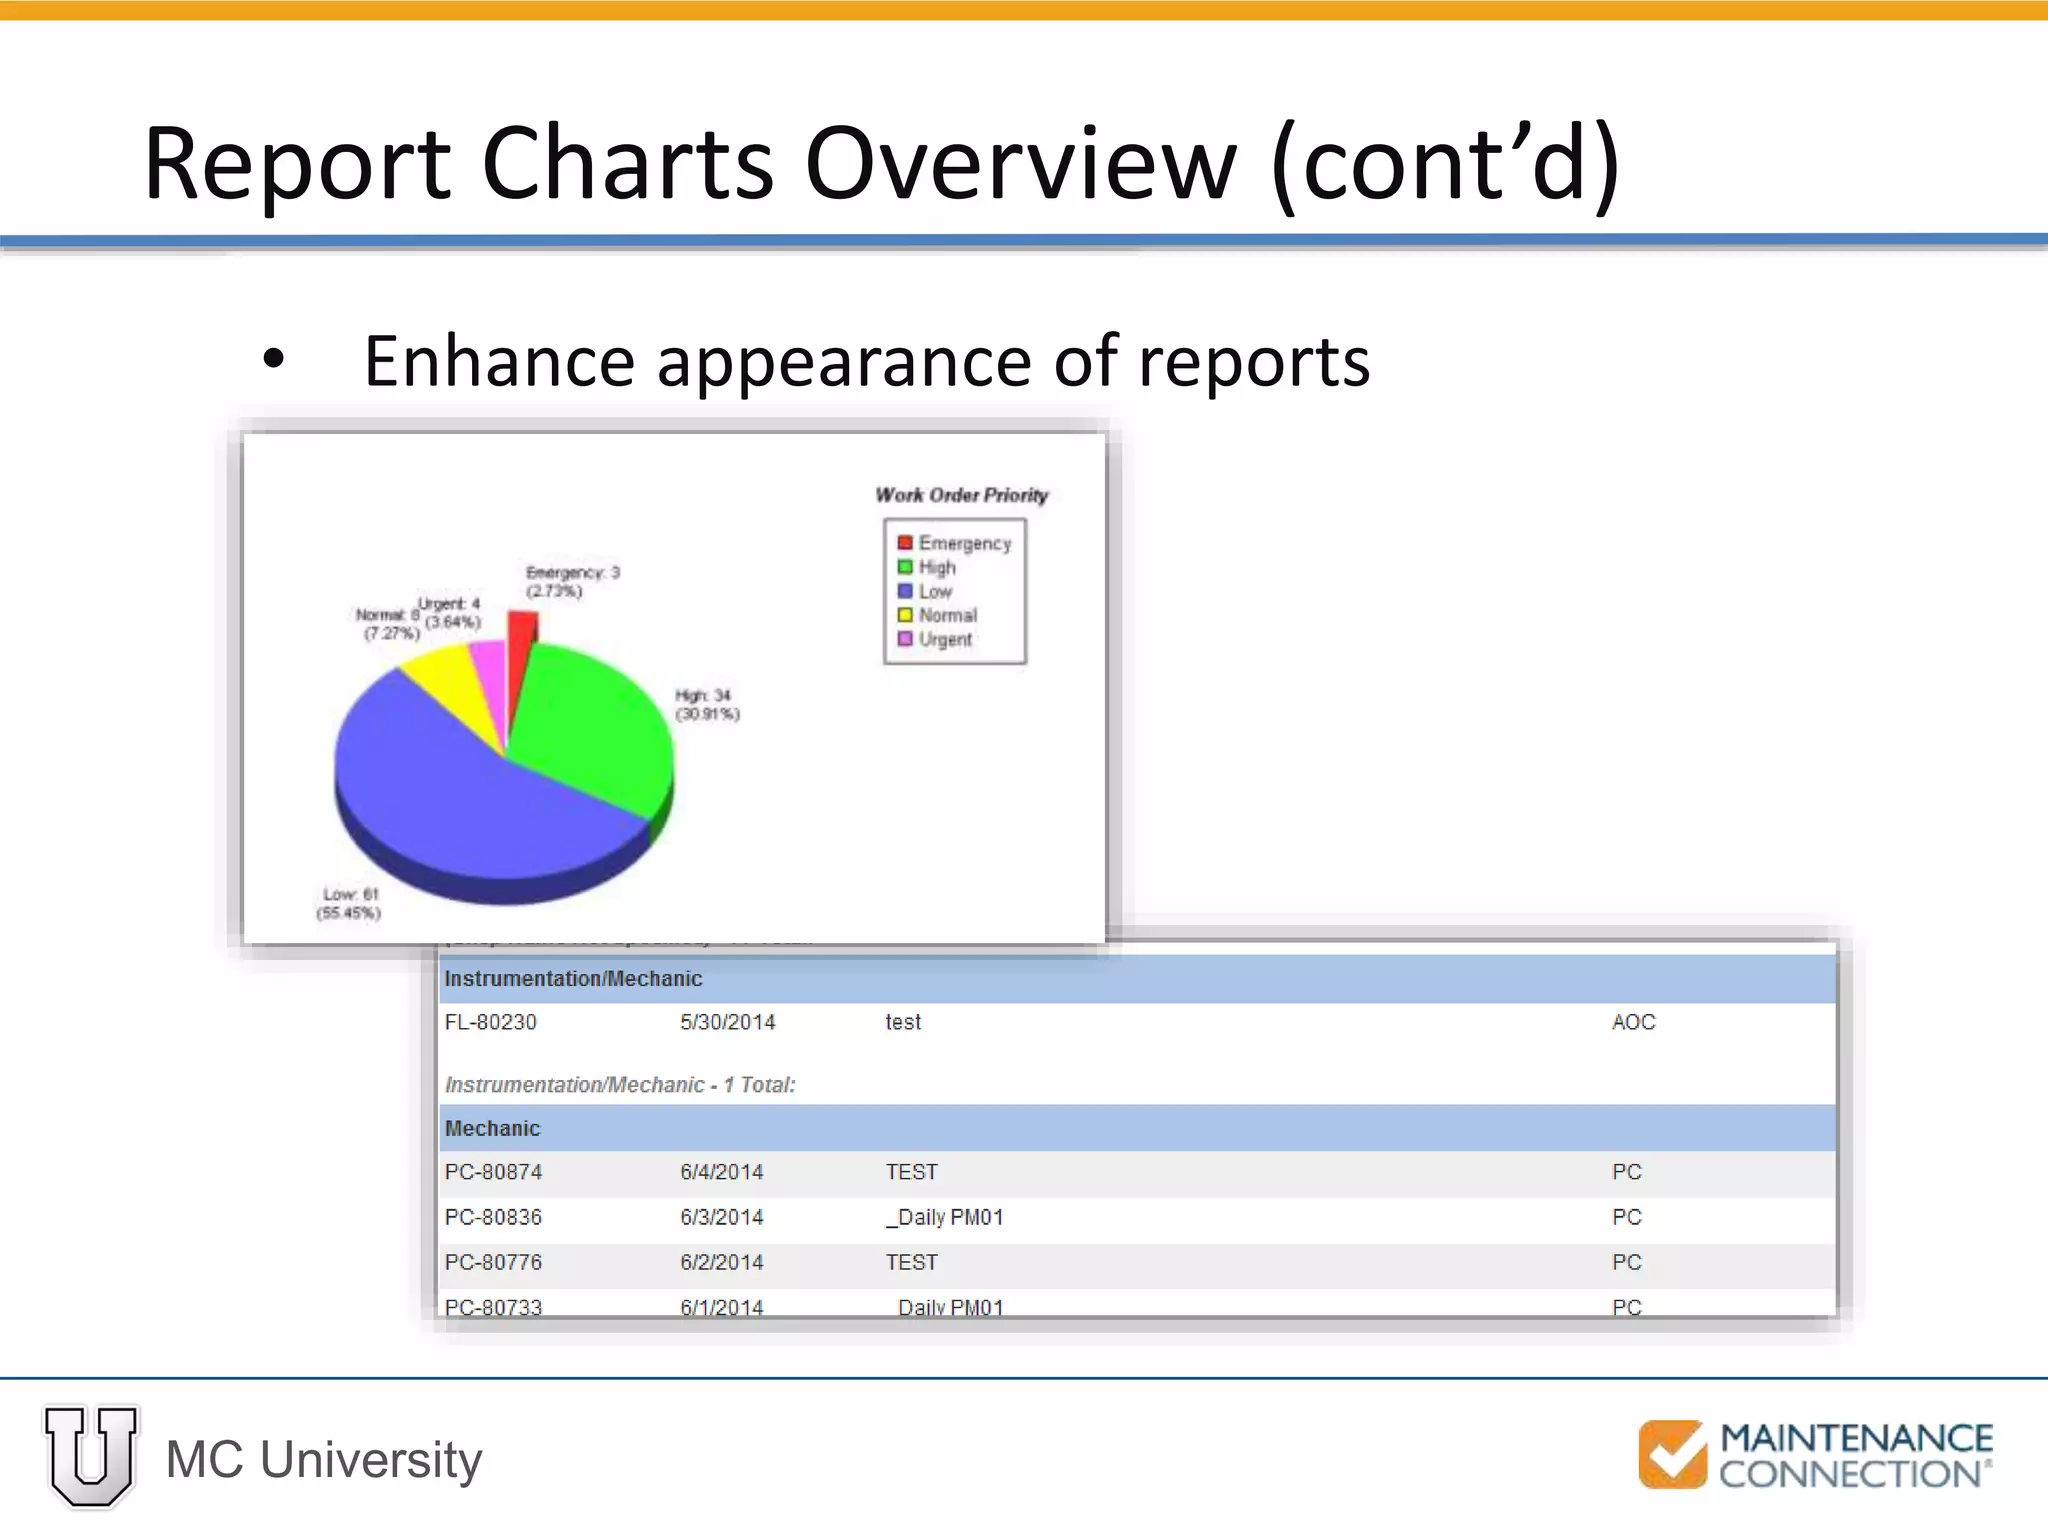
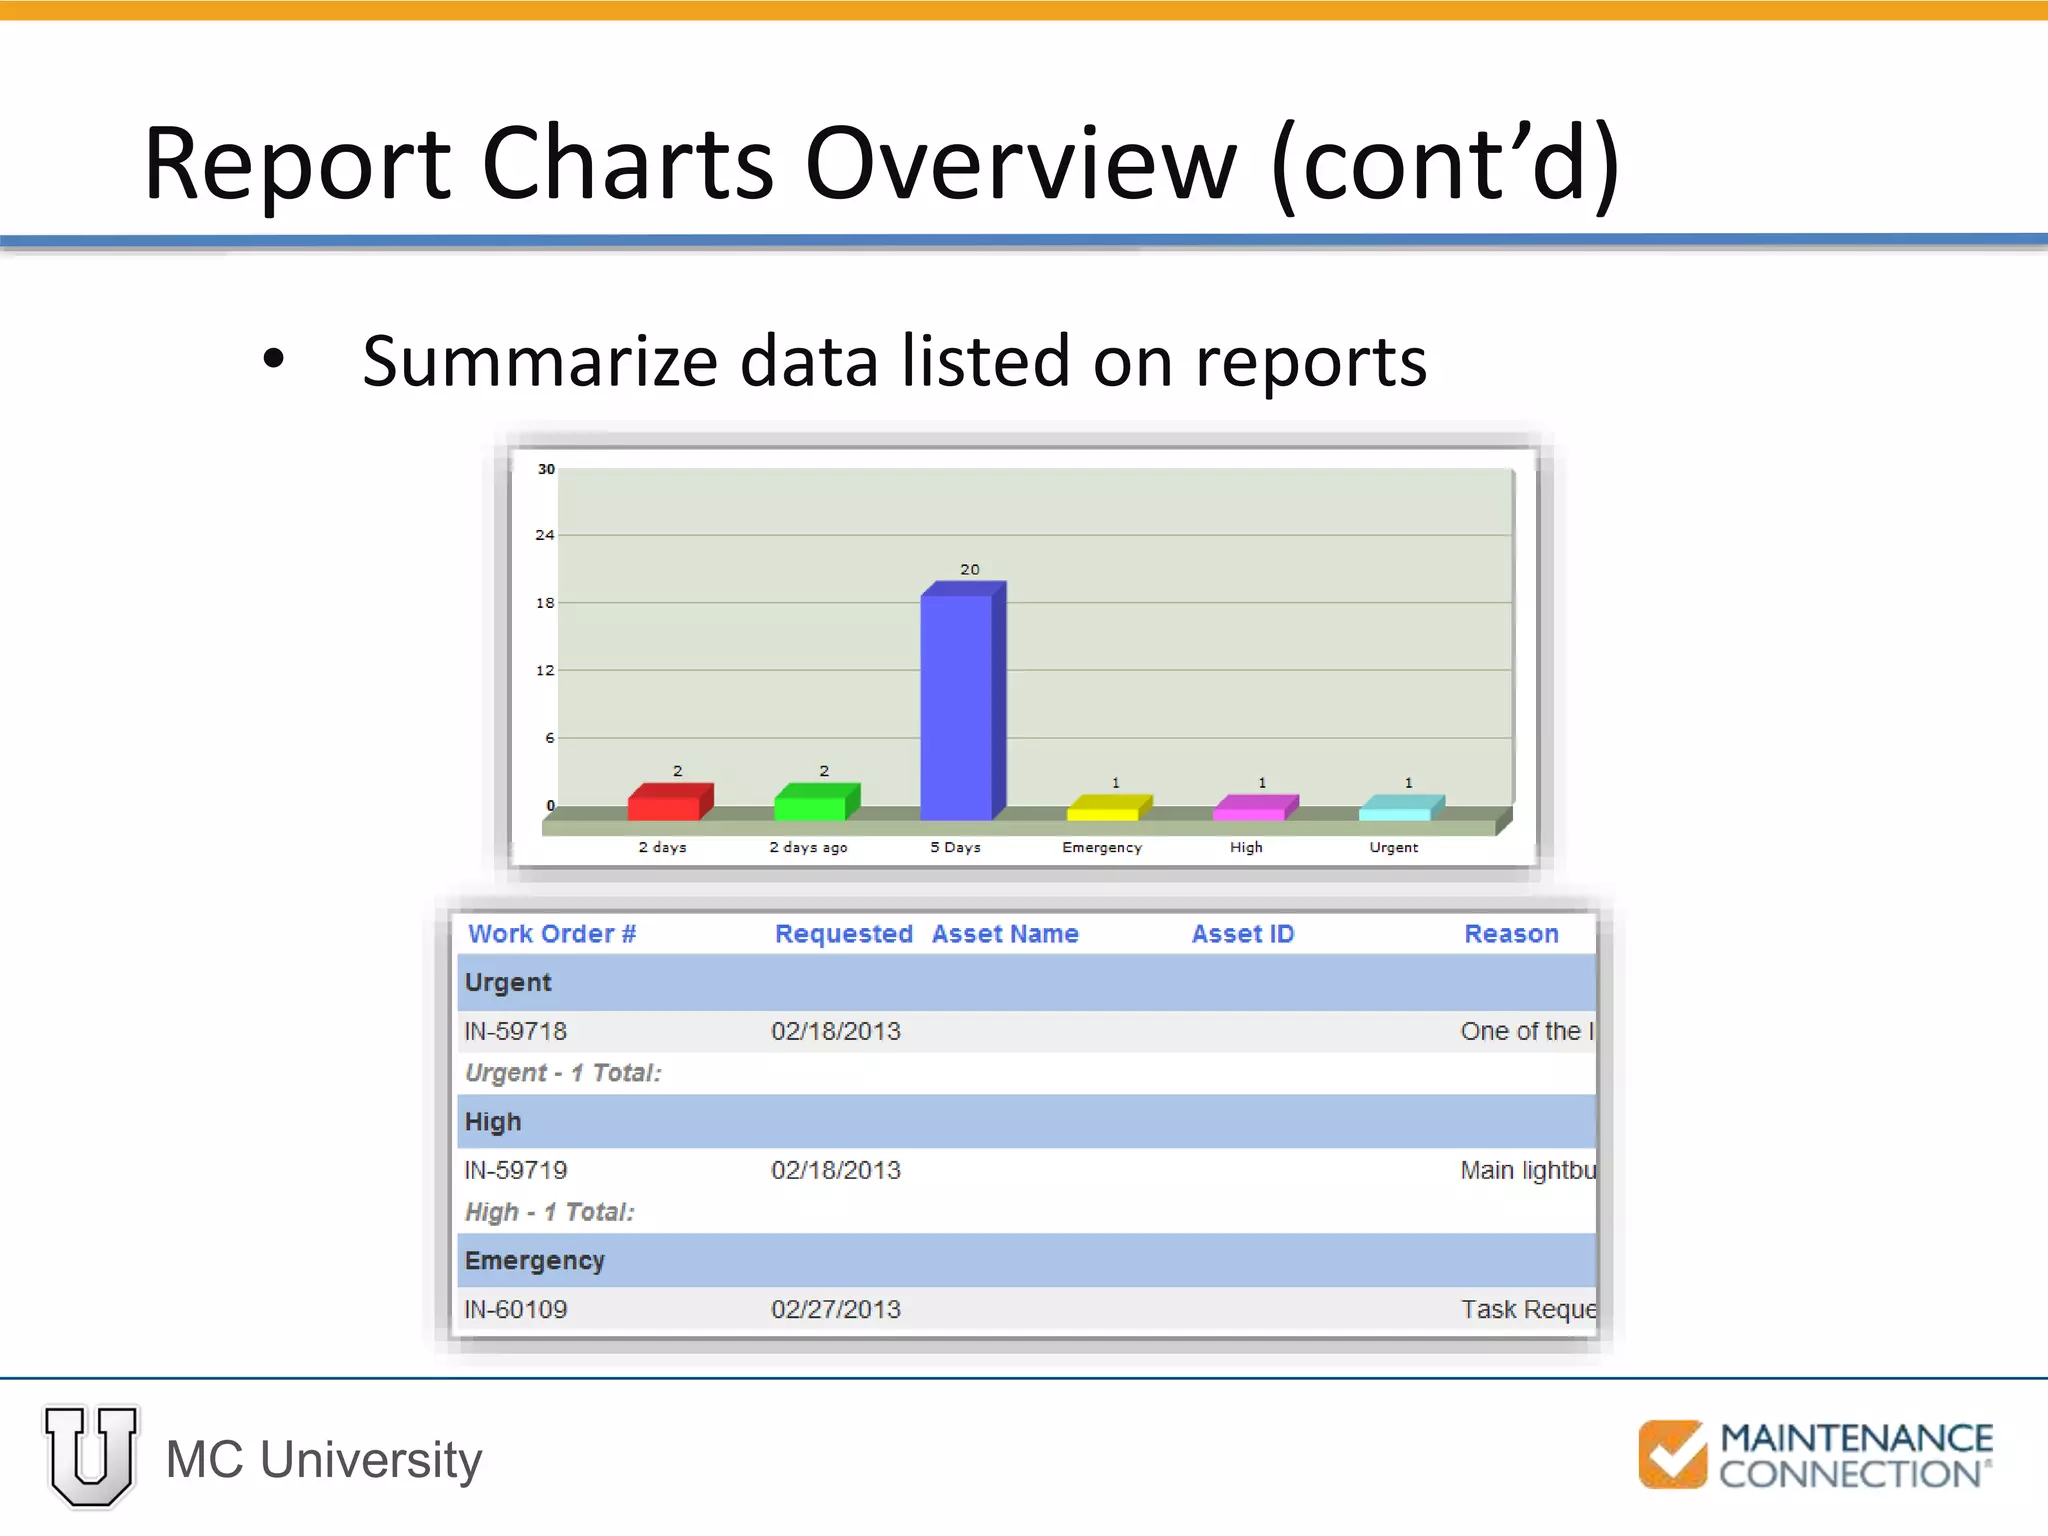
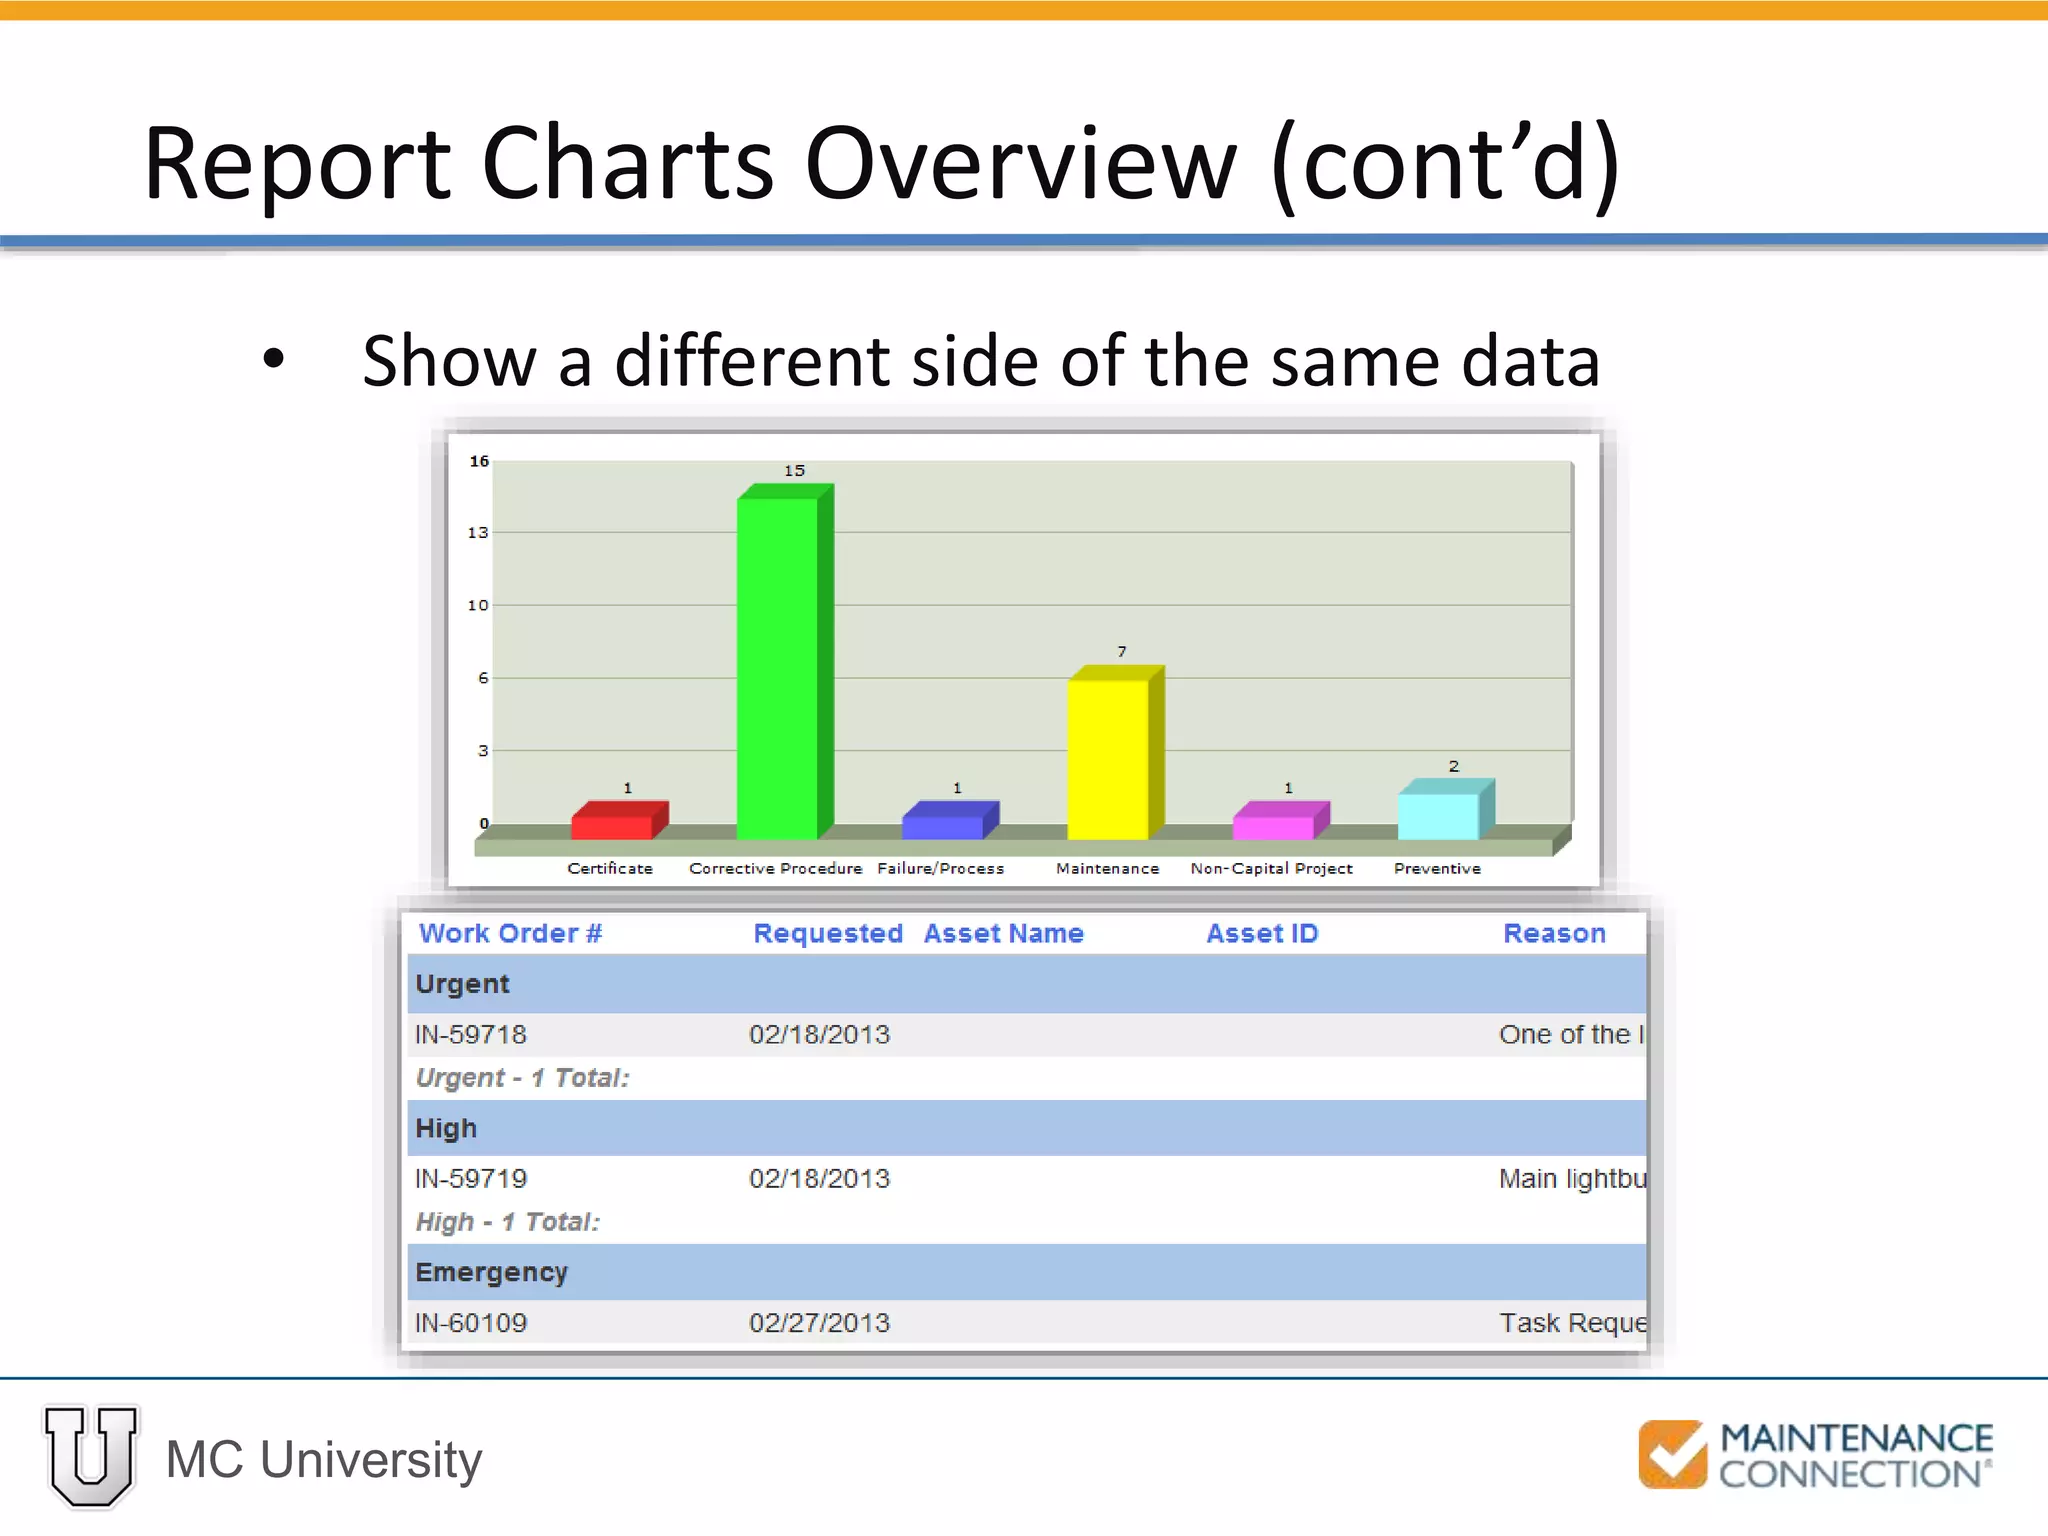
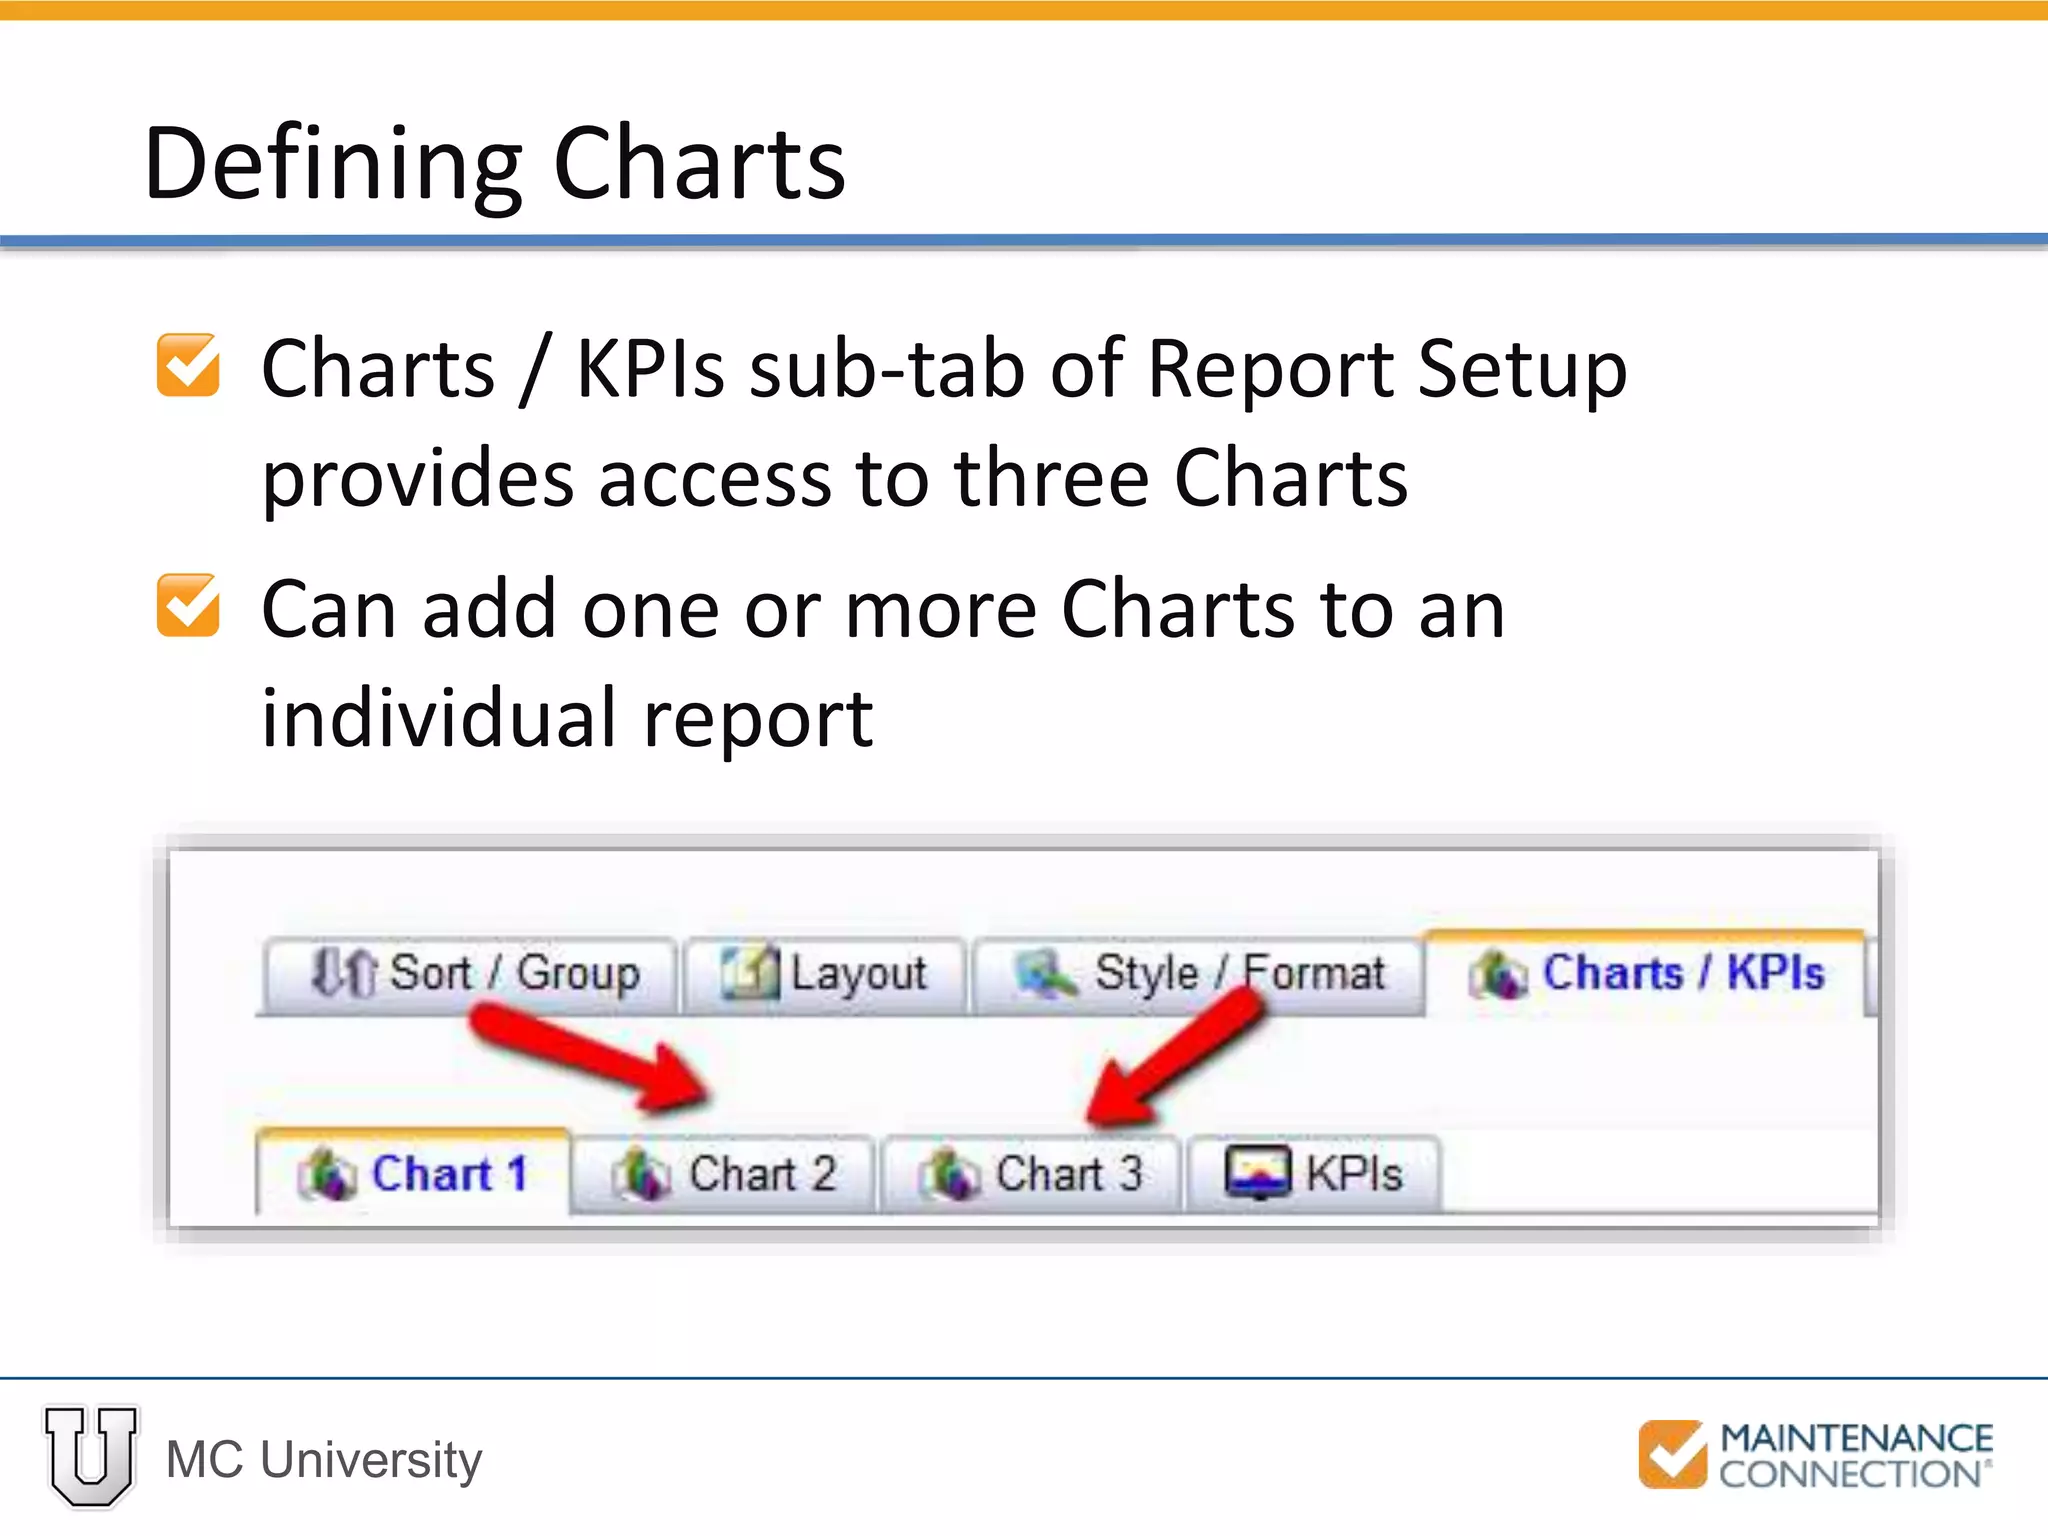
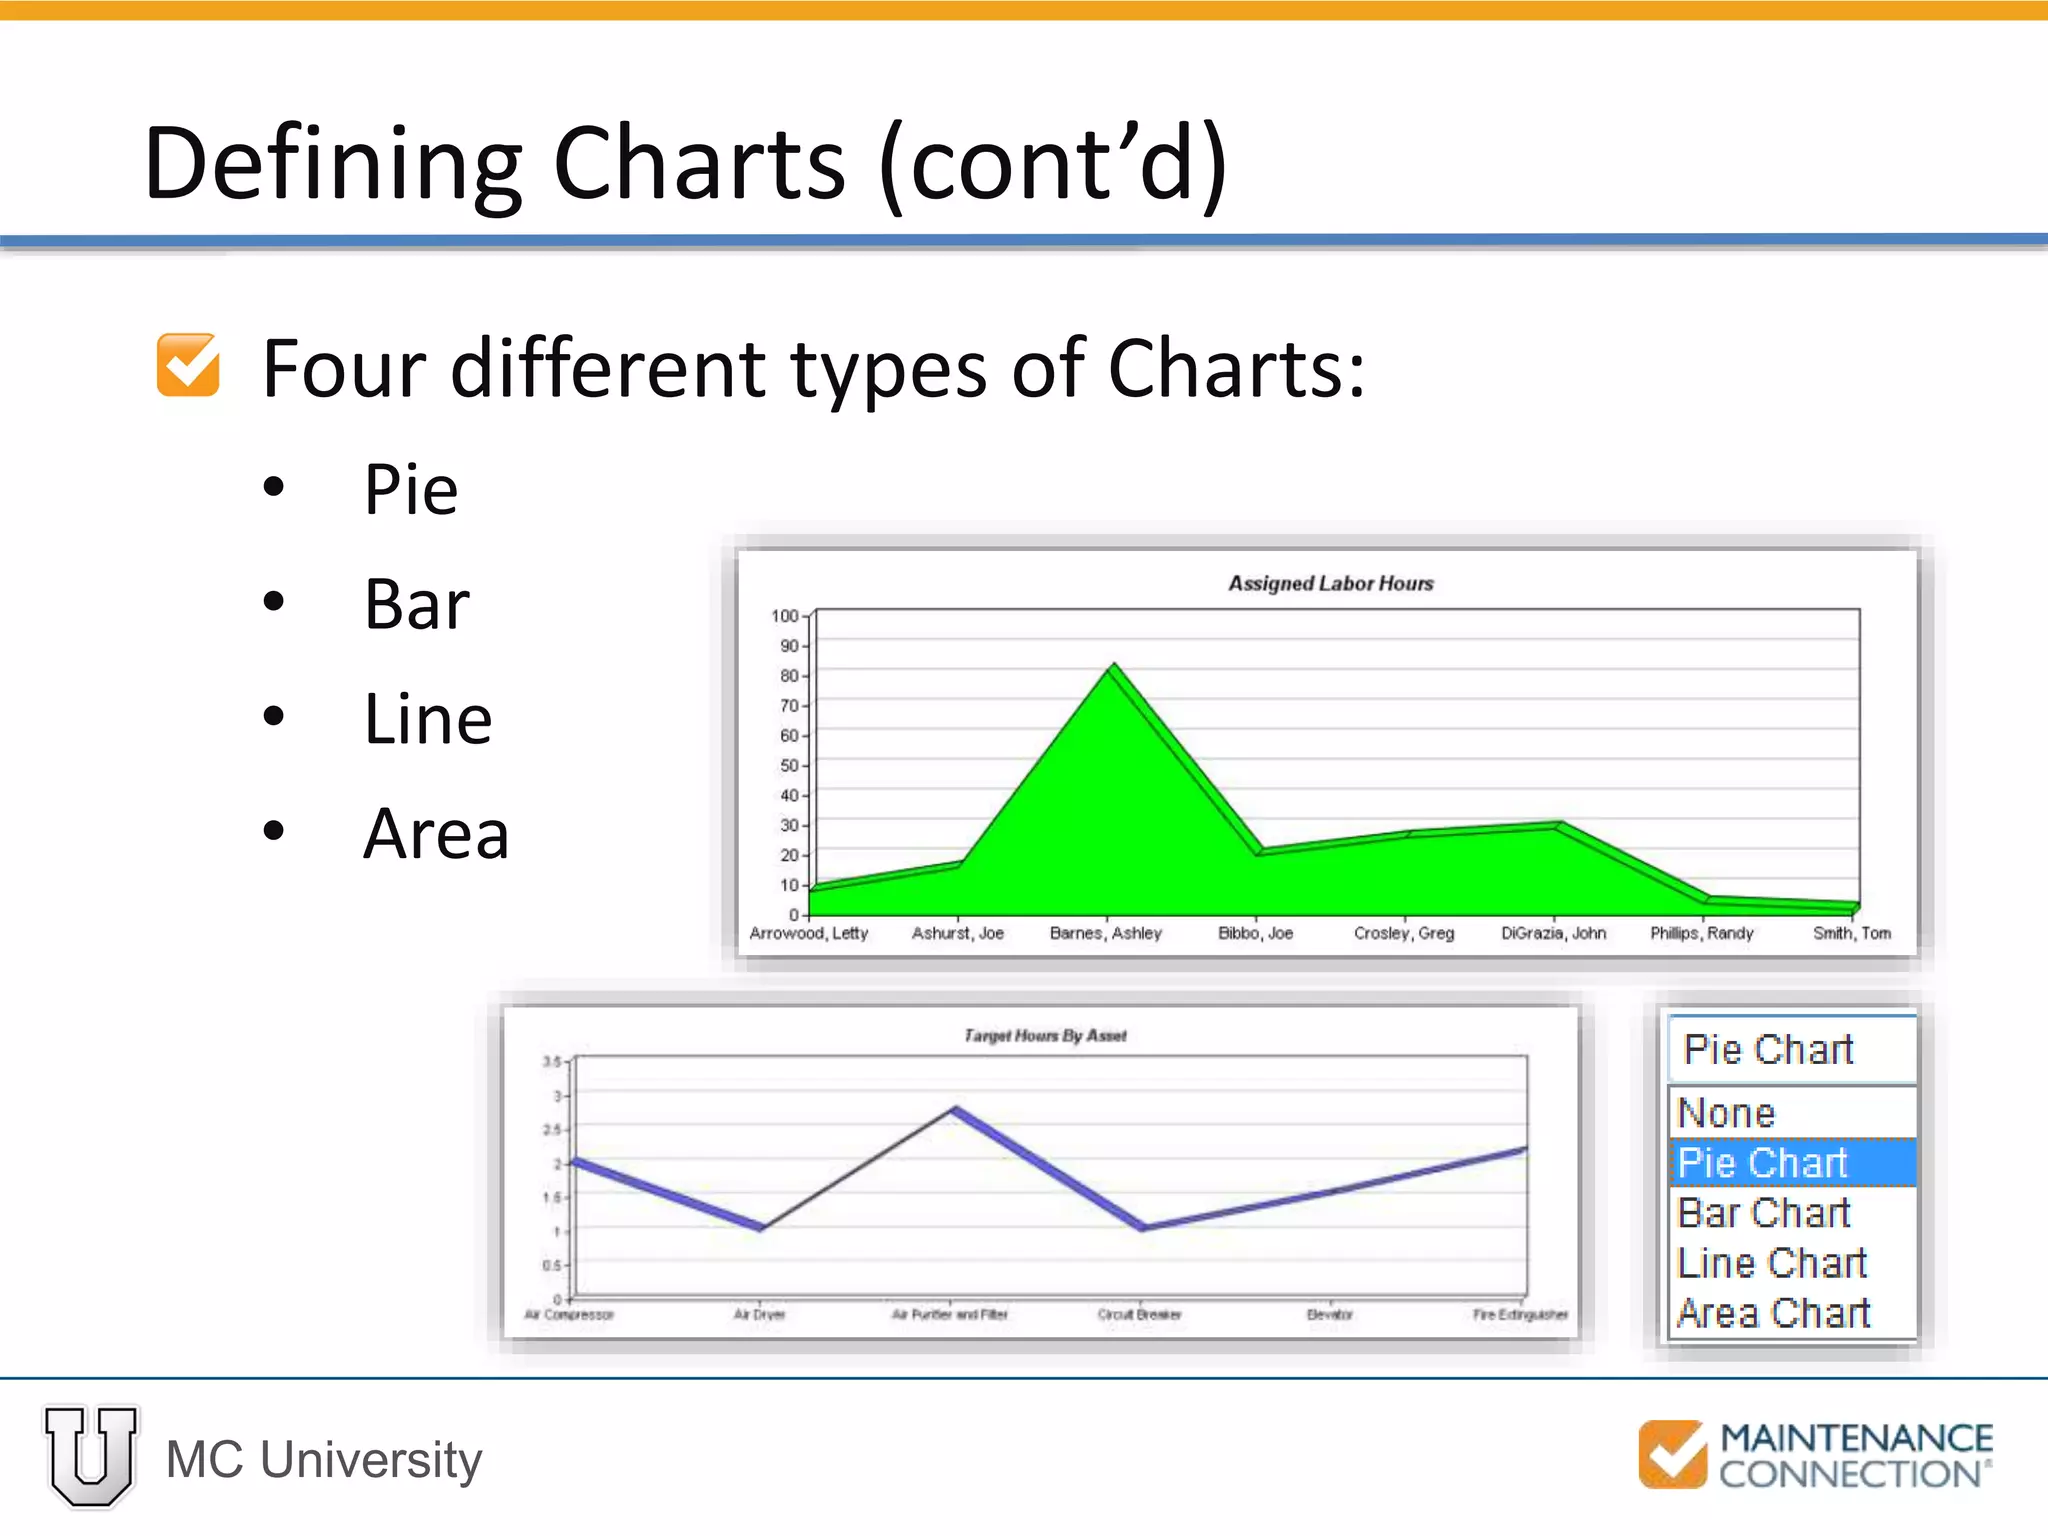
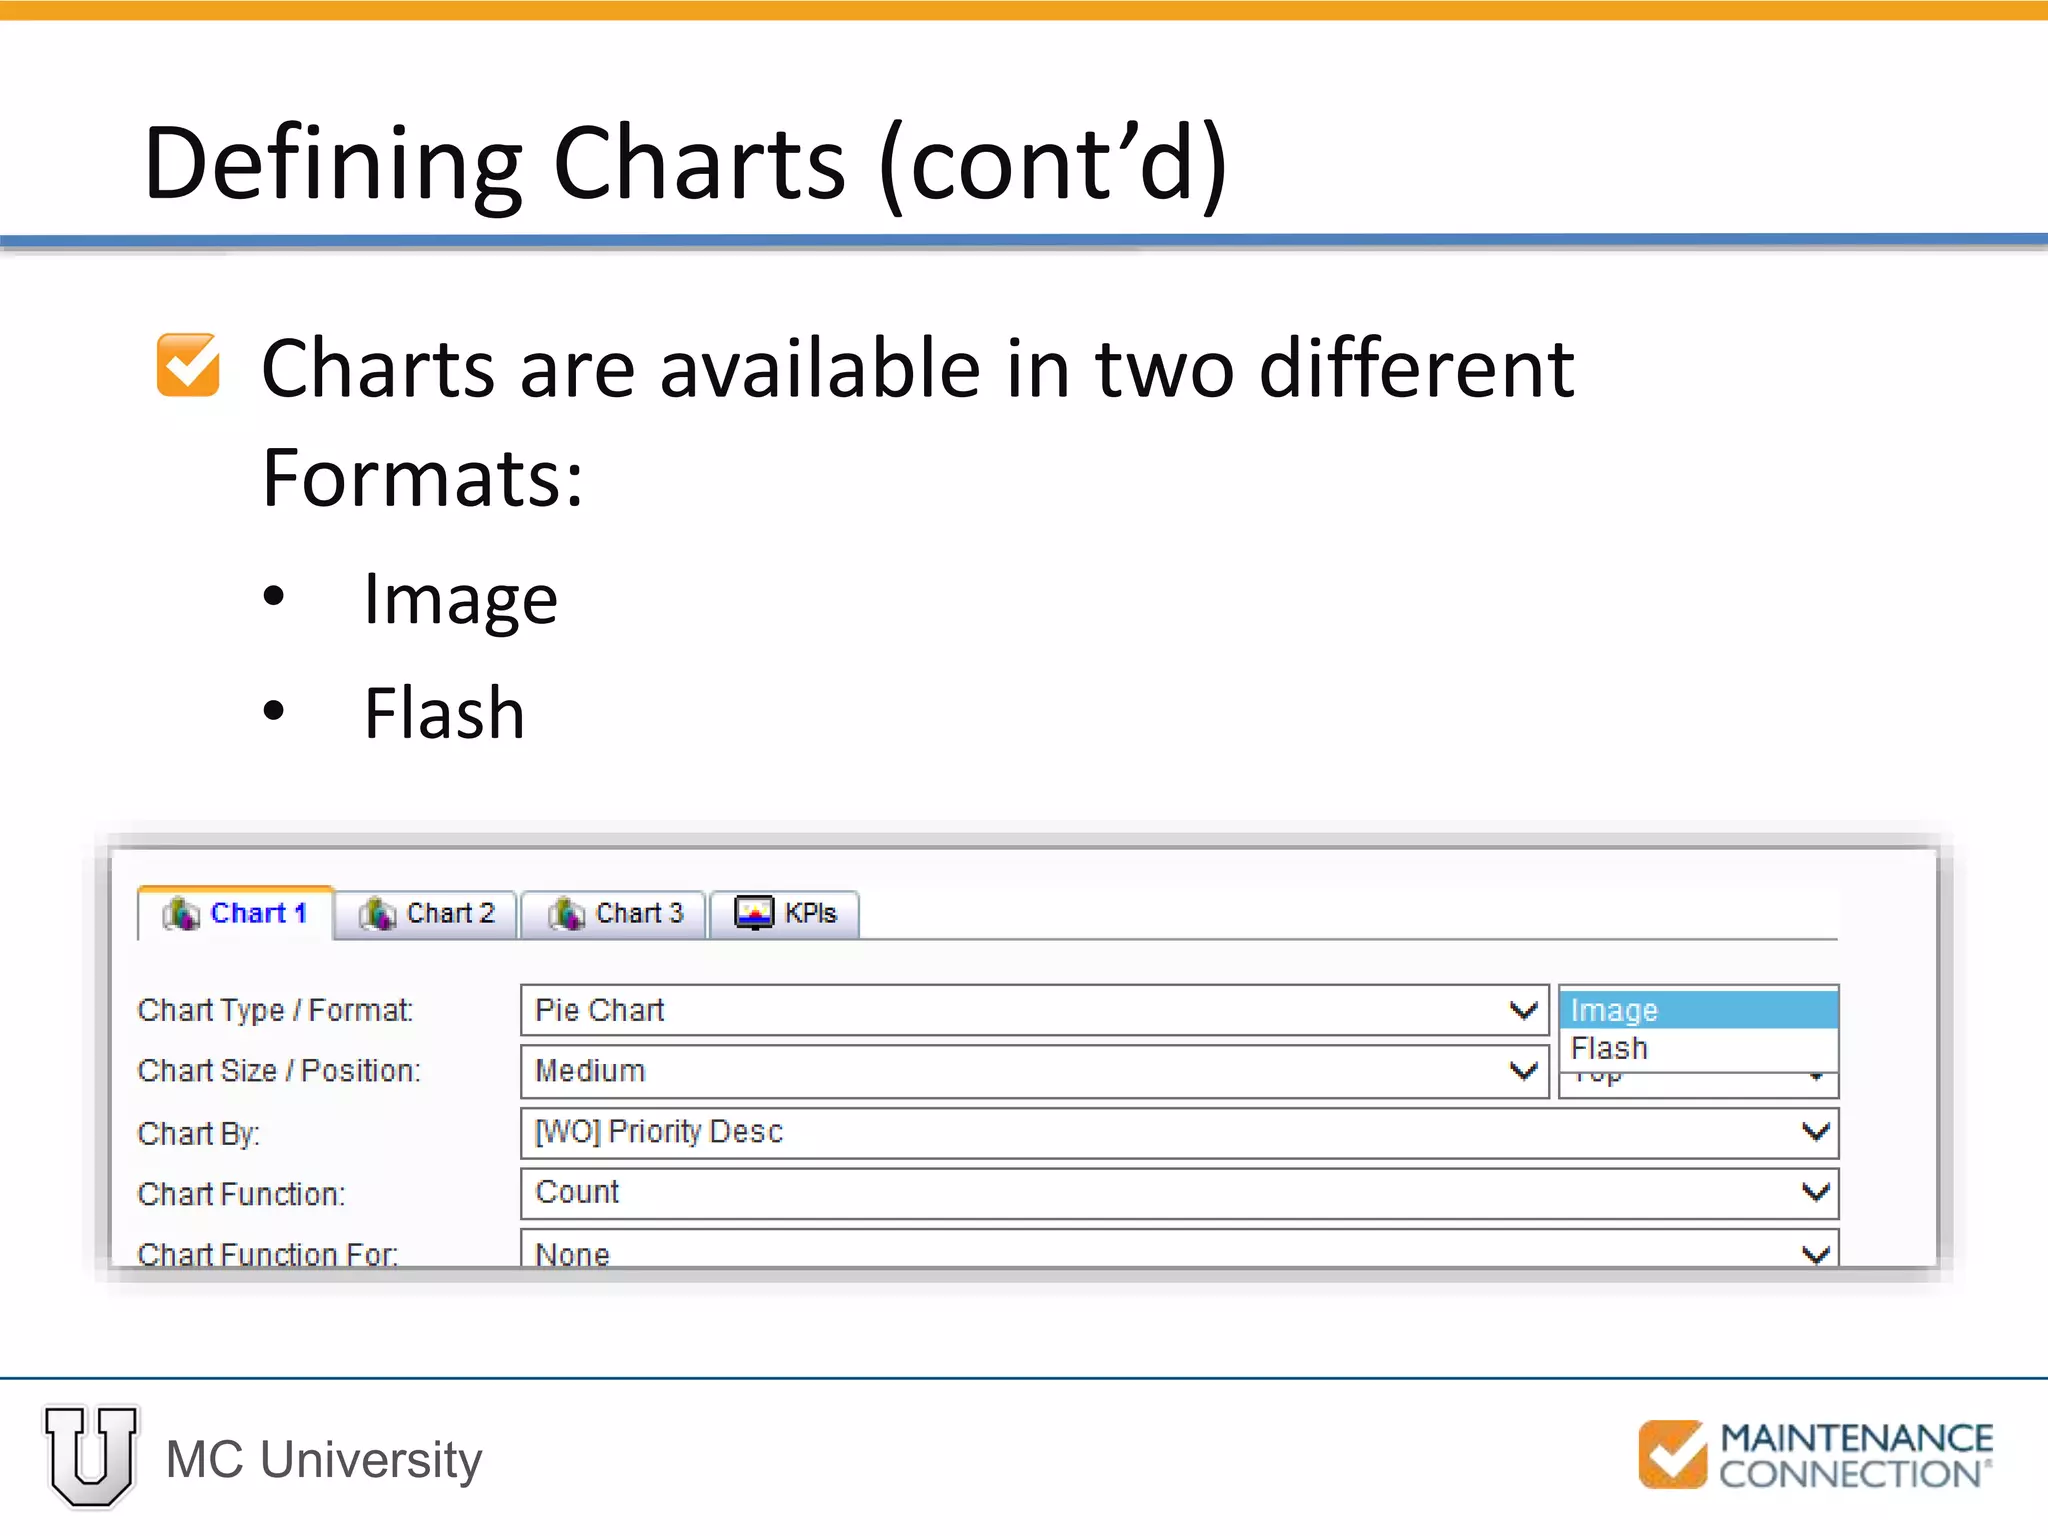
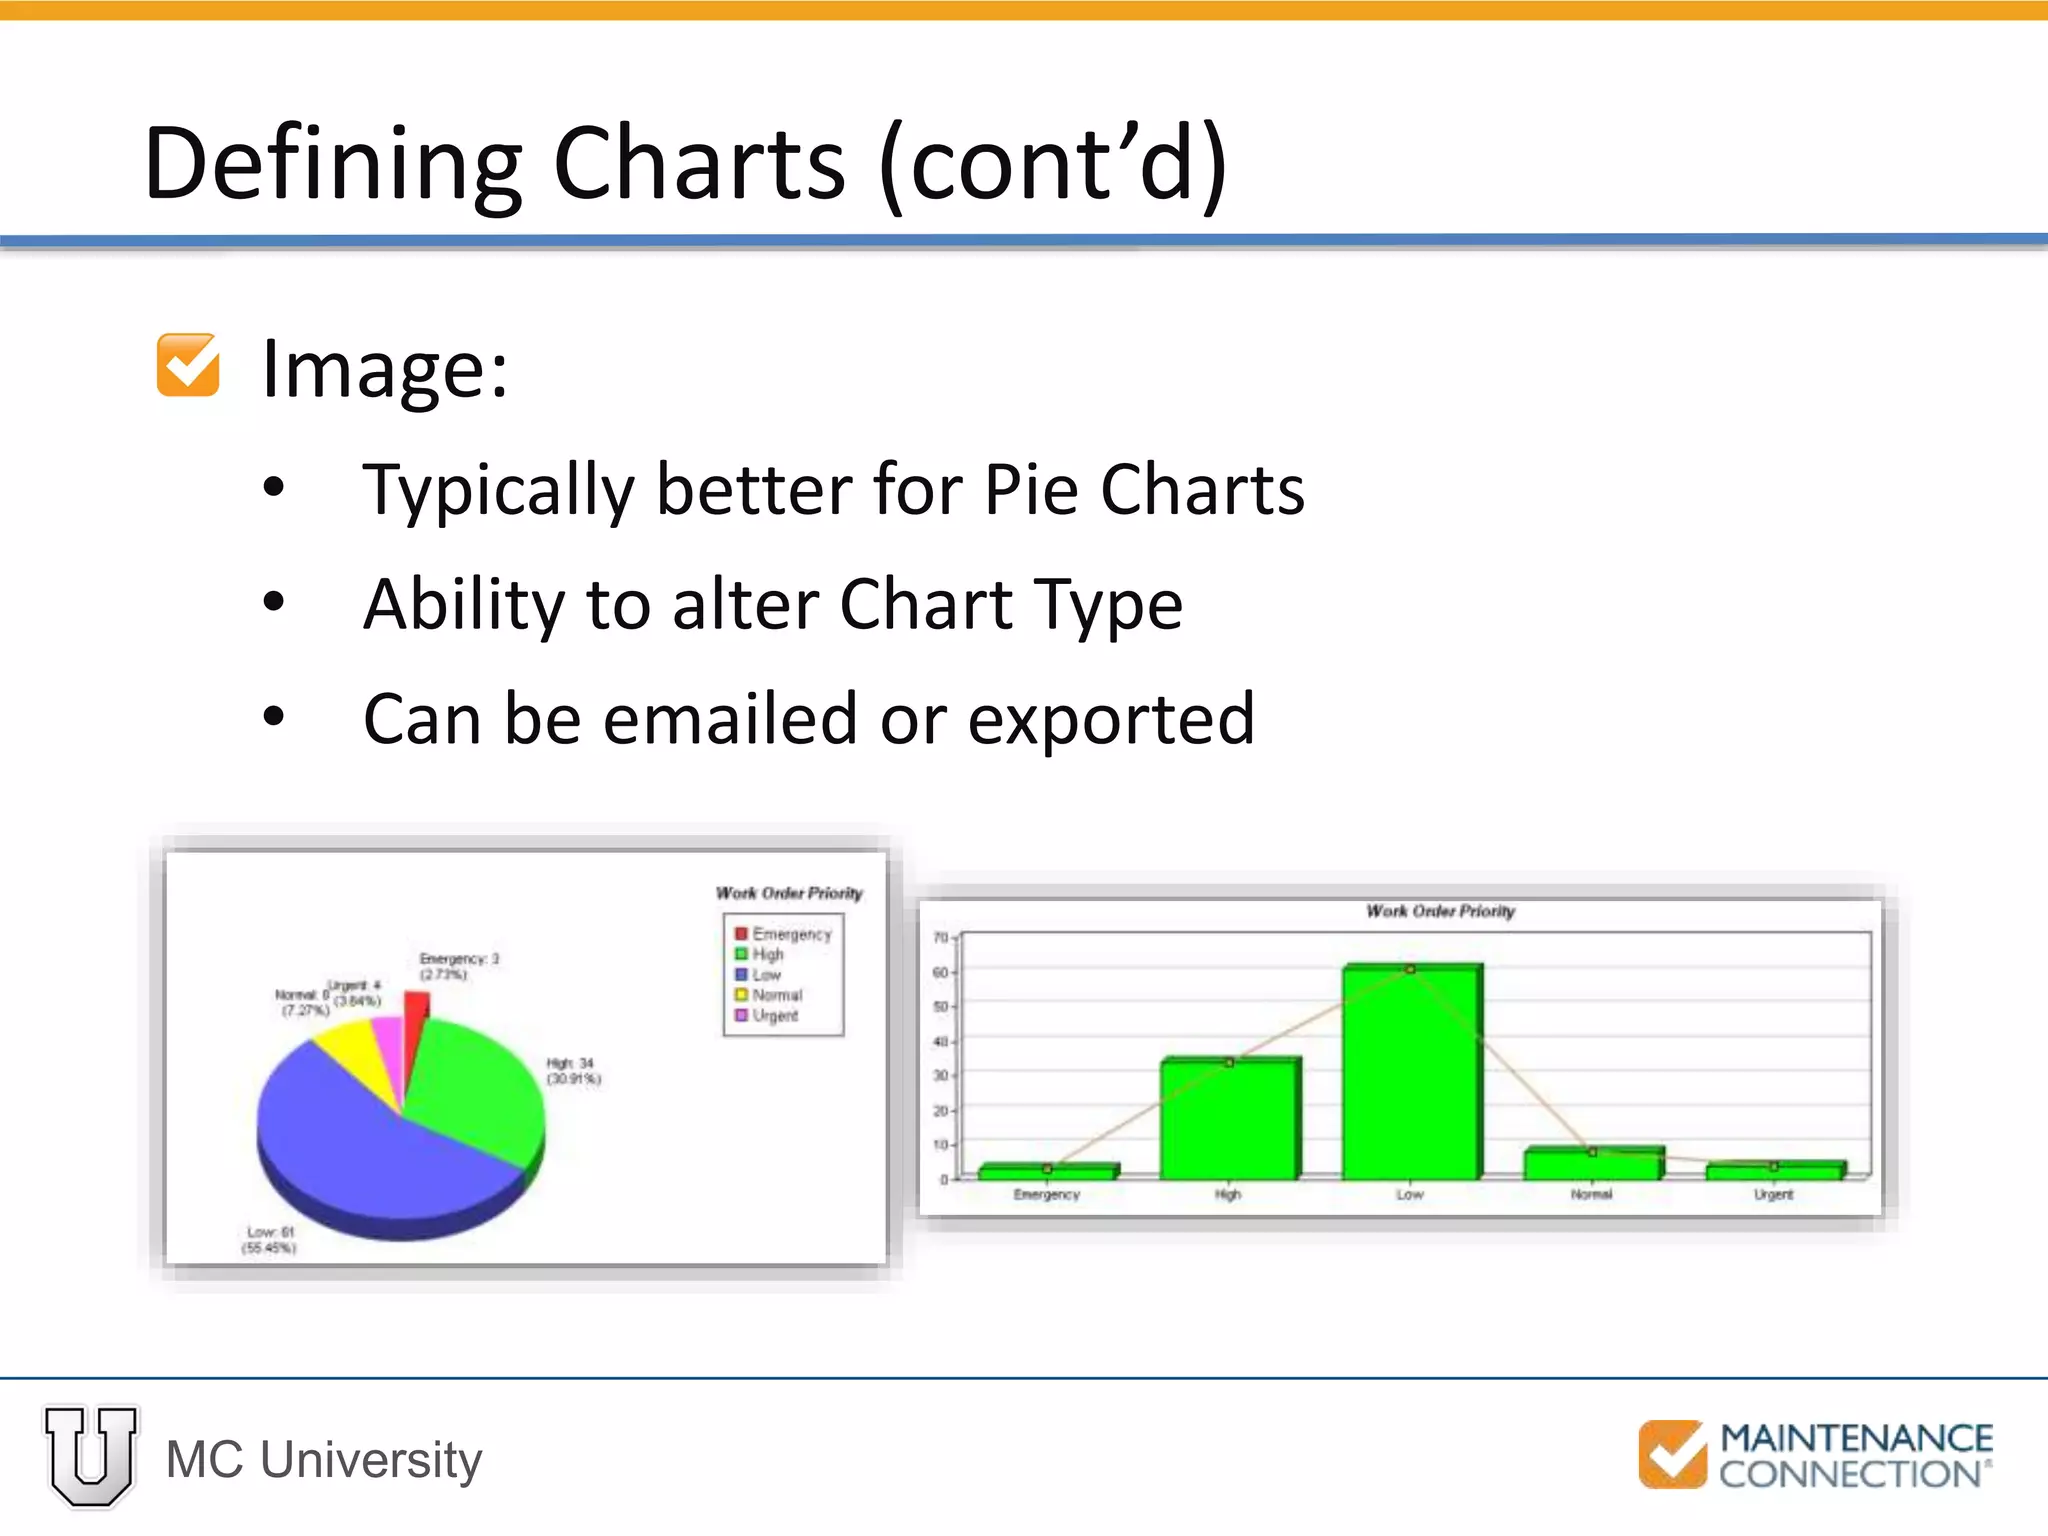
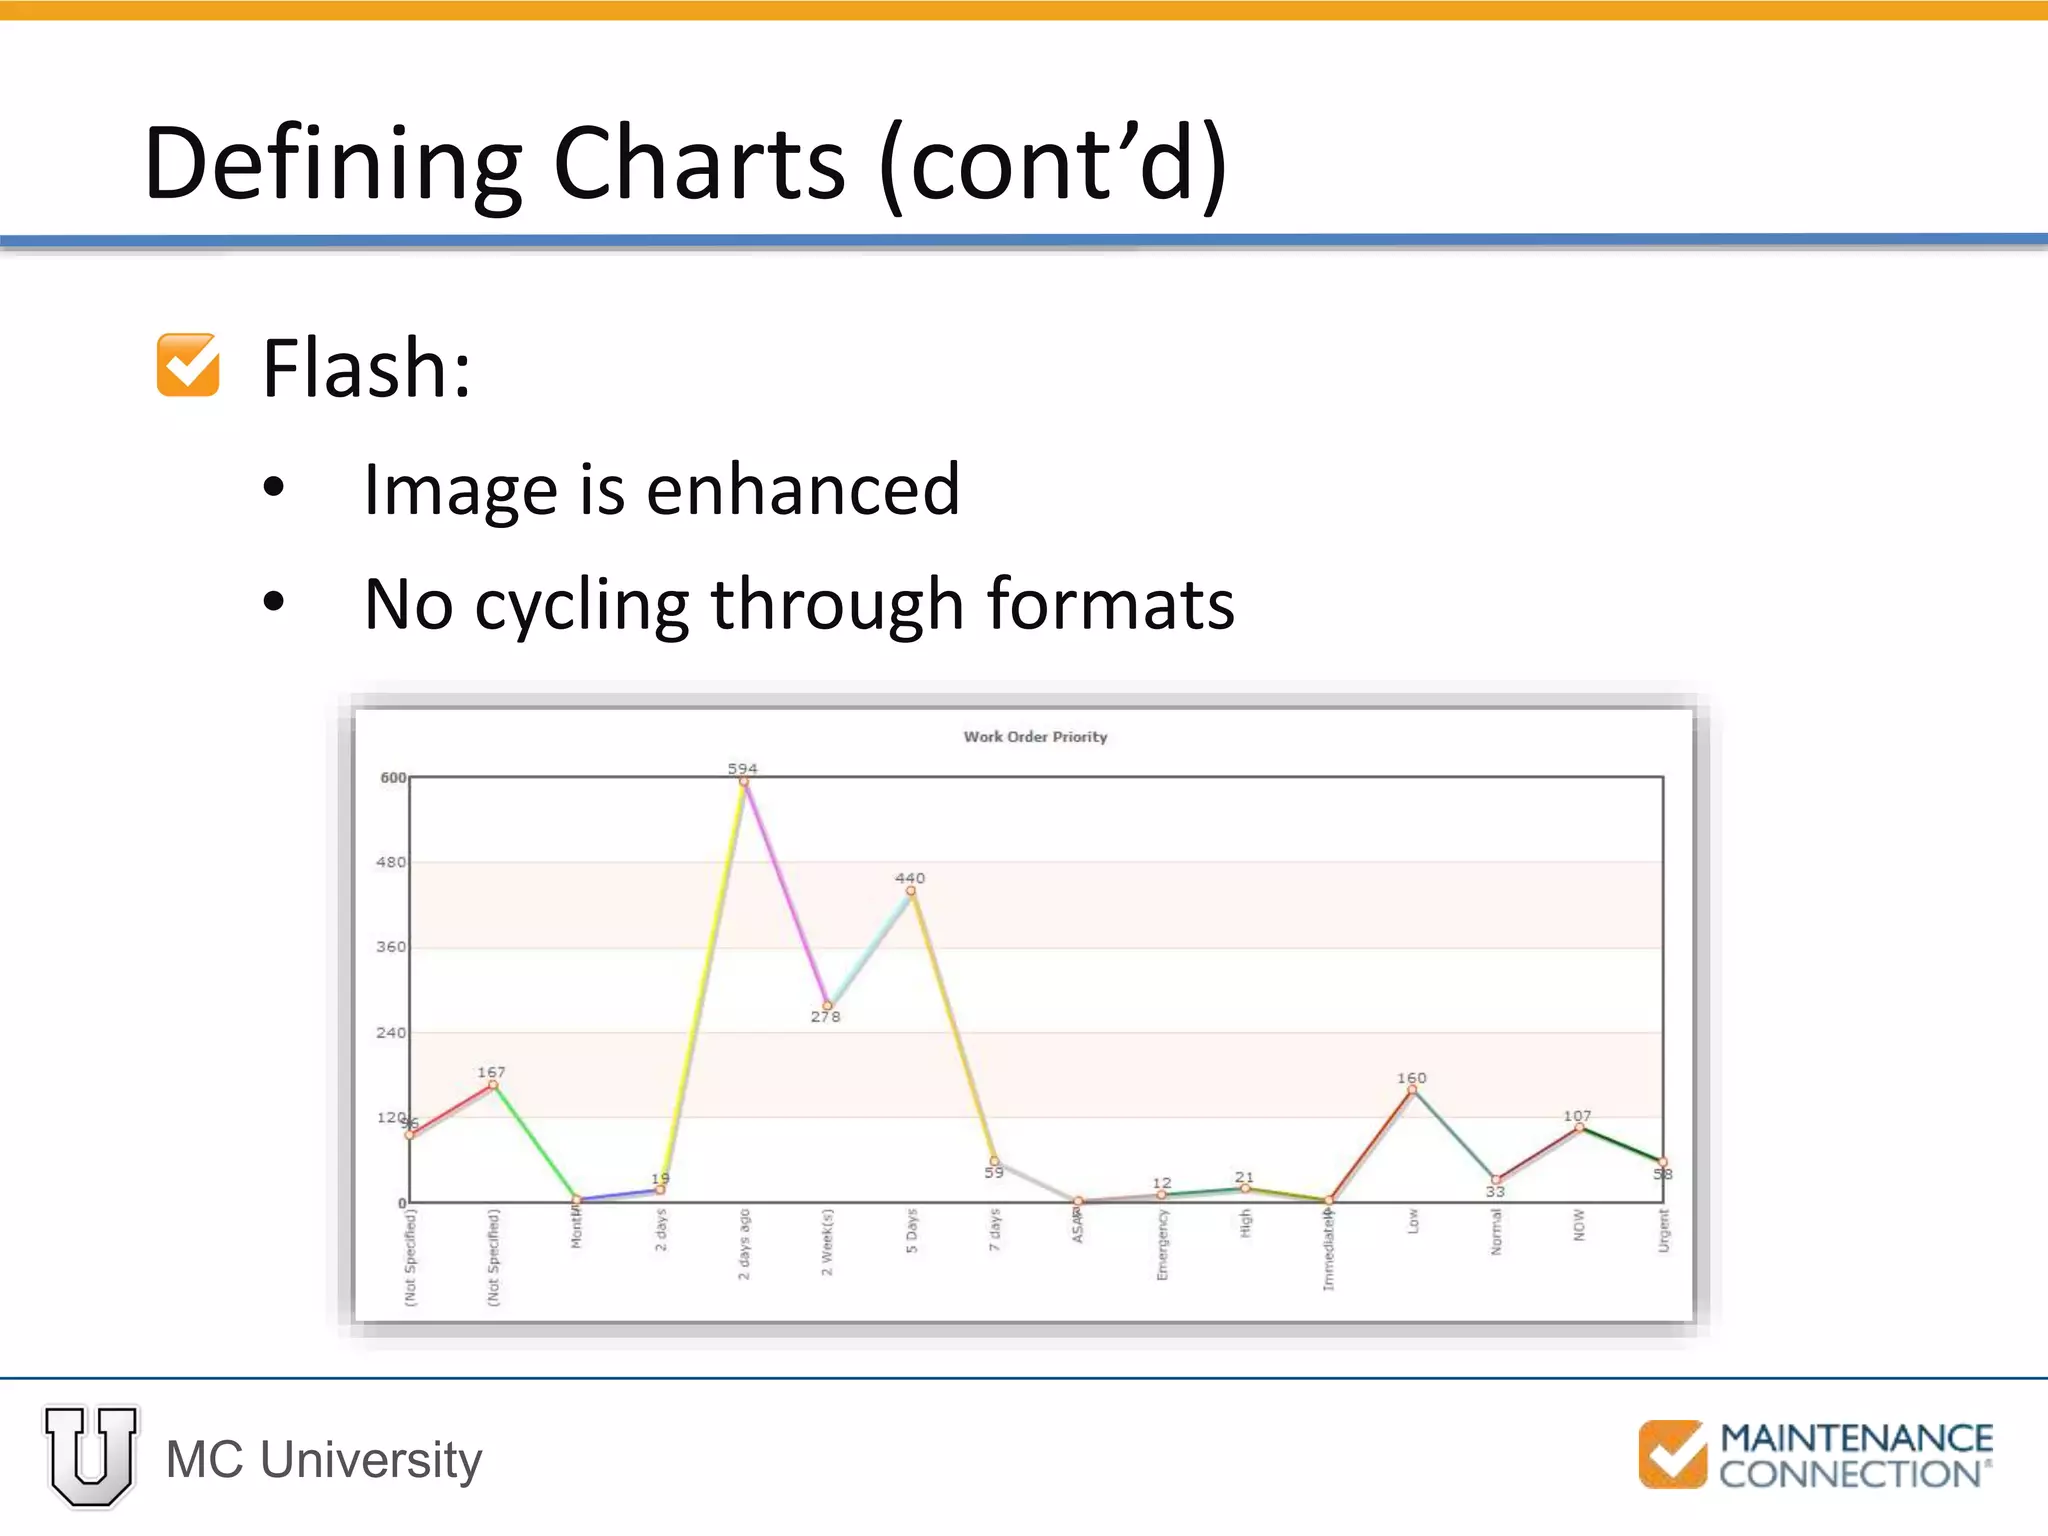
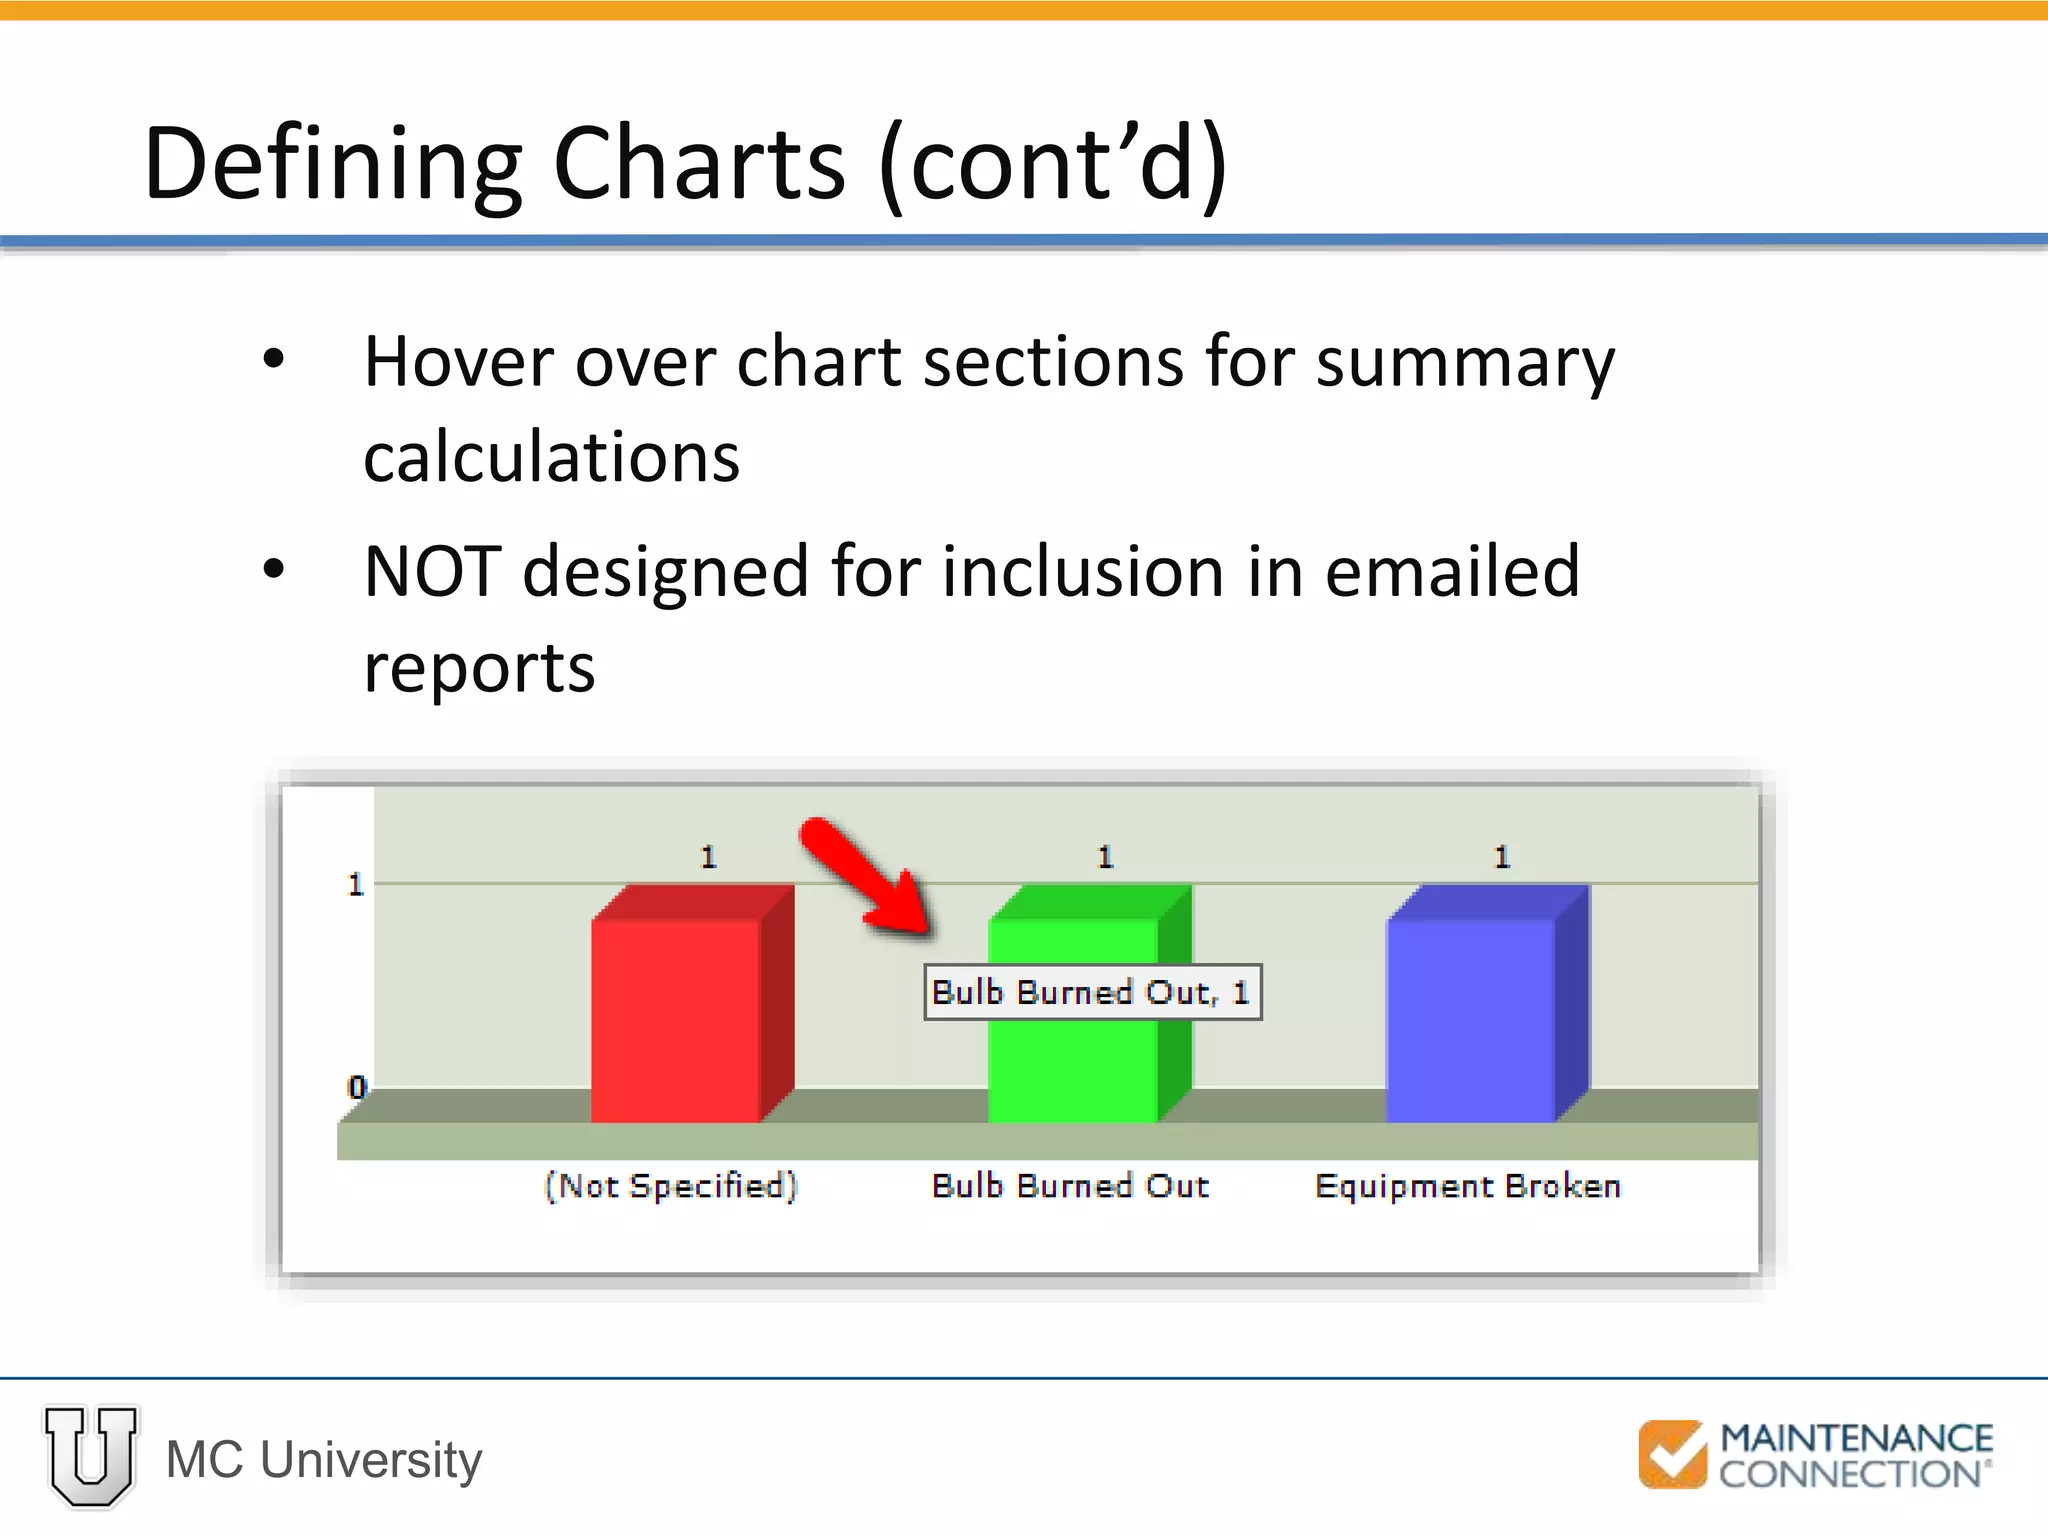
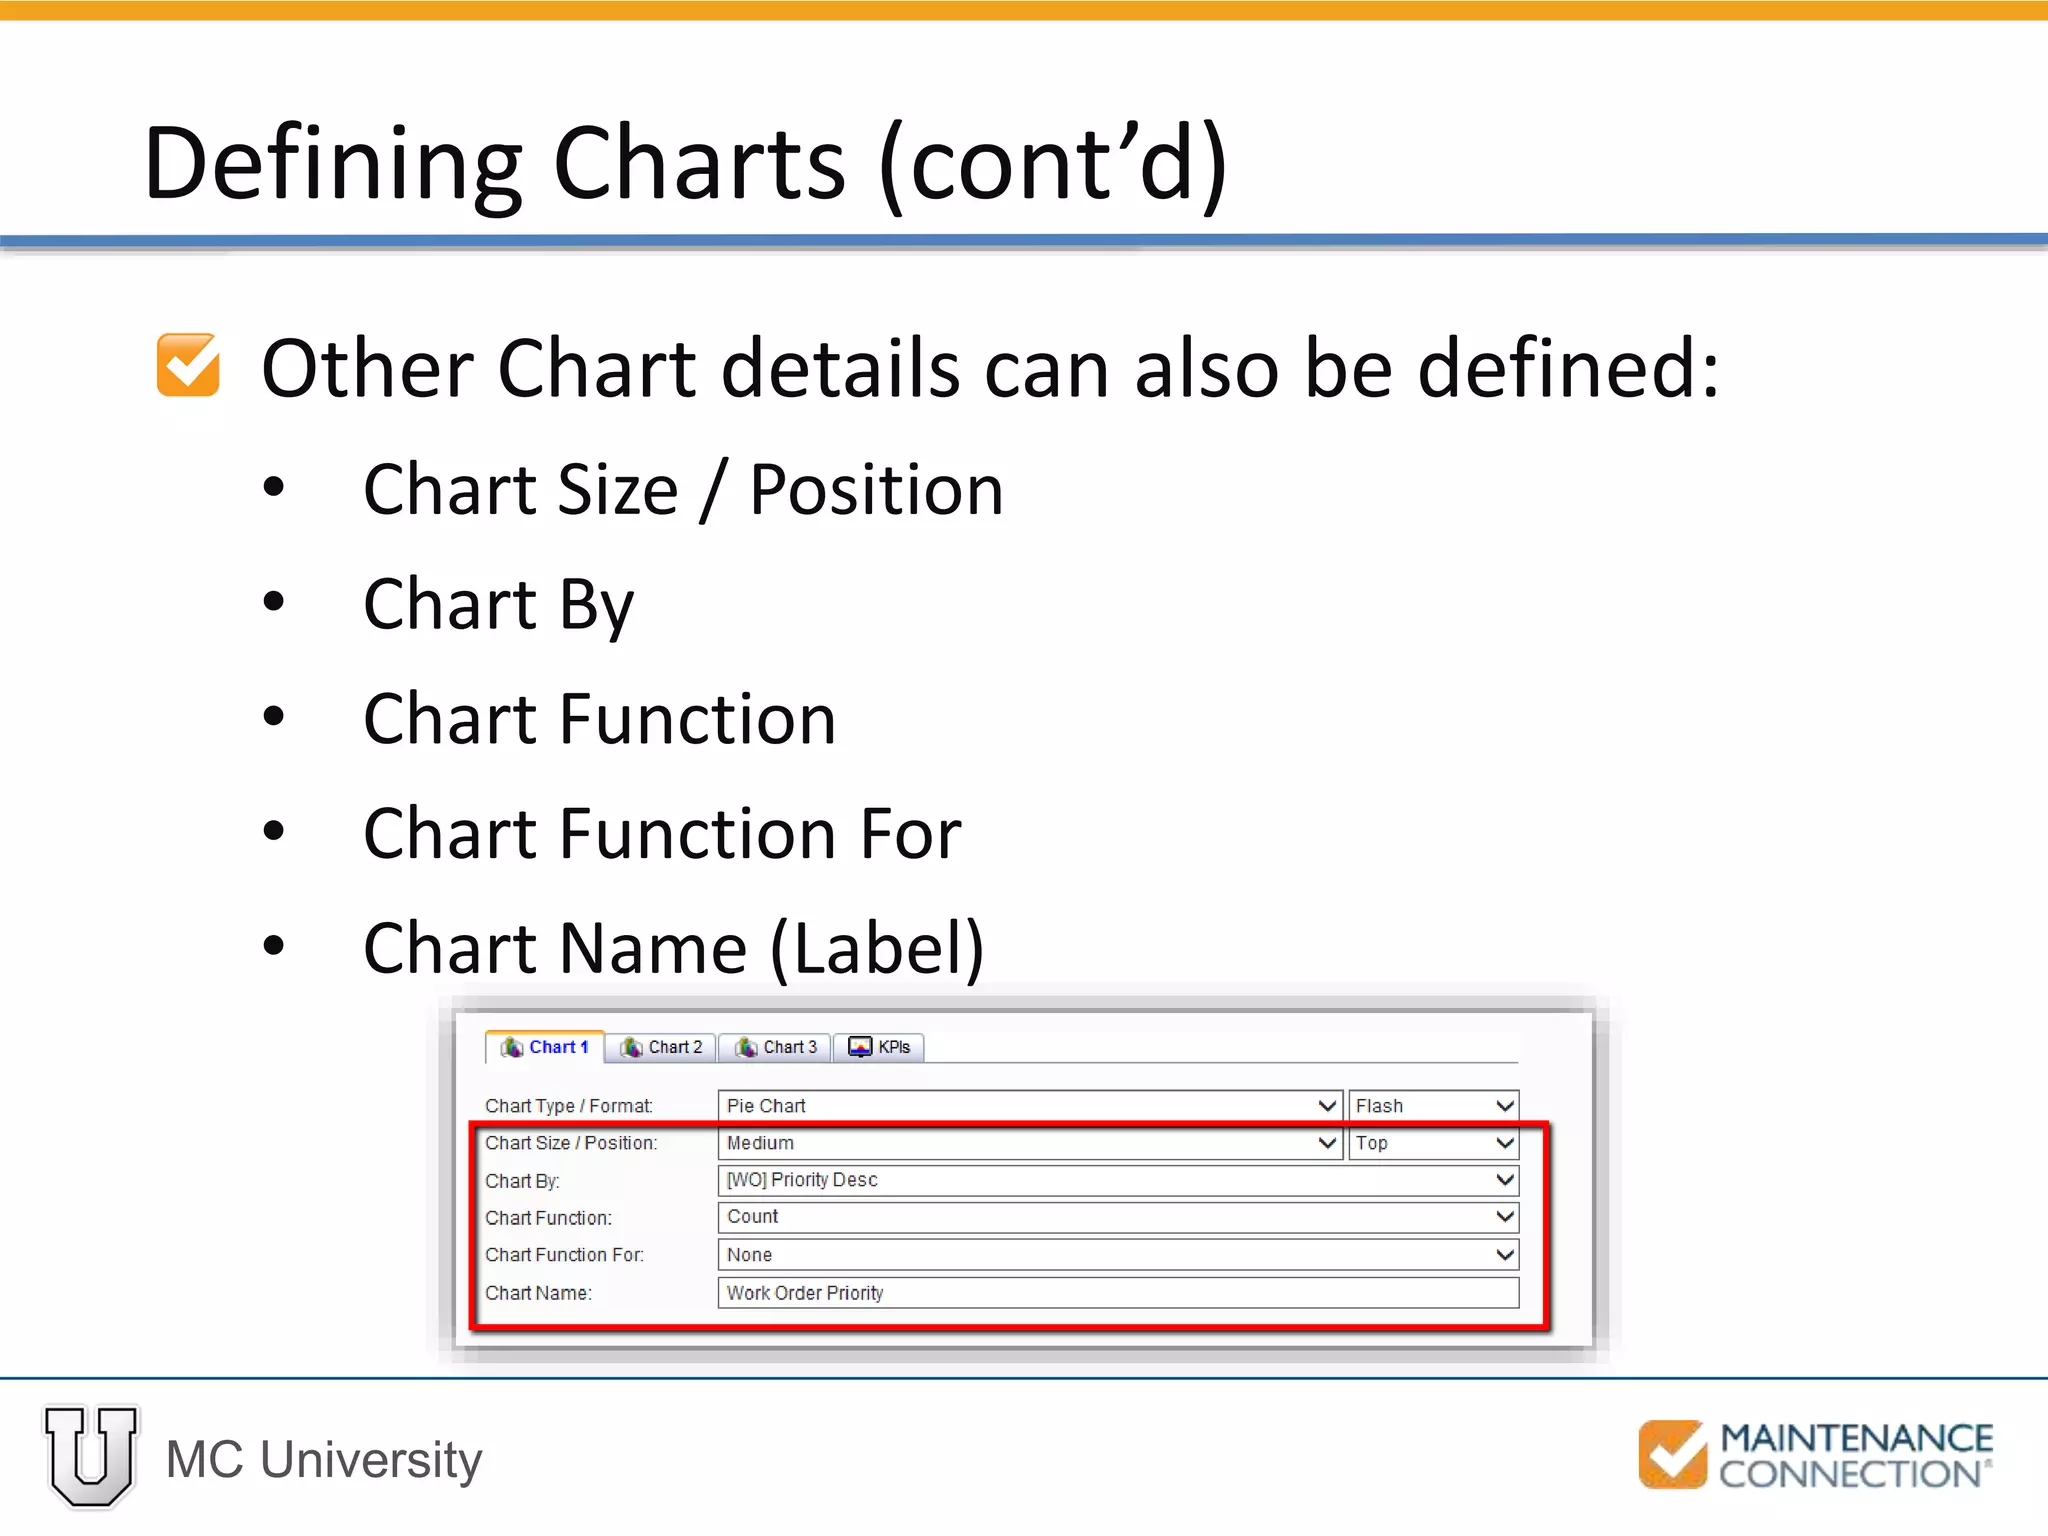


This document provides an overview of using charts in reports. It discusses the different types of charts that can be used, including pie, bar, line and area charts. It explains that charts can be added to reports to visually represent data, enhance reports, summarize listed data and show different aspects of the same data. The document also covers the basics of setting up and formatting charts, such as choosing between image and flash formats.


![[20대연구소]주간뉴스클리핑(20140127 0202)](https://cdn.slidesharecdn.com/ss_thumbnails/20201401270202-140202181516-phpapp02-thumbnail.jpg?width=640&height=640&fit=bounds)


