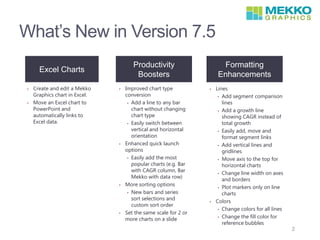
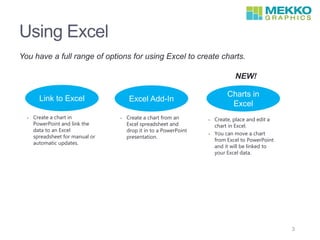
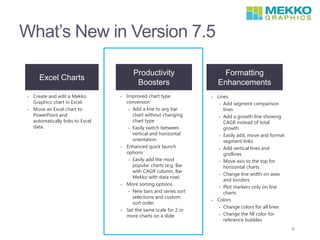
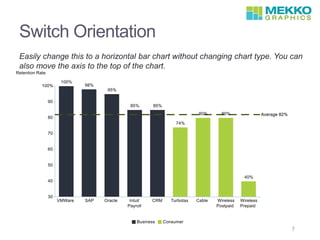
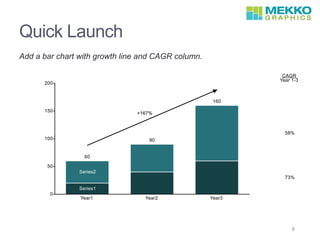
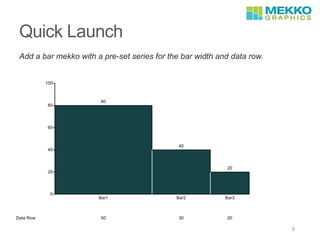
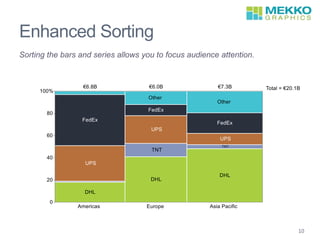
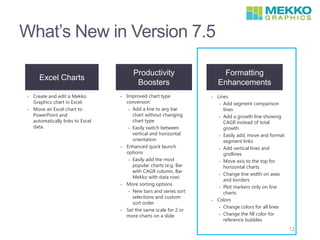
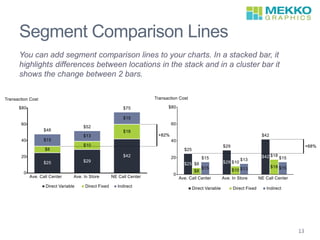
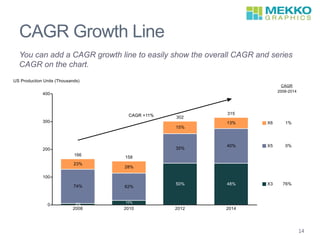
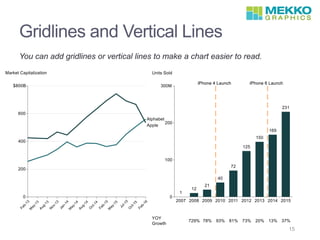
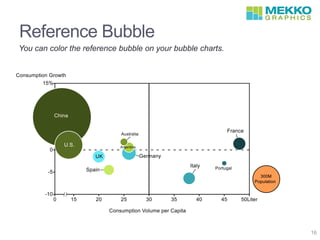
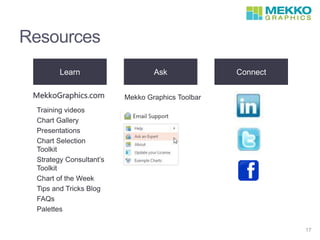
PREVIEW OF MEKKO
GRAPHICS 7.5
David Goldstein
President, Mekko Graphics
What’s New in Version 7.5
Excel Charts
Productivity
Boosters
Formatting
Enhancements
• Create and edit a Mekko
Graphics chart in Excel.
• Move an Excel chart to
PowerPoint and
automatically links to
Excel data.
• Improved chart type
conversion
• Add a line to any bar
chart without changing
chart type
• Easily switch between
vertical and horizontal
orientation
• Enhanced quick launch
options
• Easily add the most
popular charts (e.g. Bar
with CAGR column, Bar
Mekko with data row)
• More sorting options
• New bars and series
sort selections and
custom sort order
• Set the same scale for 2 or
more charts on a slide
• Lines
• Add segment comparison
lines
• Add a growth line
showing CAGR instead of
total growth
• Easily add, move and
format segment links
• Add vertical lines and
gridlines
• Move axis to the top for
horizontal charts
• Change line width on axes
and borders
• Plot markers only on line
charts
• Colors
• Change colors for all lines
• Change the fill color for
reference bubbles
2
Using Excel
You have a full range of options for using Excel to create charts.
Link to Excel
NEW!
• Create a chart in
PowerPoint and link the
data to an Excel
spreadsheet for manual or
automatic updates.
• Create a chart from an
Excel spreadsheet and
drop it in to a PowerPoint
presentation.
• Create, place and edit a
chart in Excel.
• You can move a chart
from Excel to PowerPoint
and it will be linked to
your Excel data.
Excel Add-In
Charts in
Excel
3
Apple Financial Metrics
EPS has grown dramatically, driven by revenue gains rather than profit
improvement.
4
Chart Copied from Excel
5
What’s New in Version 7.5
Excel Charts
Productivity
Boosters
Formatting
Enhancements
• Create and edit a Mekko
Graphics chart in Excel.
• Move an Excel chart to
PowerPoint and
automatically links to Excel
data.
• Improved chart type
conversion
• Add a line to any bar
chart without changing
chart type
• Easily switch between
vertical and horizontal
orientation
• Enhanced quick launch
options
• Easily add the most
popular charts (e.g. Bar
with CAGR column, Bar
Mekko with data row)
• More sorting options
• New bars and series sort
selections and custom
sort order
• Set the same scale for 2 or
more charts on a slide
• Lines
• Add segment comparison
lines
• Add a growth line showing
CAGR instead of total
growth
• Easily add, move and format
segment links
• Add vertical lines and
gridlines
• Move axis to the top for
horizontal charts
• Change line width on axes
and borders
• Plot markers only on line
charts
• Colors
• Change colors for all lines
• Change the fill color for
reference bubbles
6
Switch Orientation
Easily change this to a horizontal bar chart without changing chart type. You can
also move the axis to the top of the chart.
7
Quick Launch
Add a bar chart with growth line and CAGR column.
8
Quick Launch
Add a bar mekko with a pre-set series for the bar width and data row.
9
Enhanced Sorting
Sorting the bars and series allows you to focus audience attention.
10
Scaling Multiple Charts
Use the same axis scale for all charts on the slide.
11
What’s New in Version 7.5
Excel Charts
Productivity
Boosters
Formatting
Enhancements
• Create and edit a Mekko
Graphics chart in Excel.
• Move an Excel chart to
PowerPoint and
automatically links to Excel
data.
• Improved chart type
conversion
• Add a line to any bar
chart without changing
chart type
• Easily switch between
vertical and horizontal
orientation
• Enhanced quick launch
options
• Easily add the most
popular charts (e.g. Bar
with CAGR column, Bar
Mekko with data row)
• More sorting options
• New bars and series sort
selections and custom
sort order
• Set the same scale for 2 or
more charts on a slide
• Lines
• Add segment comparison
lines
• Add a growth line showing
CAGR instead of total
growth
• Easily add, move and format
segment links
• Add vertical lines and
gridlines
• Move axis to the top for
horizontal charts
• Change line width on axes
and borders
• Plot markers only on line
charts
• Colors
• Change colors for all lines
• Change the fill color for
reference bubbles
12
Segment Comparison Lines
You can add segment comparison lines to your charts. In a stacked bar, it
highlights differences between locations in the stack and in a cluster bar it
shows the change between 2 bars.
13
CAGR Growth Line
You can add a CAGR growth line to easily show the overall CAGR and series
CAGR on the chart.
`
14
Gridlines and Vertical Lines
You can add gridlines or vertical lines to make a chart easier to read.
15
Reference Bubble
16
You can color the reference bubble on your bubble charts.
Resources
17
Learn Ask Connect
Training videos
Chart Gallery
Presentations
Chart Selection
Toolkit
Strategy Consultant’s
Toolkit
Chart of the Week
Tips and Tricks Blog
FAQs
Palettes
Mekko Graphics ToolbarMekkoGraphics.com

Mekko Graphics Webinar New Features v7.5

  • 1.
    PREVIEW OF MEKKO GRAPHICS7.5 David Goldstein President, Mekko Graphics
  • 2.
    What’s New inVersion 7.5 Excel Charts Productivity Boosters Formatting Enhancements • Create and edit a Mekko Graphics chart in Excel. • Move an Excel chart to PowerPoint and automatically links to Excel data. • Improved chart type conversion • Add a line to any bar chart without changing chart type • Easily switch between vertical and horizontal orientation • Enhanced quick launch options • Easily add the most popular charts (e.g. Bar with CAGR column, Bar Mekko with data row) • More sorting options • New bars and series sort selections and custom sort order • Set the same scale for 2 or more charts on a slide • Lines • Add segment comparison lines • Add a growth line showing CAGR instead of total growth • Easily add, move and format segment links • Add vertical lines and gridlines • Move axis to the top for horizontal charts • Change line width on axes and borders • Plot markers only on line charts • Colors • Change colors for all lines • Change the fill color for reference bubbles 2
  • 3.
    Using Excel You havea full range of options for using Excel to create charts. Link to Excel NEW! • Create a chart in PowerPoint and link the data to an Excel spreadsheet for manual or automatic updates. • Create a chart from an Excel spreadsheet and drop it in to a PowerPoint presentation. • Create, place and edit a chart in Excel. • You can move a chart from Excel to PowerPoint and it will be linked to your Excel data. Excel Add-In Charts in Excel 3
  • 4.
    Apple Financial Metrics EPShas grown dramatically, driven by revenue gains rather than profit improvement. 4
  • 5.
  • 6.
    What’s New inVersion 7.5 Excel Charts Productivity Boosters Formatting Enhancements • Create and edit a Mekko Graphics chart in Excel. • Move an Excel chart to PowerPoint and automatically links to Excel data. • Improved chart type conversion • Add a line to any bar chart without changing chart type • Easily switch between vertical and horizontal orientation • Enhanced quick launch options • Easily add the most popular charts (e.g. Bar with CAGR column, Bar Mekko with data row) • More sorting options • New bars and series sort selections and custom sort order • Set the same scale for 2 or more charts on a slide • Lines • Add segment comparison lines • Add a growth line showing CAGR instead of total growth • Easily add, move and format segment links • Add vertical lines and gridlines • Move axis to the top for horizontal charts • Change line width on axes and borders • Plot markers only on line charts • Colors • Change colors for all lines • Change the fill color for reference bubbles 6
  • 7.
    Switch Orientation Easily changethis to a horizontal bar chart without changing chart type. You can also move the axis to the top of the chart. 7
  • 8.
    Quick Launch Add abar chart with growth line and CAGR column. 8
  • 9.
    Quick Launch Add abar mekko with a pre-set series for the bar width and data row. 9
  • 10.
    Enhanced Sorting Sorting thebars and series allows you to focus audience attention. 10
  • 11.
    Scaling Multiple Charts Usethe same axis scale for all charts on the slide. 11
  • 12.
    What’s New inVersion 7.5 Excel Charts Productivity Boosters Formatting Enhancements • Create and edit a Mekko Graphics chart in Excel. • Move an Excel chart to PowerPoint and automatically links to Excel data. • Improved chart type conversion • Add a line to any bar chart without changing chart type • Easily switch between vertical and horizontal orientation • Enhanced quick launch options • Easily add the most popular charts (e.g. Bar with CAGR column, Bar Mekko with data row) • More sorting options • New bars and series sort selections and custom sort order • Set the same scale for 2 or more charts on a slide • Lines • Add segment comparison lines • Add a growth line showing CAGR instead of total growth • Easily add, move and format segment links • Add vertical lines and gridlines • Move axis to the top for horizontal charts • Change line width on axes and borders • Plot markers only on line charts • Colors • Change colors for all lines • Change the fill color for reference bubbles 12
  • 13.
    Segment Comparison Lines Youcan add segment comparison lines to your charts. In a stacked bar, it highlights differences between locations in the stack and in a cluster bar it shows the change between 2 bars. 13
  • 14.
    CAGR Growth Line Youcan add a CAGR growth line to easily show the overall CAGR and series CAGR on the chart. ` 14
  • 15.
    Gridlines and VerticalLines You can add gridlines or vertical lines to make a chart easier to read. 15
  • 16.
    Reference Bubble 16 You cancolor the reference bubble on your bubble charts.
  • 17.
    Resources 17 Learn Ask Connect Trainingvideos Chart Gallery Presentations Chart Selection Toolkit Strategy Consultant’s Toolkit Chart of the Week Tips and Tricks Blog FAQs Palettes Mekko Graphics ToolbarMekkoGraphics.com