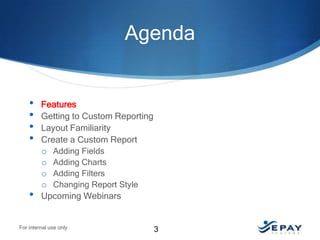
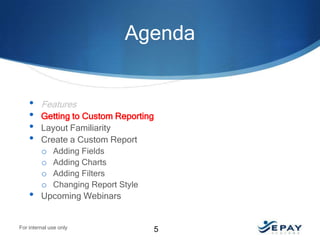
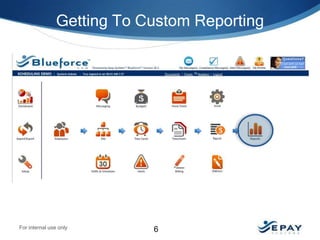
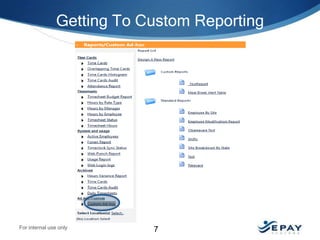
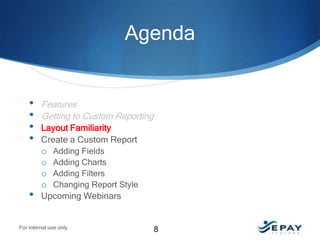
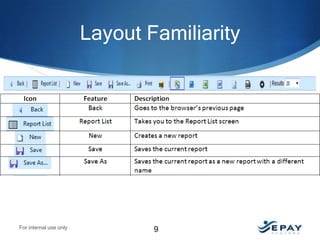
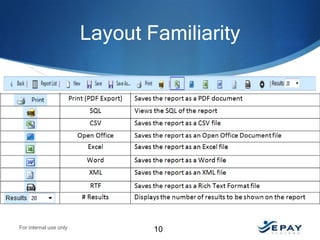
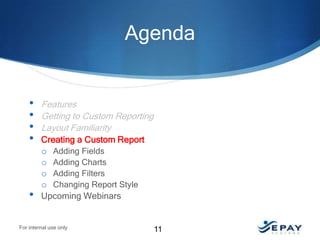
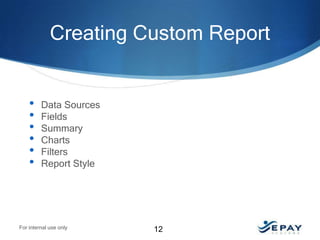
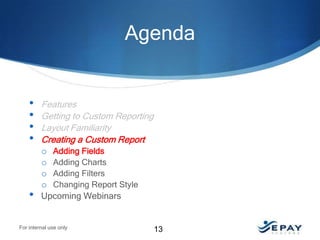
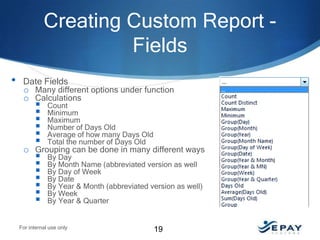
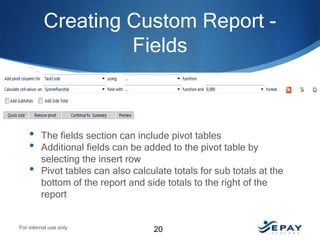
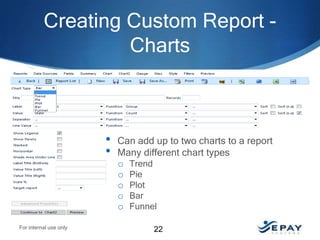
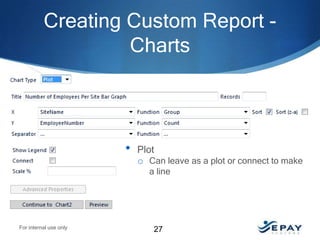
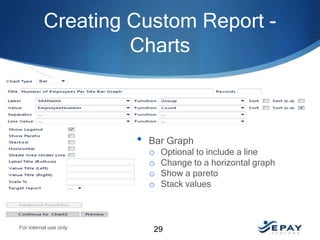
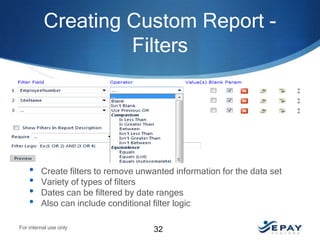
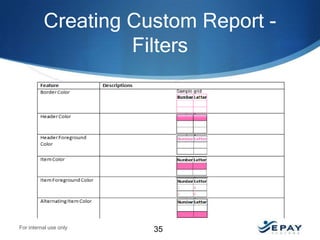
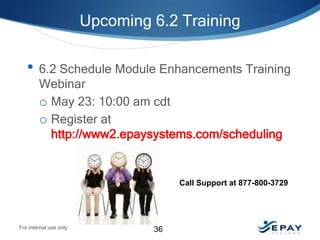
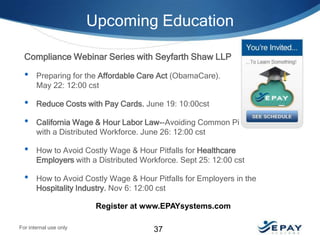
This document provides an overview and agenda for a custom reporting training. It describes how to create custom reports by adding fields, charts, filters, and customizing styles. Administrators can create and save custom reports with various export options. Upcoming webinars on new features and compliance topics are also advertised.
The document discusses how automated zone design has been used by the Office for National Statistics in England and Wales to create various census zones, including Output Areas, Lower Layer Super Output Areas, and Workplace Zones for the 2001 and 2011 censuses. The zone design process involves building zones from underlying synthetic postcode polygons while aiming to meet thresholds for population and household sizes and controlling for zone homogeneity and shape. Users need to understand how the zone design may impact analysis using these small area census units.
TIme and Attendance for Employers with a Distributed WorkforceEPAY Systems
EPAY Systems provides a time and labor management system that keeps employers in control and in compliance with labor laws and union rules, while reducing labor costs by up to 5% or more. Our uniquely flexible, web-based Blueforce system can adapt to the most complex, distributed labor environments.
Here’s how EPAY's SaaS based solution can help:
• Minimize payroll workload and errors; prevent buddy punching.
• Speed up payroll preparation with automated time-keeping processes for all sites
• Track labor hours to proper cost-centers automatically
• Reduce overtime pay, alerting you in real time before workers hit OT.
• Keep customers happy. If a worker is tardy or absent, send real time alerts to your cellphone, so you can get another employee onsite ASAP.
• Keep you in compliance by tracking labor laws and union contract rules.
• Eliminate paycheck printing and distribution costs. You can print paystubs and attendance reports directly from our biometric clock.
• Integrate seamlessly to any payroll application
• Low cost of ownership from the get-go. No maintenance and upgrade fees.
An EPAY time and attendance solution can be up and running in no time at all since there is no software or servers to install. EPAY coordinates installation and training—there’s no heavy lifting by our client’s staff.
Specialties
Time and Labor Management System, Mobile Time Tracking, Time and Attendance SaaS, Biometric Time Clocks with Messaging and Printing Capabilities, Time and Attendance for Distributed Labor, Green Solutions, Time and Labor Regulatory Compliance Support
Learn how to manage scheduling with EPAY Systems scheduling training. Discover how to create schedules, assign employees, define scheduling slots as well as:
-Publish Schedules
-Budget for Schedules
-Block Out-of-Schedule Punches
-Use Stations
This document summarizes new features being released in the Blueforce v6.2 software from EPAY Systems. The new features include custom reporting, meal break compliance monitoring, improved scheduling capabilities, and compatibility with Firefox. The document provides details on each new feature and announces upcoming webinar training sessions to demonstrate the new custom reporting and scheduling features.
The document summarizes John Ward's presentation on report development using BIRT (Business Intelligence and Reporting Tools) at the 6th Annual EclipseCon. It includes an agenda that covers an introduction to BIRT, building reports, working with data and charts, report formatting, and event handling. It also discusses reuse of components through templates and libraries, deployment of reports, and extensions to BIRT's functionality.
This document discusses how to create and format reports in Microsoft Access. It covers using the Report Wizard to generate a basic report, using Report Layout View to modify the report design, applying grouping and sorting, adding subtotals and counts, resizing and aligning controls, formatting the overall report, and generating mailing labels from the database information. The objectives are to learn how to generate, design, and style reports to display and print out database content.
The document provides guidance on using data visualization and storytelling techniques in Power BI. It discusses best practices such as focusing visuals to spark the viewer's memory, using shapes and highlights to draw attention, and structuring data and reports to clearly convey a story. The document also demonstrates features like bookmarks, filters, and formatting to help interactive navigation and presentation.
This document provides an overview of creating and formatting reports in Microsoft Access 2010. It discusses using the Report Wizard to create a basic report, using Report Layout View to modify the report design, applying grouping and sorting, adding subtotals and counts, resizing and aligning controls, formatting reports for readability, and generating mailing labels from database records.
The document summarizes new features and enhancements in Microsoft Dynamics NAV 2009 SP1. Key updates include improvements to page and report designers to increase partner and customer productivity, redesigned matrix pages, enhanced data entry features like filter as you type, improved navigation and filtering on reports, and various quality and compliance improvements like a 1:1 VAT relationship with the general ledger. The release also provides server and performance optimizations.
This document provides an overview of Business Objects and related tools for business intelligence and reporting. It covers topics like universe design in Business Objects, different report types that can be created in Desktop Intelligence and Web Intelligence, dashboard creation, integration with SAP, and use of related tools like Crystal Reports and Xcelcius. The document outlines concepts, features, and steps for working with each tool.
The document describes various ways to modify and enhance visualizations in SAP Lumira, including:
1) Sorting, filtering, ranking, and calculating measures and attributes in an existing column chart visualization.
2) Creating a "trellis effect" by dragging an attribute to the trellis section to show each value in a separate chart.
3) Changing global chart formatting preferences like color palette, template, and font size.
This document provides guidance on using PowerPoint to design effective presentations. It discusses how to select a presentation option, create slides, organize text, images, and effects, and balance design elements. The key points are:
- PowerPoint allows blank presentations for full customization or templates for guided design.
- Slides should be kept simple with short bullet points reinforcing the speech.
- Consistent formatting, readable fonts, and complimentary colors improve visuals.
- Animation and media should emphasize important points without distracting from the content.
- Effective slides balance different elements so no one part overpowers the others.
Crystal tr///SAP Design Studio online training by design studio Export-24/7//...venkat training
///SAP Design Studio online training by design studio Export-24/7//
venkat
Contact numbers : +91 9972971235,+91-9663233300(India)
Email Id : Madhukar.dwbi@gmail.com, https://www.youtube.com/watch?v=KK6DxwhYxAI&t=23s
Website:
http://www.sap-bo-online-training.com/
This document discusses how to create and review financial statements using Financial Statement Generator (FSG) and Accounting Desktop Integration (ADI) in Oracle. It provides an overview of the key components used to define financial statements like row sets, column sets, row orders, content sets and reports. It also explains how to generate and analyze financial statement output in different formats.
The document provides an overview of reporting and analytics capabilities in Sprinklr. It describes navigating between standard dashboards, setting filters and date ranges, and customizing dashboards. Standard dashboards track metrics like campaigns, social engagement, inbound/outbound tags, and service level agreements. Custom dashboards can be created and shared with other users. The document contains step-by-step instructions for using various reporting features in Sprinklr.
This document provides an overview of reporting and analytics capabilities in Sprinklr. It describes navigating between standard dashboards, customizing dashboards with filters and date ranges, and creating custom dashboards and widgets. Standard dashboards track metrics like campaigns, social engagement, inbound/outbound tags, and SLAs. Custom dashboards allow cloning, editing, deleting, and sharing of custom widget configurations and visualizations.
This document discusses how to enrich data in SAP Lumira by managing measures, creating time and geographic hierarchies, and other options like calculated fields. Specifically, it covers automatically converting numeric columns to measures, promoting attributes to measures, modifying aggregation methods, creating a time hierarchy to visualize sales revenue by year and quarter, creating a geographic hierarchy to map locations to country and city levels for pie charts of sales by country and city, and defining calculated measures or attributes.
This session will show some useful data visualisation tips and how they can be used in Oracle Business Intelligence and Data Visualization Cloud Services
LG Inform Plus Learning Day Training SessionLG Inform Plus
A pre-recorded series of screen image dumps simulating the interactive training day on the LG Inform Plus information management system used in Local Government
The document discusses different types of visual interactions in Power BI reports: Highlight, Filter, and None. It explains how each interaction type affects cross-filtering and data shown in visuals. It also covers setting different interaction types for individual visuals and how that impacts cross-filtering. Examples are provided to illustrate the behavior of each interaction type.
Tableau - Learning Objectives for Data, Graphs, Filters, Dashboards and Advan...Srinath Reddy
Step-1 Tableau Introduction
Step-2 Connecting to Data
Step-3 Building basic views
Step-4 Data manipulations and Calculated fields
Step-5 Tableau Dashboards
Step-6 Advanced Data Options
Step-7 Advanced graph Options
This document discusses developing effective reports in Microsoft Access 2013. It covers creating basic reports using the report button and report wizard. More advanced topics include modifying reports in design view, adding grouping and sorting, conditional formatting, and including subreports and charts in reports. The goal is to organize and format data into informative printed reports for analysis and decision making.
This document discusses how to create and format trendlines, PivotTable reports, and PivotChart reports in Microsoft Excel 2013. It provides step-by-step instructions for adding trendlines to line charts, creating and filtering PivotTables, changing PivotTable layouts and views, formatting PivotTables, creating PivotCharts from PivotTables, and using slicers to filter PivotTable and PivotChart reports. The objectives are to analyze data using trendlines, PivotTables, and PivotCharts and to create interactive reports using slicers.
Flexible reporting tools (Report Designer, Find Variables, Check Report)
Learn more about our chromatography data system Chromeleon: http://www.thermoscientific.com/en/about-us/general-landing-page/chromeleon-resource-center.html?ca=chromeleon
1. Spil Games uses a bottoms-up monthly forecasting process where ARIMA models in R are used to generate initial traffic forecasts for 500 markets/channels which are then loaded into Tableau for exploratory analysis and adjustment.
2. Key business users explore and modify the forecasts in Tableau before the adjusted forecast is loaded back into the data warehouse.
3. Forecasting considers factors like seasonality, known events, and regressors to predict metrics like traffic, gameplays, pageviews, and advertising across markets/channels on a monthly basis.
A cross tab report displays data in a spreadsheet format using rows and columns, with each cell containing calculated results of the data. It is useful for viewing summaries. A cross tab report requires specifying row keys to group rows and column keys to specify tabulated columns. The cross tab builder in Actuate allows creating these reports by inserting a cross tab control, choosing keys, specifying cell calculations, and customizing appearance.
Paradigm Shift - Reengineering Your Workforce for the COVID-19 Era and BeyondEPAY Systems
This document summarizes an executive roundtable discussion hosted by EPAY Systems on reengineering workforces for the COVID-19 era. It includes an introduction of the speakers and panelists from various companies. Survey results are presented on the impacts of COVID-19 on sales, headcount, labor costs, and strategies to bring employees back to work. The panel discusses strategies around controlling costs, workforce productivity, business risks, and ensuring business continuity. Participants are polled on technology helping with productivity and interest in a new HCM solution.
How to Implement & Leverage Workforce Analytics and Drive Labor Costs DownEPAY Systems
Workforce analytics can help identify and resolve costly issues such as time theft, payroll correcting, and low workforce productivity at various levels within your operations.
Join EPAY Systems and Workforce Analytics expert, Anthony Lackey, to learn how analytics can help your business:
- Time Collection Issues: Symptoms, Causes, and Consequences
- The ROI of Improving Time Collection Issues
- How to Achieve Real-Time Labor Control
- Preview of EPAY Analytics
More Related Content
Similar to Custom Reporting Trainging with Bluforce
The document summarizes new features and enhancements in Microsoft Dynamics NAV 2009 SP1. Key updates include improvements to page and report designers to increase partner and customer productivity, redesigned matrix pages, enhanced data entry features like filter as you type, improved navigation and filtering on reports, and various quality and compliance improvements like a 1:1 VAT relationship with the general ledger. The release also provides server and performance optimizations.
This document provides an overview of Business Objects and related tools for business intelligence and reporting. It covers topics like universe design in Business Objects, different report types that can be created in Desktop Intelligence and Web Intelligence, dashboard creation, integration with SAP, and use of related tools like Crystal Reports and Xcelcius. The document outlines concepts, features, and steps for working with each tool.
The document describes various ways to modify and enhance visualizations in SAP Lumira, including:
1) Sorting, filtering, ranking, and calculating measures and attributes in an existing column chart visualization.
2) Creating a "trellis effect" by dragging an attribute to the trellis section to show each value in a separate chart.
3) Changing global chart formatting preferences like color palette, template, and font size.
This document provides guidance on using PowerPoint to design effective presentations. It discusses how to select a presentation option, create slides, organize text, images, and effects, and balance design elements. The key points are:
- PowerPoint allows blank presentations for full customization or templates for guided design.
- Slides should be kept simple with short bullet points reinforcing the speech.
- Consistent formatting, readable fonts, and complimentary colors improve visuals.
- Animation and media should emphasize important points without distracting from the content.
- Effective slides balance different elements so no one part overpowers the others.
Crystal tr///SAP Design Studio online training by design studio Export-24/7//...venkat training
///SAP Design Studio online training by design studio Export-24/7//
venkat
Contact numbers : +91 9972971235,+91-9663233300(India)
Email Id : Madhukar.dwbi@gmail.com, https://www.youtube.com/watch?v=KK6DxwhYxAI&t=23s
Website:
http://www.sap-bo-online-training.com/
This document discusses how to create and review financial statements using Financial Statement Generator (FSG) and Accounting Desktop Integration (ADI) in Oracle. It provides an overview of the key components used to define financial statements like row sets, column sets, row orders, content sets and reports. It also explains how to generate and analyze financial statement output in different formats.
The document provides an overview of reporting and analytics capabilities in Sprinklr. It describes navigating between standard dashboards, setting filters and date ranges, and customizing dashboards. Standard dashboards track metrics like campaigns, social engagement, inbound/outbound tags, and service level agreements. Custom dashboards can be created and shared with other users. The document contains step-by-step instructions for using various reporting features in Sprinklr.
This document provides an overview of reporting and analytics capabilities in Sprinklr. It describes navigating between standard dashboards, customizing dashboards with filters and date ranges, and creating custom dashboards and widgets. Standard dashboards track metrics like campaigns, social engagement, inbound/outbound tags, and SLAs. Custom dashboards allow cloning, editing, deleting, and sharing of custom widget configurations and visualizations.
This document discusses how to enrich data in SAP Lumira by managing measures, creating time and geographic hierarchies, and other options like calculated fields. Specifically, it covers automatically converting numeric columns to measures, promoting attributes to measures, modifying aggregation methods, creating a time hierarchy to visualize sales revenue by year and quarter, creating a geographic hierarchy to map locations to country and city levels for pie charts of sales by country and city, and defining calculated measures or attributes.
This session will show some useful data visualisation tips and how they can be used in Oracle Business Intelligence and Data Visualization Cloud Services
LG Inform Plus Learning Day Training SessionLG Inform Plus
A pre-recorded series of screen image dumps simulating the interactive training day on the LG Inform Plus information management system used in Local Government
The document discusses different types of visual interactions in Power BI reports: Highlight, Filter, and None. It explains how each interaction type affects cross-filtering and data shown in visuals. It also covers setting different interaction types for individual visuals and how that impacts cross-filtering. Examples are provided to illustrate the behavior of each interaction type.
Tableau - Learning Objectives for Data, Graphs, Filters, Dashboards and Advan...Srinath Reddy
Step-1 Tableau Introduction
Step-2 Connecting to Data
Step-3 Building basic views
Step-4 Data manipulations and Calculated fields
Step-5 Tableau Dashboards
Step-6 Advanced Data Options
Step-7 Advanced graph Options
This document discusses developing effective reports in Microsoft Access 2013. It covers creating basic reports using the report button and report wizard. More advanced topics include modifying reports in design view, adding grouping and sorting, conditional formatting, and including subreports and charts in reports. The goal is to organize and format data into informative printed reports for analysis and decision making.
This document discusses how to create and format trendlines, PivotTable reports, and PivotChart reports in Microsoft Excel 2013. It provides step-by-step instructions for adding trendlines to line charts, creating and filtering PivotTables, changing PivotTable layouts and views, formatting PivotTables, creating PivotCharts from PivotTables, and using slicers to filter PivotTable and PivotChart reports. The objectives are to analyze data using trendlines, PivotTables, and PivotCharts and to create interactive reports using slicers.
Flexible reporting tools (Report Designer, Find Variables, Check Report)
Learn more about our chromatography data system Chromeleon: http://www.thermoscientific.com/en/about-us/general-landing-page/chromeleon-resource-center.html?ca=chromeleon
1. Spil Games uses a bottoms-up monthly forecasting process where ARIMA models in R are used to generate initial traffic forecasts for 500 markets/channels which are then loaded into Tableau for exploratory analysis and adjustment.
2. Key business users explore and modify the forecasts in Tableau before the adjusted forecast is loaded back into the data warehouse.
3. Forecasting considers factors like seasonality, known events, and regressors to predict metrics like traffic, gameplays, pageviews, and advertising across markets/channels on a monthly basis.
A cross tab report displays data in a spreadsheet format using rows and columns, with each cell containing calculated results of the data. It is useful for viewing summaries. A cross tab report requires specifying row keys to group rows and column keys to specify tabulated columns. The cross tab builder in Actuate allows creating these reports by inserting a cross tab control, choosing keys, specifying cell calculations, and customizing appearance.
Similar to Custom Reporting Trainging with Bluforce (20)
Paradigm Shift - Reengineering Your Workforce for the COVID-19 Era and BeyondEPAY Systems
This document summarizes an executive roundtable discussion hosted by EPAY Systems on reengineering workforces for the COVID-19 era. It includes an introduction of the speakers and panelists from various companies. Survey results are presented on the impacts of COVID-19 on sales, headcount, labor costs, and strategies to bring employees back to work. The panel discusses strategies around controlling costs, workforce productivity, business risks, and ensuring business continuity. Participants are polled on technology helping with productivity and interest in a new HCM solution.
How to Implement & Leverage Workforce Analytics and Drive Labor Costs DownEPAY Systems
Workforce analytics can help identify and resolve costly issues such as time theft, payroll correcting, and low workforce productivity at various levels within your operations.
Join EPAY Systems and Workforce Analytics expert, Anthony Lackey, to learn how analytics can help your business:
- Time Collection Issues: Symptoms, Causes, and Consequences
- The ROI of Improving Time Collection Issues
- How to Achieve Real-Time Labor Control
- Preview of EPAY Analytics
Key Legislative Updates for the Hourly WorkforceEPAY Systems
This document provides an overview and update on key legislative issues impacting hourly workforces, including predictive scheduling and salary history laws. It discusses new laws requiring advance notice of work schedules and banning inquiries into applicants' salary histories. The document outlines recent laws passed in Illinois, Chicago, and other jurisdictions, detailing requirements for employers to provide notice of schedules in advance and prohibiting salary history questions. It concludes with next steps employers should take to ensure compliance with these new regulations.
Strategies to Combat the Labor Shortage: How to Retain Your Workers & Keep Yo...EPAY Systems
In the midst of the escalating labor shortage, retaining a reliable hourly workforce has become increasingly difficult.
Watch this 60-minute webinar to become: your worker’s number one employment option, your client’s most reliable and easy-to-work with partner, and the most efficient business in your market.
Full On-Demand Webinar Available:
http://offers.epaysystems.com/strategies-to-combat-the-labor-shortage-how-to-retain-your-workers-and-keep-your-clients
How to Reduce Scheduling Headaches & Increase ROIEPAY Systems
There’s no shortage of obstacles when it comes to scheduling for the hourly, distributed workforce. For most employers, inconsistent shifts, tight margins, no-shows, and high turnover rates are just the realities of their industry. Luckily, these problems aren’t without solutions.
The right workforce management approach and tools can turn scheduling difficulties into competitive advantages for your business. This presentation includes:
- Introduction to EPAY
- Why You Should Care About Scheduling
- How to Solve Your Scheduling Issues
- Demo of EPAY’s New Scheduling Features
- Q&A Session
Time Theft Take Down: Preventing Time Theft for the Hourly WorkforceEPAY Systems
It’s been estimated that U.S. employers lose more than $400 billion in productivity every year from workforce time theft. However, the rise of powerful biometric and workforce management technology, reporting analytics, and HR policies, has allowed employers to start winning the fight.
Michelle Lanter Smith and a panel of experts representing HR, operations, and technology discuss all things time theft in this 60-min. presentation, including:
- Time theft overview: forms, costs, and why it matters
- How to identify and address time theft
- Solutions for time theft
- Pros of Biometric Technology
- Live audience Q&A
Link to live webinar recording: http://offers.epaysystems.com/recorded-webinar-time-theft-take-down
How to Maintain Biometric Privacy & Avoid Liability With ConfidenceEPAY Systems
Do you or your company vendors use employee fingerprints and facial scans, or other private biometric information for systems access, property security, or record-keeping? Are you certain you are doing so correctly?
Biometric information privacy violations have launched hundreds of costly class actions against unsuspecting employers. Don’t get caught up in the storm!
This 60-min. presentation discussed:
• Biometrics and what biometric information privacy entails
• Compliance requirements for employers’ collection, use, and retention of employee biometric data
• Exploring legal and internal HR policies related to biometric information
• Examples of labor cost reductions, improved productivity, and compliance safeguards with biometric analytics
Enjoy!
Workforce Reporting: Utilizing Dashboards and Reports to Optimize Your WorkforceEPAY Systems
It’s hard to quantify the impact of human resources, but the influx of new HR systems is now making this possible, and HR needs to catch up.
68% of those we surveyed at SHRM '18 responded that they could not show a return on investment on their HR system, which should really be one of the strongest metrics for any HR system.
Metrics of key performance indicators allow businesses to make informed decisions. Learn what reports you need to be looking at and what these reports mean for your business.
In our 45-minute webinar we cover:
- The most reliable reports for data-informed decisions
- Reports every active manager needs to look at
- How to show a return on your HR investment
- A demonstration of EPAY’s powerful reporting.
Combat Workforce Time Theft - EPAY SystemsEPAY Systems
Time theft is one of the biggest challenges for employers of an hourly, distributed workforce costing over 400 billion each year in lost productivity.
Our presentation will cover:
• Types of time theft
• Developing a time theft policy
• Uncovering time theft with analytics
• Stopping Time Theft with Biometrics
• A demonstration of EPAYs Workforce Management
Join EPAY Systems as we cover a variety of techniques that will stop time theft and optimize your workforce.
With so many different functions operating under the simple title of “Human Resources,” tech has stepped up to help lift the burden. New tools are being released daily, but HR pros should know the most important and valuable tools in the HR tool belt.
Join EPAY Systems as we walk through the top talked about and most vital tools that HR departments must have to successfully manage an hourly, distributed workforce. These tools aren’t new to the block, but they have become integral pieces to the HR process for meeting top human resource challenges.
The 45-minute presentation will cover:
Top predicted challenges for HR in 2019
Importance of mobile technology
Growing value of workforce learning and development
Plus, a short demo of EPAY’s innovative tools for managing the hourly, distributed workforce!
Great RFPs are hard to create, for buyers and vendors alike, but they are truly the key to finding the solution that best meets your company’s needs.
Join EPAY Systems as we walk through the Request for Proposal creation process, from planning and drafting to final evaluation. After receiving and working with thousands of RFPs, we’ve taken note of the most common “dos” and “don’ts” and created a foolproof RFP template to use when buying an HR system.
The 1-hour presentation will also cover:
Creating an RFP timeline and process
Tips for developing your RFP
Reviewing and evaluating your RFP objectively
Common mistakes to avoid
Background Checks: How to Stay Compliant with the Onslaught of Legal Changes ...EPAY Systems
Background checks are key to ensuring a safe, secure workplace; however, they also require taking specific steps to ensure compliance with the Fair Credit Reporting Act (FCRA) – and that is no small task, especially considering the onslaught of ban-the-box and other laws protecting ex-offenders that have been enacted at the state and local level.
This webinar will help you better understand what you need to do to stay compliant with the numerous laws that regulate your background screening program.
Join EPAY Systems and Seyfarth Shaw's employment law expert Jennifer Mora as she addresses:
- The latest insights as they relate to the Fair Credit Reporting Act (FCRA).
- What you need to know to remain FCRA-compliant.
- How to align your screening practices with FCRA regulations.
- How to navigate the wave of ban-the-box laws sweeping the nation.
- Understanding other legal issues that touch on an employer’s background screening process.
About EPAY Systems
EPAY Systems is a leading SaaS provider of human capital management technology and services designed to help medium to large businesses better manage their workforce. Our solutions include recruiting and applicant tracking, new hire onboarding, benefits administration, HR management, time tracking, workforce management, payroll processing, tax management, performance management, ACA reporting, COBRA administration, and more.
At EPAY Systems, we understand the challenges of people management, especially when dealing with the complexities of an hourly workforce. That’s why our number 1 priority is to make your life easier. Our services, complete with easy-to-use cloud software and 24/7 customer support, manage everything for you—from pre-hire to retire. And when it comes to pricing, there are no surprises. You pay one straight-forward, all-inclusive monthly price.
I-9 Compliance: Adapting to Trump's Increased Immigration EnforcementEPAY Systems
It’s no secret, I-9s are incredibly complicated. There are over 900 pages of guides, handbooks and websites published by the government to help. On top of that, simple mistakes can turn into major violations – costing up to $2,236 per violation!
Join EPAY Systems and Anna Pajor SPHR, as we cover I-9 strategies to help ensure compliance and prevent violations (and their costly consequence).
Our 1-hour presentation will cover:
• Changes in I-9 and Immigration Enforcement
• I-9 strategies for a distributed workforce
• Correcting I-9s
• What to do in case of an I-9 audit
Workforce Reporting: How to Show a Return on Your HR InvestmentEPAY Systems
It’s hard to quantify the impact of human resources, but the influx of new HR systems is now making this possible, and HR needs to catch up.
68% of those we surveyed at SHRM 18 responded that they could not show a return on investment on their HR system, which should really be one of the strongest metrics for any HR system.
Metrics of key performance indicators allow businesses to make informed decisions. Learn what reports you need to be looking at and what these reports mean for your business.
The Future Workforce: The Gig Economy and the Challenges of a Contingent Work...EPAY Systems
Almost 40 million Americans work on a part-time or freelance basis and by 2020 half of the American workforce is expected to be part of this gig economy. This new workforce is full of challenges and benefits for both employers and employees. For employers looking to engage this new workforce there is a lot of legal compliance issues to consider, and for employees looking for freedom they look to be free of benefits as well.
Discover different techniques to cut your turnover and a software that will support you every step of the way. https://www.epaysystems.com/human-capital-management/
Turnover can be a deadly hidden cost. Did you know that the cost for each new hire averages $4,129? Utilize an applicant tracking system, onboarding and performance management to cut your turnover drastically.If your applicant tracking system isn't up to par, it can be another burden on your heavy shoulders.
Let us shoulder some of the burden. For more information about how to improve upon onboarding and performance management, along with other aspects of human capital and workforce management, contact EPAY Systems today. http://www.epaysystems.com/contact-us/
2018 Department Of Labor Rules and Surprise VisitsEPAY Systems
Companies can run into major problems if they aren’t up to date on the latest U.S. Department of Labor wage and hour rules. The Wage and Hour Division of the Department of Labor has an enormous impact on the interpretation and enforcement of the FLSA. On the state and local level, agencies play a large role in enforcing the wave of cutting-edge wage laws related to predictive scheduling, minimum wage, and sick time.
With many surprise visits and updates to the Department of Labor rules, it is important to align your company’s compliance goals with what we believe to be the current priorities of the Department of Labor and state and local agencies.
Join EPAY Systems and Seyfarth Shaw as we dive into practical advice that can be used to tackle a government wage and hour audit. Don’t wait until the government knocks on your company’s door before learning about the nuts and bolts of state and federal wage and hour agencies. Watch the webinar now.
Do I Have to Pay for That? Navigating the Common Pitfalls of Wage and Hour LawsEPAY Systems
Companies can run into major problems if they fail to pay their employees for all compensable work time. The complexity of the FLSA’s rules and different state requirements—like strict California meal break laws—can cause confusion among employers as to whether certain time counts as compensable work hours. As a result, employers are frequently defending against costly wage and hour lawsuits.
With big verdicts, record settlements, increasing worker awareness, and widespread public attention to how employees are paid, it’s no surprise that the number of wage and hour lawsuits is increasing. Given these factors, employers should tread carefully when determining payment for employees.
View the webinar slides to see how EPAY Systems and Seyfarth Shaw dive into the legal requirements for paying employees for meal and rest breaks, travel time and on-call time.
How to Lower Healthcare Costs in the Face of Healthcare Reform UncertaintyEPAY Systems
Rising healthcare costs have presented challenges for many companies across the U.S., as they struggle to find affordable group health insurance solutions that help them retain critical talent. With healthcare costs likely being the second or third largest corporate expense behind payroll, it’s essential to understand the dynamics of different healthcare plan options, cost drivers and ways to control the increases.
When it comes to group health insurance, there are ways to save money—regardless of how your company’s healthcare plan is currently set up. The method of self-funding with a third party administrator (TPA) is growing in popularity not just among large employers but small businesses, too. This option can help companies mitigate the risk of rising health insurance premiums while continuing to provide employees with health coverage.
View the slides to see tips on how to lower healthcare costs in the face of healthcare reform uncertainty.
What does employee time theft cost your business? One recent study estimates that it costs more than $400 billion—for U.S. employers alone. Worse yet, what if your managers are inflating payroll dollars intentionally (i.e., helping employees steal time) or unintentionally (i.e., running lackadaisical clock in/clock out protocols)?
Whether biometrics don’t seem to be gelling with your workforce or you suspect time sheets are being manipulated to your company’s disadvantage, this session will explore tools that will reduce your time theft drastically.
EPAY Systems recently announced cutting-edge facial recognition technology for our time clocks and mobile app products. This incredibly fast and accurate technology, along with our advanced fingerprint biometrics and workforce analytics tools, will practically end time theft at the point of clock-in/clock-out. With EPAY’s workforce analytics and custom reporting, you’ll have access to dashboards that offer easy to understand charts and tables to help you identify time theft incidents at the source.
Fueling AI with Great Data with Airbyte WebinarZilliz
This talk will focus on how to collect data from a variety of sources, leveraging this data for RAG and other GenAI use cases, and finally charting your course to productionalization.
Threats to mobile devices are more prevalent and increasing in scope and complexity. Users of mobile devices desire to take full advantage of the features
available on those devices, but many of the features provide convenience and capability but sacrifice security. This best practices guide outlines steps the users can take to better protect personal devices and information.
AI 101: An Introduction to the Basics and Impact of Artificial IntelligenceIndexBug
Imagine a world where machines not only perform tasks but also learn, adapt, and make decisions. This is the promise of Artificial Intelligence (AI), a technology that's not just enhancing our lives but revolutionizing entire industries.
Have you ever been confused by the myriad of choices offered by AWS for hosting a website or an API?
Lambda, Elastic Beanstalk, Lightsail, Amplify, S3 (and more!) can each host websites + APIs. But which one should we choose?
Which one is cheapest? Which one is fastest? Which one will scale to meet our needs?
Join me in this session as we dive into each AWS hosting service to determine which one is best for your scenario and explain why!
Project Management Semester Long Project - Acuityjpupo2018
Acuity is an innovative learning app designed to transform the way you engage with knowledge. Powered by AI technology, Acuity takes complex topics and distills them into concise, interactive summaries that are easy to read & understand. Whether you're exploring the depths of quantum mechanics or seeking insight into historical events, Acuity provides the key information you need without the burden of lengthy texts.
Generating privacy-protected synthetic data using Secludy and MilvusZilliz
During this demo, the founders of Secludy will demonstrate how their system utilizes Milvus to store and manipulate embeddings for generating privacy-protected synthetic data. Their approach not only maintains the confidentiality of the original data but also enhances the utility and scalability of LLMs under privacy constraints. Attendees, including machine learning engineers, data scientists, and data managers, will witness first-hand how Secludy's integration with Milvus empowers organizations to harness the power of LLMs securely and efficiently.
Digital Marketing Trends in 2024 | Guide for Staying AheadWask
https://www.wask.co/ebooks/digital-marketing-trends-in-2024
Feeling lost in the digital marketing whirlwind of 2024? Technology is changing, consumer habits are evolving, and staying ahead of the curve feels like a never-ending pursuit. This e-book is your compass. Dive into actionable insights to handle the complexities of modern marketing. From hyper-personalization to the power of user-generated content, learn how to build long-term relationships with your audience and unlock the secrets to success in the ever-shifting digital landscape.
Cosa hanno in comune un mattoncino Lego e la backdoor XZ?Speck&Tech
ABSTRACT: A prima vista, un mattoncino Lego e la backdoor XZ potrebbero avere in comune il fatto di essere entrambi blocchi di costruzione, o dipendenze di progetti creativi e software. La realtà è che un mattoncino Lego e il caso della backdoor XZ hanno molto di più di tutto ciò in comune.
Partecipate alla presentazione per immergervi in una storia di interoperabilità, standard e formati aperti, per poi discutere del ruolo importante che i contributori hanno in una comunità open source sostenibile.
BIO: Sostenitrice del software libero e dei formati standard e aperti. È stata un membro attivo dei progetti Fedora e openSUSE e ha co-fondato l'Associazione LibreItalia dove è stata coinvolta in diversi eventi, migrazioni e formazione relativi a LibreOffice. In precedenza ha lavorato a migrazioni e corsi di formazione su LibreOffice per diverse amministrazioni pubbliche e privati. Da gennaio 2020 lavora in SUSE come Software Release Engineer per Uyuni e SUSE Manager e quando non segue la sua passione per i computer e per Geeko coltiva la sua curiosità per l'astronomia (da cui deriva il suo nickname deneb_alpha).
TrustArc Webinar - 2024 Global Privacy SurveyTrustArc
How does your privacy program stack up against your peers? What challenges are privacy teams tackling and prioritizing in 2024?
In the fifth annual Global Privacy Benchmarks Survey, we asked over 1,800 global privacy professionals and business executives to share their perspectives on the current state of privacy inside and outside of their organizations. This year’s report focused on emerging areas of importance for privacy and compliance professionals, including considerations and implications of Artificial Intelligence (AI) technologies, building brand trust, and different approaches for achieving higher privacy competence scores.
See how organizational priorities and strategic approaches to data security and privacy are evolving around the globe.
This webinar will review:
- The top 10 privacy insights from the fifth annual Global Privacy Benchmarks Survey
- The top challenges for privacy leaders, practitioners, and organizations in 2024
- Key themes to consider in developing and maintaining your privacy program
Programming Foundation Models with DSPy - Meetup SlidesZilliz
Prompting language models is hard, while programming language models is easy. In this talk, I will discuss the state-of-the-art framework DSPy for programming foundation models with its powerful optimizers and runtime constraint system.
Introduction of Cybersecurity with OSS at Code Europe 2024Hiroshi SHIBATA
I develop the Ruby programming language, RubyGems, and Bundler, which are package managers for Ruby. Today, I will introduce how to enhance the security of your application using open-source software (OSS) examples from Ruby and RubyGems.
The first topic is CVE (Common Vulnerabilities and Exposures). I have published CVEs many times. But what exactly is a CVE? I'll provide a basic understanding of CVEs and explain how to detect and handle vulnerabilities in OSS.
Next, let's discuss package managers. Package managers play a critical role in the OSS ecosystem. I'll explain how to manage library dependencies in your application.
I'll share insights into how the Ruby and RubyGems core team works to keep our ecosystem safe. By the end of this talk, you'll have a better understanding of how to safeguard your code.
Skybuffer SAM4U tool for SAP license adoptionTatiana Kojar
Manage and optimize your license adoption and consumption with SAM4U, an SAP free customer software asset management tool.
SAM4U, an SAP complimentary software asset management tool for customers, delivers a detailed and well-structured overview of license inventory and usage with a user-friendly interface. We offer a hosted, cost-effective, and performance-optimized SAM4U setup in the Skybuffer Cloud environment. You retain ownership of the system and data, while we manage the ABAP 7.58 infrastructure, ensuring fixed Total Cost of Ownership (TCO) and exceptional services through the SAP Fiori interface.
Unlock the Future of Search with MongoDB Atlas_ Vector Search Unleashed.pdfMalak Abu Hammad
Discover how MongoDB Atlas and vector search technology can revolutionize your application's search capabilities. This comprehensive presentation covers:
* What is Vector Search?
* Importance and benefits of vector search
* Practical use cases across various industries
* Step-by-step implementation guide
* Live demos with code snippets
* Enhancing LLM capabilities with vector search
* Best practices and optimization strategies
Perfect for developers, AI enthusiasts, and tech leaders. Learn how to leverage MongoDB Atlas to deliver highly relevant, context-aware search results, transforming your data retrieval process. Stay ahead in tech innovation and maximize the potential of your applications.
#MongoDB #VectorSearch #AI #SemanticSearch #TechInnovation #DataScience #LLM #MachineLearning #SearchTechnology
How to Interpret Trends in the Kalyan Rajdhani Mix Chart.pdfChart Kalyan
A Mix Chart displays historical data of numbers in a graphical or tabular form. The Kalyan Rajdhani Mix Chart specifically shows the results of a sequence of numbers over different periods.
2. Agenda
•
•
•
•
•
Features
Getting to Custom Reporting
Layout Familiarity
Create a Custom Report
o Adding Fields
o Adding Charts
o Adding Filters
o Changing Report Style
Upcoming Webinars
For internal use only
2
3. Agenda
•
•
•
•
•
Features
Getting to Custom Reporting
Layout Familiarity
Create a Custom Report
o Adding Fields
o Adding Charts
o Adding Filters
o Changing Report Style
Upcoming Webinars
For internal use only
3
4. Features
•
•
•
•
Available to Administrators only for this release
Ability to create custom reports and save for later use
Create custom charts, calculations, filters, styles, etc…
Export out to:
o CSV
o PDF
o Excel
o Word
o Rich Text Format
o XML
o Open Office
For internal use only
4
5. Agenda
•
•
•
•
•
Features
Getting to Custom Reporting
Layout Familiarity
Create a Custom Report
o Adding Fields
o Adding Charts
o Adding Filters
o Changing Report Style
Upcoming Webinars
For internal use only
5
8. Agenda
•
•
•
•
•
Features
Getting to Custom Reporting
Layout Familiarity
Create a Custom Report
o Adding Fields
o Adding Charts
o Adding Filters
o Changing Report Style
Upcoming Webinars
For internal use only
8
11. Agenda
•
•
•
•
•
Features
Getting to Custom Reporting
Layout Familiarity
Creating a Custom Report
o Adding Fields
o Adding Charts
o Adding Filters
o Changing Report Style
Upcoming Webinars
For internal use only
11
13. Agenda
•
•
•
•
•
Features
Getting to Custom Reporting
Layout Familiarity
Creating a Custom Report
o Adding Fields
o Adding Charts
o Adding Filters
o Changing Report Style
Upcoming Webinars
For internal use only
13
14. Creating Custom Report Fields
•
First select the Data Source
o Defines what you want to report off of
For internal use only
14
15. Creating Custom Report Fields
•
•
•
It’s time to define fields
Depending on the field type, will allow you different options
Fields can be grouped together
o VG = Visual Grouping which will separate the data out to
different tables
For internal use only
15
16. Creating Custom Report Fields
•
•
•
•
•
Sort defines the sort order
A defines which type of calculation will occur with the previous
field
Function defines how to group, sum, counts, minimum, maximum
Format defines how to display the information depending on the
field type
Move fields around to arrange the order by drag-n-drop
For internal use only
16
17. Creating Custom Report Fields
•
Numeric Fields
o Do calculations using the A
checkbox such as
addition, subtraction, division, multipli
cation
o Other functions
Count
Maximum
Minimum
Group
For internal use only
17
18. Creating Custom Report Fields
•
String Fields
o Concatenate (combine fields) using
the A checkbox
o Other functions
Count
Maximum
Minimum
Group
For internal use only
18
19. Creating Custom Report Fields
•
Date Fields
o Many different options under function
o Calculations
Count
Minimum
Maximum
Number of Days Old
Average of how many Days Old
Total the number of Days Old
o Grouping can be done in many different ways
By Day
By Month Name (abbreviated version as well
By Day of Week
By Date
By Year & Month (abbreviated version as well)
By Week
By Year & Quarter
For internal use only
19
20. Creating Custom Report Fields
•
•
•
The fields section can include pivot tables
Additional fields can be added to the pivot table by
selecting the insert row
Pivot tables can also calculate totals for sub totals at the
bottom of the report and side totals to the right of the
report
For internal use only
20
21. Agenda
•
•
•
•
•
Features
Getting to Custom Reporting
Layout Familiarity
Creating a Custom Report
o Adding Fields
o Adding Charts
o Adding Filters
o Changing Report Style
Upcoming Webinars
For internal use only
21
22. Creating Custom Report Charts
•
•
For internal use only
Can add up to two charts to a report
Many different chart types
o Trend
o Pie
o Plot
o Bar
o Funnel
22
23. Creating Custom Report Charts
•
For internal use only
Trend chart allows you to plot values
against dates
23
25. Creating Custom Report Charts
•
Pie chart
o Show as 3D
o Show as regular Pie chart or Donut chart
o Explode largest slice
o Combine the lowest percentage (defined by
you)
For internal use only
25
29. Creating Custom Report Charts
•
For internal use only
Bar Graph
o Optional to include a line
o Change to a horizontal graph
o Show a pareto
o Stack values
29
31. Agenda
•
•
•
•
•
Features
Getting to Custom Reporting
Layout Familiarity
Creating a Custom Report
o Adding Fields
o Adding Charts
o Adding Filters
o Changing Report Style
Upcoming Webinars
For internal use only
31
32. Creating Custom Report Filters
•
•
•
•
Create filters to remove unwanted information for the data set
Variety of types of filters
Dates can be filtered by date ranges
Also can include conditional filter logic
For internal use only
32
33. Agenda
•
•
•
•
•
Features
Getting to Custom Reporting
Layout Familiarity
Creating a Custom Report
o Adding Fields
o Adding Charts
o Adding Filters
o Changing Report Style
Upcoming Webinars
For internal use only
33
34. Creating Custom Report Styles
•
•
•
•
•
Let the report be formatted with your color scheme
Change the order of the charts, tables, etc…
Change page layout
Change the visual group style
Change the number of records per page
For internal use only
34
36. Upcoming 6.2 Training
• 6.2 Schedule Module Enhancements Training
Webinar
o May 23: 10:00 am cdt
o Register at
http://www2.epaysystems.com/scheduling
Call Support at 877-800-3729
For internal use only
36
37. Upcoming Education
Compliance Webinar Series with Seyfarth Shaw LLP
•
Preparing for the Affordable Care Act (ObamaCare).
May 22: 12:00 cst
•
Reduce Costs with Pay Cards. June 19: 10:00cst
•
California Wage & Hour Labor Law--Avoiding Common Pitfalls
with a Distributed Workforce. June 26: 12:00 cst
•
How to Avoid Costly Wage & Hour Pitfalls for Healthcare
Employers with a Distributed Workforce. Sept 25: 12:00 cst
•
How to Avoid Costly Wage & Hour Pitfalls for Employers in the
Hospitality Industry. Nov 6: 12:00 cst
Register at www.EPAYsystems.com
For internal use only
37
38. Customer Follow Contest!
• Follow what is going on at EPAY
•
Systems on Twitter and/or
LinkedIn and be entered for a
chance to win a new iPad Mini!
Learn more at
http://www.epaysystems.com/customersocial-media-contest/
Connect with EPAY:
o LinkedIn – follow our company
page at EPAY Systems
o Twitter -- @EPAYsystems
For internal use only
38
Access is only available to employees with an Administrative role This is due to no data restrictionDid not want to compromise securityData is available across all of timeCreating reports to be used laterAdministrator can create reports and save them off for later useThey would be listed in the Custom Reports FolderStandard Reports Folder are where reports that are created by EPAY are located and cannot be deleted by the administratorCreate Reports that can includeCharts Trend GraphPiePlotBar GraphFunnelCreate calculations against other fieldsAdd filters to filter data to only view the information you want to viewChange the way the reports look so that it looks and feels like a report came from youExport data to multiple formatsCSVPDFExcelWordRTFXMLOpen Office
Login to Blueforce as an AdministratorSelect the Reports ModuleFind the link on the left panel labeled “Custom Reporting” or “Custom Ad-Hoc” Custom Reports vs Standard ReportsCustom Reports = reports created by the administratorStandard Reports = Reports create by EPAY SystemsAdding a new reportTo add a new report, select the link labled “Design A New Report”Editing a reportMouse over the report you wish to edit. You will see a pencil icon to the left of the reportSelect the pencil iconEditing a Standard Report will create a new Custom Report when you save the reportDeleting a reportMouse over the Custom Report you want to delete. You will see a red X icon to the left of the reportSelect the red X iconCustom Reports can be deleted, however, Standard Reports cannot be deleted.
First, run a reportLook at the menu bar at the top. We will identify each icon and identify what’s it’s used forBack Button = The back button takes you to the browser’s previous pageRepoort List = This button will take you back to the list of reportsNew = The new button will create a new reportSave = This will save the current report setup. If you are in a Standard Report and select save, a new report will be listed in the Custom Reports folderSave As = The save as button will bring up a popup that will allow the user to enter in what the new name of the report will be
First, run a reportLook at the menu bar at the top. We will identify each icon and identify what’s it’s used forPrint = The print button will actually save the report output as a PDF documentSQL = The SQL allows you to view what the SQL code is for the reportCSV = Saves the report in a .csv fileOpen Office = Saves the report in a .uof fileExcel = Saves the report in a .xls fileWord = Saves the report in a .doc fileXML = Saves the report in a .xml fileRTF = Saves the report in a .rtf fileResults = Results defines how many of the top results to show in the report
Data Sources is the first step when creating a report. This defines which data you will be reporting off ofFields define which fields you want to show in the reportThere are many features in the fields section which include:CalculationsPivot TableGroupingSummary is a way to setup a summary of data and has similar functions as fieldsCharts is where you can create different charts/graphs to show data visuallyFilters applies various filters based on fields so that only that data is shownStyles is what allows you to change the color scheme on the report
- First select the data sources you want to create a report for
Add the fields to the report that you want- Depending on the field type, will allow you different options- Fields can be grouped together VG = Visual Grouping which will separate the data out to different tables
- Mousing over icons shows a description of what it is- Sort defines the sort order- A defines which type of calculation will occur with the previous field- Function defines how to group, sum, counts, minimum, maximum- Format defines how to display the information depending on the field type- Move fields around to arrange the order by drag-n-drop
- Numeric FieldsDo calculations using the A checkbox such as addition, subtraction, division, multiplicationSelecting the checkbox will change which function it will beWill appear with a +, - , /, * in the checkboxCalculations use the previous column to apply the function- Other functions- Count- Maximum- Minimum- Group
- String FieldsConcatenate (combine fields) using the A checkboxWill appear with a “+” sign in the checkboxConcatenation uses the previous column to apply the function- Other functions- Count- Maximum- Minimum- Group
- Date Fields- Many different options under function- Calculations- Count- Minimum- Maximum- Number of Days Old- Average of how many Days Old- Total the number of Days Old- Grouping can be done in many different ways- By Day- By Month Name (abbreviated version as well- By Day of Week- By Date- By Year & Month (abbreviated version as well)- By Week- By Year & Quarter
- The fields section can include pivot tables- Additional fields can be added to the pivot table by selecting the insert rowPivot tables can also calculate totals for sub totals at the bottom of the report and side totals to the right of the reportSummary section is very similar to Fields. If you know how to navigate around the Fields section, you will know how to use the summary.Limitation with summary is that no pivot table can be added to it
- Many different chart types- Trend- Pie- Plot- BarFunnelDifferent charts have different options for you to choose from
Select a date fieldSelect the field that defines the value that will make up the values in the chartYou may also include a separator to separate out the different lines
Example of a Trend Chart
Select a field to define the labelsSelect the field that defines the value that will make up the values in the chartYou may also include a separator
Example of a Pie Chart
Select a field to define the X-axisSelect the field that defines the Y-axisYou may also include a separator
Example of a Plot
Select a field to define the LabelSelect the field that defines the value that will make up the values in the graphYou may also include a separator to separate out the different linesMay include a value to generate a line
Example of a Bar Graph
A lot of options here for filtering depending on the field typeConditional filter logic allows you to use and/or statements to combine filtersi.e.: I want to only view information that includes filters 1 or 2 and 3 or 4.This will apply the filters for any combination of 1 or 2 with 3 or 4Combo Table:1 & 31 & 42 & 32 & 4