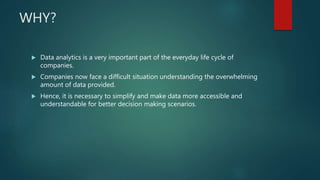
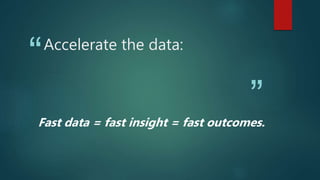
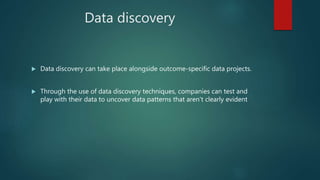
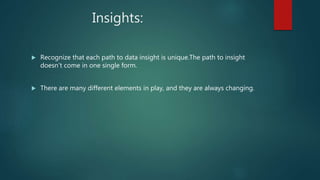
Simplify Your Analytics Strategy
 This ppt is done as a part of the
data analytics internship under
Prof. Sameer Mathur (IIM lucknow)
WHY?
 Data analytics is a very important part of the everyday life cycle of
companies.
 Companies now face a difficult situation understanding the overwhelming
amount of data provided.
 Hence, it is necessary to simplify and make data more accessible and
understandable for better decision making scenarios.
“
”
Accelerate the data:
Fast data = fast insight = fast outcomes.
EXAMPLE:
 A U.S. bank adopted such a technology environment to more efficiently
manage increasing data volumes for its customer analytics projects.
 As a result, the firm experienced improved processing time by several
hours, generating quicker insights and a faster reaction time.

Delegation of work can be very
rewarding:
 Delegate the work to your analytics technologies. Uncovering data insights
doesn’t have to be difficult.
 There are many ways to delegate work and make the work easier and
makes the result more accurate.
Next-Gen Business Intelligence (BI) and
data visualization.
 At its core, next-gen business intelligence is bringing data and analytics to
life to help companies improve and optimize their decision-making and
organizational performance.
 BI does this by turning an organization’s data into an asset by having the
right data, at the right time and place and displayed in the right visual
form for each individual decision-maker, so they can use it to reach their
desired outcome.
An Example:
 A financial services company applied BI and data visualization to see the
different buckets of risk across its entire loan portfolio.
 After analyzing its key data and displaying the results via visualizations, the
firm identified the areas in the U.S. where there were high delinquency
rates, explored tranches based on lenders, loan purposes, and loan
channels, and viewed bank loan portfolios.
Data discovery
 Data discovery can take place alongside outcome-specific data projects.
 Through the use of data discovery techniques, companies can test and
play with their data to uncover data patterns that aren’t clearly evident
Insights:
 Recognize that each path to data insight is unique.The path to insight
doesn’t come in one single form.
 There are many different elements in play, and they are always changing.
Managerial Relevance
 The managerial relevance here is that for a known problem with a known
solution such as customer segmentation and propensity modelling for
targeted marketing campaigns the company could take a hypothesis
based approach.
THANK YOU !

Simplify your analytics strategy

  • 1.
    Simplify Your AnalyticsStrategy  This ppt is done as a part of the data analytics internship under Prof. Sameer Mathur (IIM lucknow)
  • 2.
    WHY?  Data analyticsis a very important part of the everyday life cycle of companies.  Companies now face a difficult situation understanding the overwhelming amount of data provided.  Hence, it is necessary to simplify and make data more accessible and understandable for better decision making scenarios.
  • 3.
    “ ” Accelerate the data: Fastdata = fast insight = fast outcomes.
  • 4.
    EXAMPLE:  A U.S.bank adopted such a technology environment to more efficiently manage increasing data volumes for its customer analytics projects.  As a result, the firm experienced improved processing time by several hours, generating quicker insights and a faster reaction time. 
  • 5.
    Delegation of workcan be very rewarding:  Delegate the work to your analytics technologies. Uncovering data insights doesn’t have to be difficult.  There are many ways to delegate work and make the work easier and makes the result more accurate.
  • 6.
    Next-Gen Business Intelligence(BI) and data visualization.  At its core, next-gen business intelligence is bringing data and analytics to life to help companies improve and optimize their decision-making and organizational performance.  BI does this by turning an organization’s data into an asset by having the right data, at the right time and place and displayed in the right visual form for each individual decision-maker, so they can use it to reach their desired outcome.
  • 7.
    An Example:  Afinancial services company applied BI and data visualization to see the different buckets of risk across its entire loan portfolio.  After analyzing its key data and displaying the results via visualizations, the firm identified the areas in the U.S. where there were high delinquency rates, explored tranches based on lenders, loan purposes, and loan channels, and viewed bank loan portfolios.
  • 8.
    Data discovery  Datadiscovery can take place alongside outcome-specific data projects.  Through the use of data discovery techniques, companies can test and play with their data to uncover data patterns that aren’t clearly evident
  • 9.
    Insights:  Recognize thateach path to data insight is unique.The path to insight doesn’t come in one single form.  There are many different elements in play, and they are always changing.
  • 10.
    Managerial Relevance  Themanagerial relevance here is that for a known problem with a known solution such as customer segmentation and propensity modelling for targeted marketing campaigns the company could take a hypothesis based approach.
  • 11.