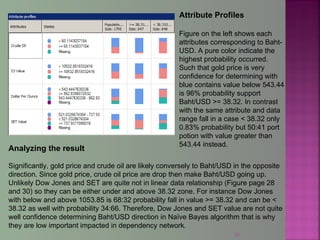
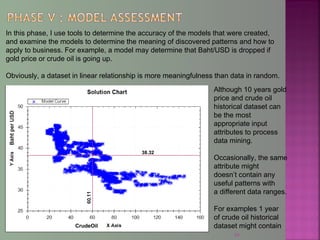
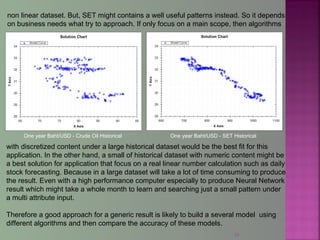
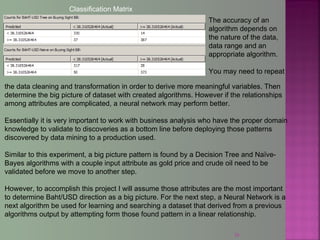
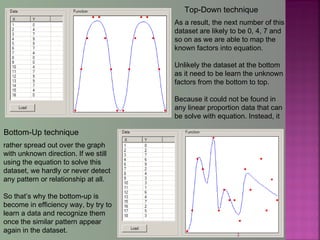
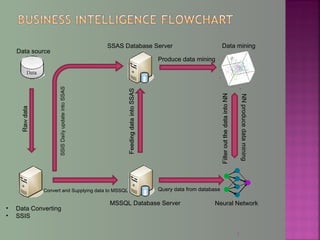
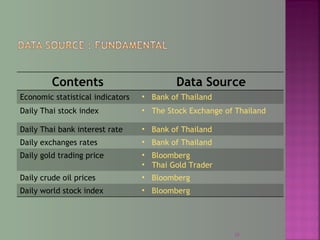
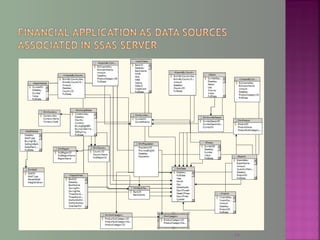
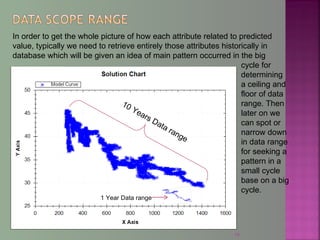
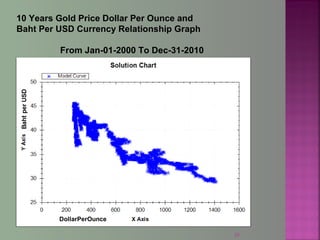
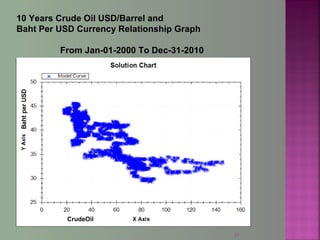
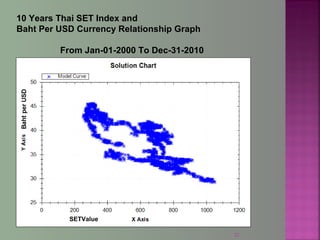
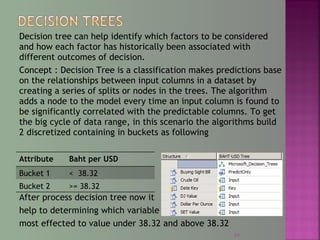
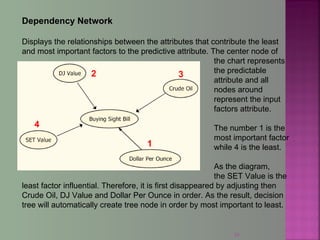
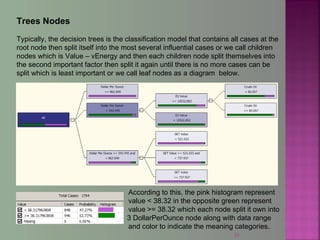
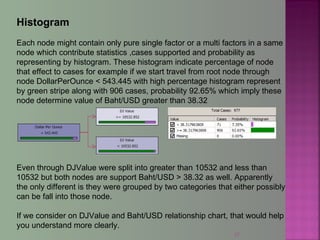
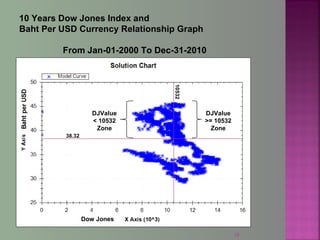
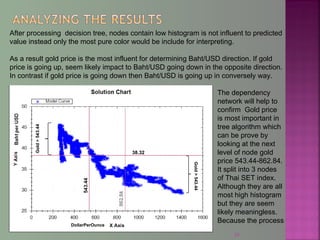
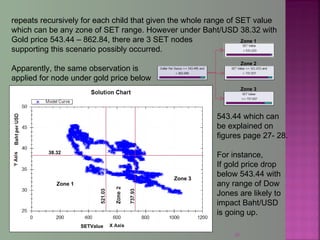
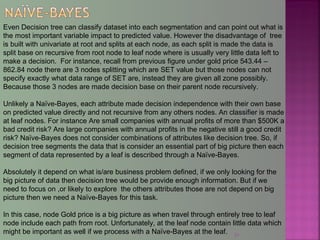
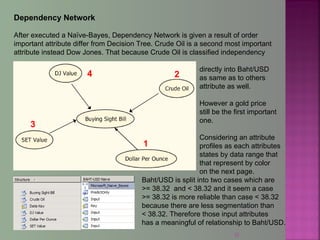
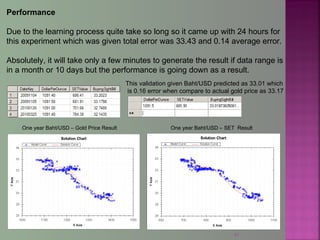
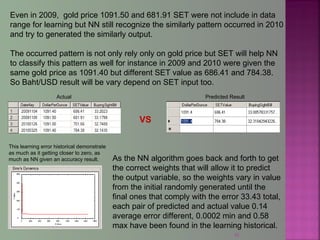
The document discusses data mining techniques for predicting currency exchange rates between the US Dollar and Thai Baht. It describes collecting historical data on economic indicators and financial factors from sources like the Bank of Thailand to build a database. Various data mining algorithms like decision trees, naive Bayes, and neural networks are used to analyze the data and identify the most important variables for predicting exchange rates. Graphs show relationships between the Baht exchange rate and factors like gold prices, crude oil prices, stock indexes over 10 years. The goal is to accurately forecast future exchange rates based on the patterns found in the historical data.
The objective of this project is to discuss the importance of Machine Learning in different sectors and how does it solve the problems in the Marketing Analytics field. We have discussed Marketing Segmentation, Advertisement, and Fraud detection in our project. We used different Machine Learning algorithms and used R and Python library to predict and solve these problems. After making models and running test data on those models we got following results:
• We trained a Decision tree and Random Forest classifier model which has 73% accuracy to predict whether a person will be a defaulter or not based on credit history, income, job type, dependents etc.
• We segmented the Social networking profiles based on the likes and dislikes of a person using K-Means Clustering.
• We made a predictive model of the messages a customer receives and determined whether a message will be a Spam or not a spam with an accuracy of 97%. We used Naïve Bayes classifier for this model.
This presentation introduces big data and explains how to generate actionable insights using analytics techniques. The deck explains general steps involved in a typical analytics project and provides a brief overview of the most commonly used predictive analytics methods and their business applications.
Vijay Adamapure is a Data Science Enthusiast with extensive experience in the field of data mining, predictive modeling and machine learning. He has worked on numerous analytics projects ranging from healthcare, business analytics, renewable energy to IoT.
Vijay presented these slides during the Internet of Everything Meetup event 'Predictive Analytics - An Overview' that took place on Jan. 9, 2015 in Mumbai. To join the Meetup group, register here: http://bit.ly/1A7T0A1
Data Science - Part I - Sustaining Predictive Analytics CapabilitiesDerek Kane
This is the first lecture in a series of data analytics topics and geared to individuals and business professionals who have no understand of building modern analytics approaches. This lecture provides an overview of the models and techniques we will address throughout the lecture series, we will discuss Business Intelligence topics, predictive analytics, and big data technologies. Finally, we will walk through a simple yet effective example which showcases the potential of predictive analytics in a business context.
This project is about "Big Data Analytics," and it provides a comprehensive overview of topics related to Data and Analytics and a short note on Cognitive Analytics, Sentiment Analytics, Data Visualization, Artificial intelligence & Data-Driven Decision Making along with examples and diagrams.
Howdy!Take a look at this article and discover cool graduation thesis sample that we prepared for you. Get more here https://www.graduatethesis.org/graduate-thesis-sample/
Data science and data analytics major similarities and distinctions (1)Robert Smith
Those working in the field of technology hear the terms ‘Data Science’ and ‘Data Analytics’ probably all the time. These two words are often used interchangeably. Big data is a major component in the tech world today due to the actionable insights and results it offers for businesses. In order to study the data that your organization is producing, it is important to use the proper tools needed to comprehend big data to uncover the right information. To help you optimize your analytics, it is important for you to examine both the similarities and differences of data science and data analytics.
The capstone project is a Machine Learning application that creates a model for a famous bank in New Jersey.
It analyzes their Clients who took loans in their bank based on various parameters.
PoT - probeer de mogelijkheden van datamining zelf uit 30-10-2014Daniel Westzaan
IBM Proof of Technology
Probeer de Mogelijkheden van Datamining zelf uit
30-10-2014 Amsterdam, IBM Client Center
Presentatie van Laila Fettah & Robin van Tilburg
A presentation to the FSN-Elite Conference on the Future of Finance in London. Discuses how developments in data science will radically change the finance function and analysis. Part of this presentation challenges the core of how Finance and Accounting manage their data.
Data Analytics For Beginners | Introduction To Data Analytics | Data Analytic...Edureka!
Data Analytics for R Course: https://www.edureka.co/r-for-analytics
This Edureka Tutorial on Data Analytics for Beginners will help you learn the various parameters you need to consider while performing data analysis.
The following are the topics covered in this session:
Introduction To Data Analytics
Statistics
Data Cleaning and Manipulation
Data Visualization
Machine Learning
Roles, Responsibilities and Salary of Data Analyst
Need of R
Hands-On
Statistics for Data Science: https://youtu.be/oT87O0VQRi8
Follow us to never miss an update in the future.
Instagram: https://www.instagram.com/edureka_learning/
Facebook: https://www.facebook.com/edurekaIN/
Twitter: https://twitter.com/edurekain
LinkedIn: https://www.linkedin.com/company/edureka
Running head CS688 – Data Analytics with R1CS688 – Data Analyt.docxtodd271
Running head: CS688 – Data Analytics with R1
CS688 – Data Analytics with R10
CS688 – Data Analytics with R
Surendra Parimi
CS688 – Introduction to CRISP-DM and the R platform IP 1
Colorado Technical University
07/10/2019
Table of Contents
Introduction to CRISP-DM and the R Platform Organizational Background3
Organizational Background:3
CRISP-DM(Cross-industry standard process for data mining):3
Data Maturity:4
Role of Data Analyst:6
How Do we Implement the R Platform:6
R Modeling With Regressions and Classifications (TBD)7
Model Performance Evaluation (TBD)8
Visualizations With R (TBD)9
Machine Learning (TBD)10
References11
Introduction to CRISP-DM and the R Platform Organizational BackgroundOrganizational Background:
The organization I currently work for and planning to implement the techniques of the data analytics course is T-Mobile USA, which offers wireless mobile phone services to 0ver 80 million customers in the United States. It’s a huge enterprise with large scale information technology systems that support the business that T-Mobile does. The company is seeing significant growth in terms of business and therefore the IT systems that are supporting the business. Myself as a DEVOPS engineer works on deploying the code to these mission critical systems, host them and operate to make sure the systems are working as expected. As the land scape of our IT systems grow, we want to be able to identify the issues in our systems in advance so that we can prevent them before causing any outage to the business. To achieve such a result, our IT systems logs needs to be analyzed in-depth to unleash the critical insights about the system performance and apply the feedback to improve our systems.
CRISP-DM(Cross-industry standard process for data mining):
The CRISP-DM helps us ensure our data analysis adheres certain standards and CRISP-DM is a proven strategy worldwide. Corporations like IBM have further enhanced and or customized the standard and came up with their own methodology knows as ‘Analytics
Solution
s Unified Method for Data Mining/Predictive Analytics(ASUS_DM)’
The CRISP-DM methodology involves 6 different steps
Business Understanding: Building the knowledge about business requirements and objectives from functional aspect and transforming this knowledge as a data mining objective with an implementation plan.
Data Understanding: Involves the process of data collection from diverse sources of data, review and understand the data to be able to identify the problems which compromise data quality and also give the initial understanding of what the data can deliver.
Data Preparation: The data preparation phase covers all activities to build the final dataset from the initial raw data collected.
Modeling: Modeling techniques are based on the objective of the problem being tried. So, based on the problem, model is decided and based on the model, data is collected.
Evaluation: The evaluation phase is taken up once.
Top 30 Data Analyst Interview Questions.pdfShaikSikindar1
Data Analytics has emerged has one of the central aspects of business operations. Consequently, the quest to grab professional positions within the Data Analytics domain has assumed unimaginable proportions. So if you too happen to be someone who is desirous of making through a Data Analyst .
Data warehousing and business intelligence project reportsonalighai
Developed Data warehouse project with a structured, semi-structured and unstructured sources of data
and generated Business Intelligence reports. Topic for the project was Tobacco products consumption in
America. Studied on which products are more famous among people across and also got to know that
middle school students are the soft targets for the tobacco companies as maximum people start taking
tobacco products at this age.
Tools used: SSMS, SSIS, SSAS, SSRS, R-Studio, Power BI, Excel
What Your Database Query is Really DoingDave Stokes
Do you ever wonder what your database servers is REALLY doing with that query you just wrote. This is a high level overview of the process of running a query
Predictive Model and Record Description with Segmented Sensitivity Analysis (...Greg Makowski
Describing a predictive data mining model can provide a competitive advantage for solving business problems with a model. The SSA approach can also provide reasons for the forecast for each record. This can help drive investigations into fields and interactions during a data mining project, as well as identifying "data drift" between the original training data, and the current scoring data. I am working on open source version of SSA, first in R.
Why BI ?
Performance management
Identify trends
Cash flow trend
Fine-tune operations
Sales pipeline analysis
Future projections
business Forecasting
Decision Making Tools
Convert data into information
How to Think ?
What happened?
What is happening?
Why did it happen?
What will happen?
What do I want to happen?
SQLBits Module 2 RStats Introduction to R and StatisticsJen Stirrup
SQLBits Module 2 RStats Introduction to R and Statistics. This is a 90 minute segment of a full preconference workshop, focusing on data analytics with R.
BA is used to gain insights that inform business decisions and can be used to automate and optimize business processes. Data-driven companies treat their data as a corporate asset and leverage it for a competitive advantage. Successful business analytics depends on data quality, skilled analysts who understand the technologies and the business, and an organizational commitment to data-driven decision-making.
Business analytics examples
Business analytics techniques break down into two main areas. The first is basic business intelligence. This involves examining historical data to get a sense of how a business department, team or staff member performed over a particular time. This is a mature practice that most enterprises are fairly accomplished at using.
Data mining Course
Chapter 2: Data preparation and processing
Introduction
Domain Expert
Goal identification and Data Understanding
Data Cleaning
Missing values
Noisy Data
Inconsistent Data
Data Integration
Data Transformation
Data Reduction
Feature Selection
Sampling
Discretization
Data science in demand planning - when the machine is not enoughTristan Wiggill
A presentation by Calven van der Byl BCom Economics and Statistics, BCom Honours Mathematical Statistics, Masters Mathematical Statistics, Inventory Optimization Demand Planning Manager, DSV, South Africa.
Delivered during SAPICS 2016, a leading event for supply chain professionals, held in Sun City, South Africa.
Demand Planning is a complex, yet often de-emphasized function in the supply chain planning function. The demand planning function is often characterized by an over-reliance on off the shelf software as well as a great deal of manual intervention. This presentation will outline the current developments and perspective in big data analytics and how they can be leveraged with the demand planning function to improve forecasting agility and efficiency. A simulation study will be presented in order to illustrate these principles in practice.
Removing Uninteresting Bytes in Software FuzzingAftab Hussain
Imagine a world where software fuzzing, the process of mutating bytes in test seeds to uncover hidden and erroneous program behaviors, becomes faster and more effective. A lot depends on the initial seeds, which can significantly dictate the trajectory of a fuzzing campaign, particularly in terms of how long it takes to uncover interesting behaviour in your code. We introduce DIAR, a technique designed to speedup fuzzing campaigns by pinpointing and eliminating those uninteresting bytes in the seeds. Picture this: instead of wasting valuable resources on meaningless mutations in large, bloated seeds, DIAR removes the unnecessary bytes, streamlining the entire process.
In this work, we equipped AFL, a popular fuzzer, with DIAR and examined two critical Linux libraries -- Libxml's xmllint, a tool for parsing xml documents, and Binutil's readelf, an essential debugging and security analysis command-line tool used to display detailed information about ELF (Executable and Linkable Format). Our preliminary results show that AFL+DIAR does not only discover new paths more quickly but also achieves higher coverage overall. This work thus showcases how starting with lean and optimized seeds can lead to faster, more comprehensive fuzzing campaigns -- and DIAR helps you find such seeds.
- These are slides of the talk given at IEEE International Conference on Software Testing Verification and Validation Workshop, ICSTW 2022.
Securing your Kubernetes cluster_ a step-by-step guide to success !KatiaHIMEUR1
Today, after several years of existence, an extremely active community and an ultra-dynamic ecosystem, Kubernetes has established itself as the de facto standard in container orchestration. Thanks to a wide range of managed services, it has never been so easy to set up a ready-to-use Kubernetes cluster.
However, this ease of use means that the subject of security in Kubernetes is often left for later, or even neglected. This exposes companies to significant risks.
In this talk, I'll show you step-by-step how to secure your Kubernetes cluster for greater peace of mind and reliability.
PHP Frameworks: I want to break free (IPC Berlin 2024)Ralf Eggert
In this presentation, we examine the challenges and limitations of relying too heavily on PHP frameworks in web development. We discuss the history of PHP and its frameworks to understand how this dependence has evolved. The focus will be on providing concrete tips and strategies to reduce reliance on these frameworks, based on real-world examples and practical considerations. The goal is to equip developers with the skills and knowledge to create more flexible and future-proof web applications. We'll explore the importance of maintaining autonomy in a rapidly changing tech landscape and how to make informed decisions in PHP development.
This talk is aimed at encouraging a more independent approach to using PHP frameworks, moving towards a more flexible and future-proof approach to PHP development.
State of ICS and IoT Cyber Threat Landscape Report 2024 previewPrayukth K V
The IoT and OT threat landscape report has been prepared by the Threat Research Team at Sectrio using data from Sectrio, cyber threat intelligence farming facilities spread across over 85 cities around the world. In addition, Sectrio also runs AI-based advanced threat and payload engagement facilities that serve as sinks to attract and engage sophisticated threat actors, and newer malware including new variants and latent threats that are at an earlier stage of development.
The latest edition of the OT/ICS and IoT security Threat Landscape Report 2024 also covers:
State of global ICS asset and network exposure
Sectoral targets and attacks as well as the cost of ransom
Global APT activity, AI usage, actor and tactic profiles, and implications
Rise in volumes of AI-powered cyberattacks
Major cyber events in 2024
Malware and malicious payload trends
Cyberattack types and targets
Vulnerability exploit attempts on CVEs
Attacks on counties – USA
Expansion of bot farms – how, where, and why
In-depth analysis of the cyber threat landscape across North America, South America, Europe, APAC, and the Middle East
Why are attacks on smart factories rising?
Cyber risk predictions
Axis of attacks – Europe
Systemic attacks in the Middle East
Download the full report from here:
https://sectrio.com/resources/ot-threat-landscape-reports/sectrio-releases-ot-ics-and-iot-security-threat-landscape-report-2024/
Elevating Tactical DDD Patterns Through Object CalisthenicsDorra BARTAGUIZ
After immersing yourself in the blue book and its red counterpart, attending DDD-focused conferences, and applying tactical patterns, you're left with a crucial question: How do I ensure my design is effective? Tactical patterns within Domain-Driven Design (DDD) serve as guiding principles for creating clear and manageable domain models. However, achieving success with these patterns requires additional guidance. Interestingly, we've observed that a set of constraints initially designed for training purposes remarkably aligns with effective pattern implementation, offering a more ‘mechanical’ approach. Let's explore together how Object Calisthenics can elevate the design of your tactical DDD patterns, offering concrete help for those venturing into DDD for the first time!
Welcome to the first live UiPath Community Day Dubai! Join us for this unique occasion to meet our local and global UiPath Community and leaders. You will get a full view of the MEA region's automation landscape and the AI Powered automation technology capabilities of UiPath. Also, hosted by our local partners Marc Ellis, you will enjoy a half-day packed with industry insights and automation peers networking.
📕 Curious on our agenda? Wait no more!
10:00 Welcome note - UiPath Community in Dubai
Lovely Sinha, UiPath Community Chapter Leader, UiPath MVPx3, Hyper-automation Consultant, First Abu Dhabi Bank
10:20 A UiPath cross-region MEA overview
Ashraf El Zarka, VP and Managing Director MEA, UiPath
10:35: Customer Success Journey
Deepthi Deepak, Head of Intelligent Automation CoE, First Abu Dhabi Bank
11:15 The UiPath approach to GenAI with our three principles: improve accuracy, supercharge productivity, and automate more
Boris Krumrey, Global VP, Automation Innovation, UiPath
12:15 To discover how Marc Ellis leverages tech-driven solutions in recruitment and managed services.
Brendan Lingam, Director of Sales and Business Development, Marc Ellis
Enhancing Performance with Globus and the Science DMZGlobus
ESnet has led the way in helping national facilities—and many other institutions in the research community—configure Science DMZs and troubleshoot network issues to maximize data transfer performance. In this talk we will present a summary of approaches and tips for getting the most out of your network infrastructure using Globus Connect Server.
Generative AI Deep Dive: Advancing from Proof of Concept to ProductionAggregage
Join Maher Hanafi, VP of Engineering at Betterworks, in this new session where he'll share a practical framework to transform Gen AI prototypes into impactful products! He'll delve into the complexities of data collection and management, model selection and optimization, and ensuring security, scalability, and responsible use.
Encryption in Microsoft 365 - ExpertsLive Netherlands 2024Albert Hoitingh
In this session I delve into the encryption technology used in Microsoft 365 and Microsoft Purview. Including the concepts of Customer Key and Double Key Encryption.
Smart TV Buyer Insights Survey 2024 by 91mobiles.pdf91mobiles
91mobiles recently conducted a Smart TV Buyer Insights Survey in which we asked over 3,000 respondents about the TV they own, aspects they look at on a new TV, and their TV buying preferences.
SAP Sapphire 2024 - ASUG301 building better apps with SAP Fiori.pdfPeter Spielvogel
Building better applications for business users with SAP Fiori.
• What is SAP Fiori and why it matters to you
• How a better user experience drives measurable business benefits
• How to get started with SAP Fiori today
• How SAP Fiori elements accelerates application development
• How SAP Build Code includes SAP Fiori tools and other generative artificial intelligence capabilities
• How SAP Fiori paves the way for using AI in SAP apps
DevOps and Testing slides at DASA ConnectKari Kakkonen
My and Rik Marselis slides at 30.5.2024 DASA Connect conference. We discuss about what is testing, then what is agile testing and finally what is Testing in DevOps. Finally we had lovely workshop with the participants trying to find out different ways to think about quality and testing in different parts of the DevOps infinity loop.
LF Energy Webinar: Electrical Grid Modelling and Simulation Through PowSyBl -...DanBrown980551
Do you want to learn how to model and simulate an electrical network from scratch in under an hour?
Then welcome to this PowSyBl workshop, hosted by Rte, the French Transmission System Operator (TSO)!
During the webinar, you will discover the PowSyBl ecosystem as well as handle and study an electrical network through an interactive Python notebook.
PowSyBl is an open source project hosted by LF Energy, which offers a comprehensive set of features for electrical grid modelling and simulation. Among other advanced features, PowSyBl provides:
- A fully editable and extendable library for grid component modelling;
- Visualization tools to display your network;
- Grid simulation tools, such as power flows, security analyses (with or without remedial actions) and sensitivity analyses;
The framework is mostly written in Java, with a Python binding so that Python developers can access PowSyBl functionalities as well.
What you will learn during the webinar:
- For beginners: discover PowSyBl's functionalities through a quick general presentation and the notebook, without needing any expert coding skills;
- For advanced developers: master the skills to efficiently apply PowSyBl functionalities to your real-world scenarios.
Accelerate your Kubernetes clusters with Varnish CachingThijs Feryn
A presentation about the usage and availability of Varnish on Kubernetes. This talk explores the capabilities of Varnish caching and shows how to use the Varnish Helm chart to deploy it to Kubernetes.
This presentation was delivered at K8SUG Singapore. See https://feryn.eu/presentations/accelerate-your-kubernetes-clusters-with-varnish-caching-k8sug-singapore-28-2024 for more details.
Pushing the limits of ePRTC: 100ns holdover for 100 daysAdtran
At WSTS 2024, Alon Stern explored the topic of parametric holdover and explained how recent research findings can be implemented in real-world PNT networks to achieve 100 nanoseconds of accuracy for up to 100 days.
UiPath Test Automation using UiPath Test Suite series, part 4DianaGray10
Welcome to UiPath Test Automation using UiPath Test Suite series part 4. In this session, we will cover Test Manager overview along with SAP heatmap.
The UiPath Test Manager overview with SAP heatmap webinar offers a concise yet comprehensive exploration of the role of a Test Manager within SAP environments, coupled with the utilization of heatmaps for effective testing strategies.
Participants will gain insights into the responsibilities, challenges, and best practices associated with test management in SAP projects. Additionally, the webinar delves into the significance of heatmaps as a visual aid for identifying testing priorities, areas of risk, and resource allocation within SAP landscapes. Through this session, attendees can expect to enhance their understanding of test management principles while learning practical approaches to optimize testing processes in SAP environments using heatmap visualization techniques
What will you get from this session?
1. Insights into SAP testing best practices
2. Heatmap utilization for testing
3. Optimization of testing processes
4. Demo
Topics covered:
Execution from the test manager
Orchestrator execution result
Defect reporting
SAP heatmap example with demo
Speaker:
Deepak Rai, Automation Practice Lead, Boundaryless Group and UiPath MVP
2. As a result of the increased use of various technologies in virtually all
areas of data mining research, obviously the good decision making is as
important as the key of successfully for the organization strategic.
Data mining gives you access to the information that you need to make
intelligent decisions about difficult business problems which somehow
be able to identify rules and patterns in data, so that you can
determine why things happen and predict what will happen in the
future. The Top-Bottom technique can be use when data form as
functions which can be calculate by equation. However in the real
world scenario, dealing with the complex data which is not always
given the accurate outcome because many cases can not be solved
with mathematical equation formula which attempt to map the
unknown factors into the algorithms. Therefore, another solution come
up with Bottom-Top technique that tend to cross validate with the
solutions from both ways which are Top-Bottom and Bottom-Top
2
3. Top-Down technique
Bottom-Up technique
As a result, the next number of this
dataset are likely to be 0, 4, 7 and
so on as we are able to map the
known factors into equation.
Unlikely the dataset at the bottom
as it need to be learn the unknown
factors from the bottom to top.
Because it could not be found in
any linear proportion data that can
be solve with equation. Instead, it
rather spread out over the graph
with unknown direction. If we still
using the equation to solve this
dataset, we hardly or never detect
any pattern or relationship at all.
So that’s why the bottom-up is
become in efficiency way, by try to
learn a data and recognize them
once the similar pattern appear
again in the dataset.
3
4. To answer the various types of businesses questions, data mining will
help you finding patterns and relations in data that is not apparent with
human eyes by analysis those dataset using mathematical algorithms
such as decision trees, segmentation, clustering, association and time
series etc. through Microsoft SQL Server technologies and confirm those
found discovery pattern for doing predictions base on the patterns in
historic . Such that the valuable information found can be used for the
various application such as financial applications, marketing & sale
forecast, CRM, ERP etc.
The most topic as discuss in this project will be using the database as
the foundation to provide the appropriate model , algorithms base on
pattern recognition or detection that found in the historical data.
4
5. To achieve the project, the following tools below are developing
tools with including within this project
Application
Microsoft SQL Database Server (MSSQL)
Microsoft SQL Server Analysis Services (SSAS)
Microsoft SQL Integration Services Connections (SSIS)
Microsoft Visual Studio C#
Microsoft Decision Tree Algorithm
Microsoft Naïve-Bayes Algorithm
Neural Network Algorithm
Hardware
Server running the SQL Database engine and Analysis Services
PC for daily gathering data source and supply to MSSQL
Server running the SSIS for daily updating the SSAS server
PC for C# coding, database, SSAS and data mining design
5
6. There are 5 phases to implement for this project
Phase I : Identify the business problems
Phase II : Data source collection
Phase III : Database transformation
Phase IV : Data mining model building
Phase V : Model Assessment
6
7. Data source
Data miningSSAS Database Server
MSSQL Database Server Neural Network
• Data Converting
• SSIS
Convert and Supplying data to MSSQL
Produce data mining
Query data from database
NNproducedatamining
7
8. To identify the business need, the experiment to demonstrate for
this project involve to the financial application which inquire the
questions as following
To help the financial department mange a currency swap. What
are/is the most factors effected to the US Dollar and Thai Baht
currency exchange rate?
And what is the next day currency exchange rate likely to be?
Let determine the definition of each inquired to identify for the
whole this presentation as following
Fundamental : As is for the financial department inquiring.
8
9. To get the answering regarding to the first phase questions, the
appropriate data need to be collected on this process which might
get the ideas from the persons whom have the particularly those
experiences background which help to narrow down the huge data
raw into the meaning full data instead gathering all those
meaningless data.
However, the data mining techniques tend to require more
historical data than the standard models and in the case of neural
networks, can be difficult to interpret.
9
10. Contents Data Source
Economic statistical indicators • Bank of Thailand
Daily Thai stock index • The Stock Exchange of Thailand
Daily Thai bank interest rate • Bank of Thailand
Daily exchanges rates • Bank of Thailand
Daily gold trading price • Bloomberg
• Thai Gold Trader
Daily crude oil prices • Bloomberg
Daily world stock index • Bloomberg
10
11. Database Tables
Once we got all expected data source, the
data transformation is begin. I wrote the
scripts using C# grabbing all those data from
the raw source and then feeding into the
MSSQL database server which will be auto
daily updating.
32 Tables
The only selected appropriated tables will be
include in this project.
Create views table as usdVSVariables
responding to selected appropriated
Fundamental Database
11
12. 12
SELECT DISTINCT
TOP (100) PERCENT dbo.ExchangeRates.DateKey,
dbo.GoldMarket.DollarPerOunce, dbo.Energy.Value AS CrudeOil,
dbo.ExchangeRates.BuyingSightBill,
StockValue.SETValue, StockValue.DJValue, InterestMRR.MRR,
DepositRate.OneYearMax
FROM dbo.ExchangeRates INNER JOIN
dbo.Energy ON dbo.ExchangeRates.DateKey = dbo.Energy.DateKey INNER
JOIN
dbo.GoldMarket ON dbo.Energy.DateKey = dbo.GoldMarket.DateKey INNER
JOIN
(SELECT T.DateKey, T.Value AS SETValue, D.Value AS DJValue
FROM dbo.StockMarket AS T INNER JOIN
dbo.StockMarket AS D ON T.DateKey = D.DateKey
WHERE (T.Symbol = 'SET') AND (D.Symbol = 'DowJones')) AS
StockValue ON dbo.GoldMarket.DateKey = StockValue.DateKey INNER JOIN
(SELECT DateKey, BankName, MRR
FROM dbo.LoanInterestRate
WHERE (BankName = 'Bangkok Bank')) AS InterestMRR ON
StockValue.DateKey = InterestMRR.DateKey INNER JOIN
(SELECT DateKey, BankName, OneYearMax
FROM dbo.DepositInterestRate
WHERE (BankName = 'Bangkok Bank')) AS DepositRate ON
InterestMRR.DateKey = DepositRate.DateKey
WHERE (dbo.ExchangeRates.DateKey > 19991231) AND (dbo.ExchangeRates.Currency =
'USD') AND (dbo.GoldMarket.DollarPerOunce > 0)
SQL Code
15. 15
SSAS Sample (Internet connection required) Or follow this link
http://www.youtube.com/watch?v=xjEy-zNE9P8
16. At this point, I will divide two demonstrations into two different
sections which are
Fundamental : Predict USD-Thai currency rate exchanges
Customers : Identifying perspective customers who are a potential
Let get start the Fundamental data mining implementation first. The
standard approach to modeling the fundamental factors returns the
currency exchange rates is to model the whole attributes associated
as the input variables to predict Thai Baht per dollar as the result by
analyzing the most influent effective factors.
Mining Structure
Data source from SSAS server
Data for training and testing is 70:30
Data type as discretized
Key : DateKey
16
17. In order to illustrate what are/is the most important variables for the prediction
of Thai Baht per dollar, I aim using hybrid algorithms approach to utilize each
advantages with including a Decision tree, Naïve Bayes to classify which variables
to use for input in the Neural Network algorithm. The decision tree is capable
of detecting rules like “if A then B” However, dealing with continuous values is
not work quite well like “if A then 2.5” but tries to split the node as “if A is > 20
then B” So, that’s why the Neural Network would take over the outcomes given
as the numeric data to compare its results against the Decision Tree. Such that,
my approach to forecast Thai Baht per dollar will be more accurate base on the
associated variables which can be more efficiency predicted the approximately
the next day as the result.
Decision Tree
Neural Network
Input
Variable 2
Variable 3
Variable 4
Variable 5
Variable 6
Variable 1
?
?
?
?
Classify
Variable 2
Variable 6
17
Naïve Bayes
Input
?
?
?
18. All associated variables can be retrieved by survey,
by using external data research, or by discuss to
persons who have those experience background.
The advantage of using several factors to perform
the forecasting instead depend on only one factor
is they can cross validate the result which provide
more quality and precisely of data interpreted
outcome.
Variable Description Usage
SETValue Thai stock index (SET) Input
DJValue Dow Jones index Input
CrudeOil Crude Oil dollar per barrel Input
DollarPerOunce Gold price dollar per ounce Input
BuyingSightBill Thai Baht per USD currency rate Output – Predicted
DateKey Date dimension Key column
18
19. In order to get the whole picture of how each attribute related to predicted
value, typically we need to retrieve entirely those attributes historically in
database which will be given an idea of main pattern occurred in the big
cycle for
determining
a ceiling and
floor of data
range. Then
later on we
can spot or
narrow down
in data range
for seeking a
pattern in a
small cycle
base on a big
cycle.
10 Years Data range
1 Year Data range
19
20. 10 Years Gold Price Dollar Per Ounce and
Baht Per USD Currency Relationship Graph
From Jan-01-2000 To Dec-31-2010
DollarPerOunce
20
21. CrudeOil
10 Years Crude Oil USD/Barrel and
Baht Per USD Currency Relationship Graph
From Jan-01-2000 To Dec-31-2010
21
22. 10 Years Thai SET Index and
Baht Per USD Currency Relationship Graph
From Jan-01-2000 To Dec-31-2010
SETValue
22
23. 10 Years Dow Jones Index and
Baht Per USD Currency Relationship Graph
From Jan-01-2000 To Dec-31-2010
DJValue
23
24. Decision tree can help identify which factors to be considered
and how each factor has historically been associated with
different outcomes of decision.
Concept : Decision Tree is a classification makes predictions base
on the relationships between input columns in a dataset by
creating a series of splits or nodes in the trees. The algorithm
adds a node to the model every time an input column is found to
be significantly correlated with the predictable columns. To get
the big cycle of data range, in this scenario the algorithms build
2 discretized containing in buckets as following
After process decision tree now it
help to determining which variable
most effected to value under 38.32 and above 38.32
Attribute Baht per USD
Bucket 1 < 38.32
Bucket 2 >= 38.32
24
25. Dependency Network
Displays the relationships between the attributes that contribute the least
and most important factors to the predictive attribute. The center node of
the chart represents
the predictable
attribute and all
nodes around
represent the input
factors attribute.
The number 1 is the
most important factor
while 4 is the least.
As the diagram,
the SET Value is the
least factor influential. Therefore, it is first disappeared by adjusting then
Crude Oil, DJ Value and Dollar Per Ounce in order. As the result, decision
tree will automatically create tree node in order by most important to least.
1
2
4
3
25
26. Trees Nodes
Typically, the decision trees is the classification model that contains all cases at the
root node then split itself into the most several influential cases or we call children
nodes which is Value – vEnergy and then each children node split themselves into
the second important factor then split it again until there is no more cases can be
split which is least important or we call leaf nodes as a diagram below.
According to this, the pink histogram represent
value < 38.32 in the opposite green represent
value >= 38.32 which each node split it own into
3 DollarPerOunce node along with data range
and color to indicate the meaning categories.
26
27. Histogram
Each node might contain only pure single factor or a multi factors in a same
node which contribute statistics ,cases supported and probability as
representing by histogram. These histogram indicate percentage of node
that effect to cases for example if we start travel from root node through
node DollarPerOunce < 543.445 with high percentage histogram represent
by green stripe along with 906 cases, probability 92.65% which imply these
node determine value of Baht/USD greater than 38.32
Even through DJValue were split into greater than 10532 and less than
10532 but both nodes are support Baht/USD > 38.32 as well. Apparently
the only different is they were grouped by two categories that either possibly
can be fall into those node.
If we consider on DJValue and Baht/USD relationship chart, that would help
you understand more clearly.
27
29. After processing decision tree, nodes contain low histogram is not influent to predicted
value instead only the most pure color would be include for interpreting.
As a result gold price is the most influent for determining Baht/USD direction. If gold
price is going up, seem likely impact to Baht/USD going down in the opposite direction.
In contrast if gold price is going down then Baht/USD is going up in conversely way.
The dependency
network will help to
confirm Gold price
is most important in
tree algorithm which
can be prove by
looking at the next
level of node gold
price 543.44-862.84.
It split into 3 nodes
of Thai SET index.
Although they are all
most high histogram
but they are seem
likely meaningless.
Because the process
29
38.32
DollarPerOunce
Gold>543.44
30. 30
repeats recursively for each child that given the whole range of SET value
which can be any zone of SET range. However under Baht/USD 38.32 with
Gold price 543.44 – 862.84, there are 3 SET nodes
supporting this scenario possibly occurred.
Apparently, the same observation is
applied for node under gold price below
543.44 which can
be explained on
figures page 27- 28.
For instance,
If gold price drop
below 543.44 with
any range of Dow
Jones are likely to
impact Baht/USD
is going up.
38.32
SETValue
Zone 1
Zone 3
Zone 1
Zone 2
Zone 3
31. 31
Even Decision tree can classify dataset into each segmentation and can point out what is
the most important variable impact to predicted value. However the disadvantage of tree
is built with univariate at root and splits at each node, as each split is made the data is
split base on recursive from root node to leaf node where is usually very little data left to
make a decision. For instance, recall from previous figure under gold price 543.44 –
862.84 node there are 3 nodes splitting which are SET value but those nodes can not
specify exactly what data range of SET are, instead they are given all zone possibly.
Because those 3 nodes are made decision base on their parent node recursively.
Unlikely a Naïve-Bayes, each attribute made decision independence with their own base
on predicted value directly and not recursive from any others nodes. An classifier is made
at leaf nodes. For instance Are small companies with annual profits of more than $500K a
bad credit risk? Are large companies with annual profits in the negative still a good credit
risk? Naïve-Bayes does not consider combinations of attributes like decision tree. So, if
decision tree segments the data that is consider an essential part of big picture then each
segment of data represented by a leaf is described through a Naïve-Bayes.
Absolutely it depend on what is/are business problem defined, if we only looking for the
big picture of data then decision tree would be provide enough information. But if we
need to focus on ,or likely to explore the others attributes those are not depend on big
picture then we need a Naïve-Bayes for this task.
In this case, node Gold price is a big picture as when travel through entirely tree to leaf
node include each path from root. Unfortunately, at the leaf node contain little data which
might be important as well if we process with a Naïve-Bayes at the leaf.
32. 32
1
4
3
2
Dependency Network
After executed a Naïve-Bayes, Dependency Network is given a result of order
important attribute differ from Decision Tree. Crude Oil is a second most important
attribute instead Dow Jones. That because Crude Oil is classified independency
directly into Baht/USD
as same as to others
attribute as well.
However a gold price
still be the first important
one.
Considering an attribute
profiles as each attributes
states by data range that
that represent by color
on the next page.
Baht/USD is split into two cases which are
>= 38.32 and < 38.32 and it seem a case
>= 38.32 is more reliable than case < 38.32
because there are less segmentation than
< 38.32. Therefore those input attributes
has a meaningful of relationship to Baht/USD.
33. 33
Attribute Profiles
Figure on the left shows each
attributes corresponding to Baht-
USD. A pure color indicate the
highest probability occurred.
Such that gold price is very
confidence for determining with
blue contains value below 543.44
is 96% probability support
Baht/USD >= 38.32. In contrast
with the same attribute and data
range fall in a case < 38.32 only
0.83% probability but 50:41 port
potion with value greater than
543.44 instead.
Analyzing the result
Significantly, gold price and crude oil are likely conversely to Baht/USD in the opposite
direction. Since gold price, crude oil price are drop then make Baht/USD going up.
Unlikely Dow Jones and SET are quite not in linear data relationship (Figure page 28
and 30) so they can be either under and above 38.32 zone. For instance Dow Jones
with below and above 1053.85 is 68:32 probability fall in value >= 38.32 and can be <
38.32 as well with probability 34:66. Therefore, Dow Jones and SET value are not quite
well confidence determining Baht/USD direction in Naïve Bayes algorithm that is why
they are low important impacted in dependency network.
34. 34
CrudeOil
38.32
In this phase, I use tools to determine the accuracy of the models that were created,
and examine the models to determine the meaning of discovered patterns and how to
apply to business. For example, a model may determine that Baht/USD is dropped if
gold price or crude oil is going up.
Obviously, a dataset in linear relationship is more meaningfulness than data in random.
Although 10 years gold
price and crude oil
historical dataset can
be the most
appropriate input
attributes to process
data mining.
Occasionally, the same
attribute might
doesn’t contain any
useful patterns with
a different data ranges.
For examples 1 year
of crude oil historical
dataset might contain
35. 35
non linear dataset. But, SET might contains a well useful patterns instead. So it depends
on business needs what try to approach. If only focus on a main scope, then algorithms
One year Baht/USD - Crude Oil Historical
with discretized content under a large historical dataset would be the best fit for this
application. In the other hand, a small of historical dataset with numeric content might be
a best solution for application that focus on a real linear number calculation such as daily
stock forecasting. Because in a large dataset will take a lot of time consuming to produce
the result. Even with a high performance computer especially to produce Neural Network
result which might take a whole month to learn and searching just a small pattern under
a multi attribute input.
Therefore a good approach for a generic result is likely to build a several model using
different algorithms and then compare the accuracy of these models.
One year Baht/USD - SET Historical
36. 36
The accuracy of an
algorithm depends on
the nature of the data,
data range and an
appropriate algorithm.
You may need to repeat
Classification Matrix
the data cleaning and transformation in order to derive more meaningful variables. Then
determine the big picture of dataset with created algorithms. However if the relationships
among attributes are complicated, a neural network may perform better.
Essentially it is very important to work with business analysis who have the proper domain
knowledge to validate to discoveries as a bottom line before deploying those patterns
discovered by data mining to a production used.
Similar to this experiment, a big picture pattern is found by a Decision Tree and Naïve-
Bayes algorithms with a couple input attribute as gold price and crude oil need to be
validated before we move to another step.
However, to accomplish this project I will assume those attributes are the most important
to determine Baht/USD direction as a big picture. For the next step, a Neural Network is a
next algorithm be used for learning and searching a dataset that derived from a previous
algorithms output by attempting form those found pattern in a linear relationship.
37. 37
Recall from the beginning of this presentation, the unknown dataset pattern can be solve
by bottom-up technique. A Neural Network is a good approach for solving a complicated
data as long as the input attributes are the right one.
CONCEPT
Basically, a neural network (NN) is an algorithm based on the operation of biological, in
other words, is an emulation of human brain. It designed to think like a human brain by
learning problems and later solve the others with similar problems.
In the human brain action potentials are the electric signals that neurons use to convey
information to the brain and travel through the net using what is called the synapse. As
this signals are identical, the brain determines what type of information is being received
based on the path that signal took. The brain analyzes the patterns of signals being sent
from that information it can interpret the type of information being received.
To emulate that behavior, the artificial neural network has several components: the node
plays the role of the neuron, the weights are the links between the different nodes, so it
is what the synapse is in the biological net. The input signal is modified by the weights
and summarized to obtain the total input value for a specific node (diagram next page).
There are three layers in a NN: the input layer which holds one node for each input
variable; the bias layer, where there could be several internal layers; and the output
layer that holds the result set. An activation function is used to amplify the results of
that input and obtain the value of particular node.
38. 38
Neuron scheme
Node scheme
A diagram illustrates a neuron scheme, received
the information from others neuron as the input via
a synapse while the connections between neuron
and others forming like a branch or a network. Once
the input is large than determined threshold then
neurons will be fired according to that corresponding
received information.
Similarly to a node scheme does, the perceptron is
In
In
In
Perceptron
taking a weighted sum of inputs and sending the output to others node member, if the
sum is greater than some adjustable threshold value. The inputs x1, x2, x3..xm and
connection weights w1,w2,w3,wm are typically real values. If the feature of some xi tends
to cause the perceptron to
fire, the weight wi will be
positive but if the feature
xi inhibits the perceptron,
the weight wi will be negative
The perceptron consists of
weights, the summation
processor and adjustable
threshold processor or bias
input. A bias input might get
more weight than others
regular input then it comes
39. 39
affecting firing the activate function. There are several algorithms used in neural networks.
The backpropagation is the one of most popular which is used in this project.
Typically, what the backpropagation algorithm does is to propagate backwards the error
obtained in the output layer while comparing the calculated value in the nodes to the real
or desired value. This propagation is made by distributing the error and modifying the
weights or links between the previous and present nodes. Going backwards, the values
of the nodes in the bias input can be modified and so can be the weights between the
input and bias input, but not the values of the nodes in the regular input as they are the
values of the variables we are using. Once the algorithm got to the input layer it goes
again forward with the new modified weights and calculates the results in the output layer
again. This process is repeated until a minimum error is reached.
GOLD
SET
w1
w2
BipolarSigmoid
Function
f Output
One node scheme
Perceptron
As explained on the right, there
are two input attributes, one bias
in the first layer pass forward its
weights to perceptron then sum
the inputs and sending to the
output layer.
The output layer is fired through
the activation function. This entire
process run 20 nodes as the first
layer to produce one output layer
And the following steps are carried
out how it’s work.
BIAS
w3
40. 40
Learning Process
•Split data into 2 set, 85 % training set and 15% for validating.
•Randomly 20 values of each gold price and SET weights from training set.
•Generate the weights for the between the nodes.
•Compare how accuracy the outputs to the actual data (validating set).
•Calculate the learning errors.
•Adjustable the output errors for getting improvement on the results.
•Contribute a new lot of the training set and repeat the process again
until a minimum learning error outputs is reached.
Implementation
•Gold price data range : 1062 – 1413
•SET data range : 684 – 1047
•1 year data range Jan-01-2010 to Dec-31-2010
•24 Hours total learning process time.
•Query statement from SQL Server
Here is how the
learning process
work as it keep try to
recognize the pattern
against the actual
value and solving the
problem with equation.
(Internet connection
required) Or just follow
this link
http://www.youtube.com/watch?v=7ghfX6kK5bo
41. 41
Performance
Due to the learning process quite take so long so it came up with 24 hours for
this experiment which was given total error was 33.43 and 0.14 average error.
Absolutely, it will take only a few minutes to generate the result if data range is
in a month or 10 days but the performance is going down as a result.
One year Baht/USD – Gold Price Result One year Baht/USD – SET Result
This validation given Baht/USD predicted as 33.01 which
is 0.16 error when compare to actual gold price as 33.17
42. 42
Even in 2009, gold price 1091.50 and 681.91 SET were not include in data
range for learning but NN still recognize the similarly pattern occurred in 2010
and try to generated the similarly output.
The occurred pattern is not only rely only on gold price but SET will help NN
to classify this pattern as well for instance in 2009 and 2010 were given the
same gold price as 1091.40 but different SET value as 686.41 and 784.38.
So Baht/USD result will be vary depend on SET input too.
VS
Predicted ResultActual
This learning error historical demonstrate
as much as it getting closer to zero, as
much as NN given an accuracy result. As the NN algorithm goes back and forth to get
the correct weights that will allow it to predict
the output variable, so the weights vary in value
from the initial randomly generated until the
final ones that comply with the error 33.43 total,
each pair of predicted and actual value 0.14
average error different, 0.0002 min and 0.58
max have been found in the learning historical.
43. 43
Implement Neural Network learning video (Internet connection Required)
Or follow this link http://www.youtube.com/watch?v=VRiMbG6XIpk
44. 44
Summary
To answering as financial department inquiring for predicting Thai Baht against
USD currency exchange rate, A Neural Network is a bottom line of this
experiment that derived the classified input attribute from Decision Trees and
Naïve Bayes through the process to analyze using SQL Database and SSAS
to reach the goal of Baht/USD prediction movement in a numeric data, also
covering data pattern recognition with a several algorithms i.e.. classification,
segmentation, approximation, and back propagation approached.
References
3.Neural Network on C# By Andrew Krillov
4.Delivering Business Intelligence By Brian Larson
5.Neural Network, from Wikipedia
6.Back Propagation, from Wikipedia
7.Decision Tree, from Wikipedia
8.Naïve Bayes, from Wikipedia