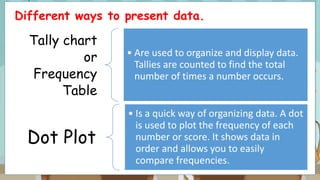
Good Morning!
Monday, April 12, 2021
Math
(Collecting and Analyzing Data)
REVIEW:
Solve:
If a rectangular prism is 6 cm long, 4 cm wide,
and 10 cm tall, what is its volume?
Let’s have a survey!
How do we collect information?
To collect data or pieces of information we use
surveys and questionnaires.
A questionnaire is any written set of questions,
while a survey is both the set of questions and
the process of collecting and analyzing the
responses from those questions.
Data can be classified into two.
CATEGORY
DATA
•Described in words such as
“favorite subjects” or
“favorite colors”
DISCRETE
DATA
•Described using numbers
such as “number of
marbles” or “height of grade
4 learners”
A variable is any characteristics, number, or quantity that can be measured or counted. A variable may also be called a data
item.
Statistical Variables
A variable is any characteristics, number, or
quantity that can be measured or counted.
A variable may also be called a data item. (e.g.
“favorite colors”, “number of marbles”)
Example of Survey Questions:
1. What movie is the most favorite?
2. Which day of this week is the warmest.
A variable is any characteristics, number, or quantity that can be measured or counted. A variable may also be called a data
item.
Variables
Category
Data
“favorite
colors”
“favorite foods”
Discrete
Data
“number of grade 4
learners who plays
Minecraft”
“quiz scores”
Statistical Investigation
A variable is any characteristics, number, or quantity that can be measured or counted. A variable may also be called a data
item.
Example: Leo examined his 10 quiz scores in Math, as shown
in the table below.
8 10 9 7 5 6 8 10 8 7
SCORES TALLIES FREQUENCIES
5 I 1
6 I 1
7 II 2
8 III 3
9 I 1
10 II 2 5 6 7 8 9 10
Different ways to present data.
Tally chart
or
Frequency
Table
• Are used to organize and display data.
Tallies are counted to find the total
number of times a number occurs.
Dot Plot
• Is a quick way of organizing data. A dot
is used to plot the frequency of each
number or score. It shows data in
order and allows you to easily
compare frequencies.
A variable is any characteristics, number, or quantity that can be measured or counted. A variable may also be called a data
item.
Example: Andrea and Nikki surveyed 20 pupils about their
favorite snack. To keep track of their gathered data, they
made a tally chart.
RESPONSES
Tallies IIII - II IIII - IIII IIII - III IIII
Frequencies
1. How many pupils like biscuits?
2. How many pupils like sandwiches?
3. How many pupils like chips?
4. What is the total frequency?
5. Which is the most favorite snack of the pupils? The least
favorite snack?
A variable is any characteristics, number, or quantity that can be measured or counted. A variable may also be called a data
item.
Exercise 1: Gabby recorded the color of the cars parked
every Monday morning in the school’s parking lot.
CAR COLORS TALLIES FREQUENCIES
RED WHITE BLUE BLACK RED WHITE
BLUE SILVER RED BLUE RED YELLOW
8
9
2
6
5
0
1
2
3
4
5
6
7
8
9
10
Banana Mango Durian Lanzones Mangosteen
Favorite Fruits
Fruits
Number
of
Pupils
8
9
2
6
5
0
1
2
3
4
5
6
7
8
9
10
Banana Mango Durian Lanzones Mangosteen
Favorite Fruits
Fruits
Number
of
Pupils
A bar graph is a chart with rectangular bars with lengths
proportional to values that they represent.
It is used
to show
and
compare
data.
8
9
2
6
5
0
1
2
3
4
5
6
7
8
9
10
Banana Mango Durian Lanzones Mangosteen
Favorite Fruits
Fruits
Number
of
Pupils
TITLE – tells who & what
the graph is about.
VERTICAL (y axis) – tells
what is being counted.
BAR LABELS – tells
specific type of data.
HORIZONTAL (x axis) – tells
what data is being collected.
SCALE –
tells the
amount of
data.
BARS – represent
the data amount
for each group.
LEGEND– explains the
data being presented.
2 Types of Bar Graphs
A B
How to construct a bar graph?
Example: Five teams of a grade 4 class collected empty cans and
plastic bottles for recycling.
Data Recorded:
TEAM A = 60 kg TEAM C = 60 kg TEAM E = 85 kg
TEAM B = 73 kg TEAM D = 70 kg
TEAMS EMPTY CANS AND PLASTIC BOTTLES COLLECTION (in kg)
TEAM A 60
TEAM B 73
TEAM C 60
TEAM D 70
TEAM E 85
The given data can be organized in a table as shown below.
12
5
6
10
8
0
2
4
6
8
10
12
14
Doughnut French Fries Banana Cue Cheeseburger Cookies
Favorite Snack Items
Snacks
Number
of
Pupils
A variable is any characteristics, number, or quantity that can be measured or counted. A variable may also be called a data
item.
Summing Up
1. Statistical variable is any characteristics, number, or
quantity that can be measured or counted.
2. Category data is described in words such as “favorite
subjects” or “favorite colors”
3. Discrete data is described using numbers such as
“number of marbles” or “height of grade 4 learners”
4. The use of tables, tally charts, frequency tables and
dot plot are some ways to organized and display data.
5. Bar graph is used to show and compare data. It may
either be horizontal or vertical.
A variable is any characteristics, number, or quantity that can be measured or counted. A variable may also be called a data
item.
Let’s check your understanding.
1. What is the difference between category
data and discrete data?
2. How will you present gathered data?
3. What are the parts of a graph?
4. What is the difference between vertical bar
graph and horizontal bar graph?
5. What is the purpose of bar graph?
A variable is any characteristics, number, or quantity that can be measured or counted. A variable may also be called a data
item.
Offline Activity
Week 5: 04/12/21 Offline Activity 4.5 – Collecting and Analyzing Data
Total points = 30
In your book, answer the following:
a. QUIZ on page 365 (A – numbers 1 and 2)
* 5 points each
b. PRACTICE on page 376 (1 and 2)
* Do this in a your Math Notebook
*10 points each
Take a clear picture of your answer and send it in the comment section.
To be submitted on or before Monday, 04/19/21.
Thank you!

4.5 collecting and analyzing data

  • 1.
    Good Morning! Monday, April12, 2021 Math (Collecting and Analyzing Data)
  • 2.
    REVIEW: Solve: If a rectangularprism is 6 cm long, 4 cm wide, and 10 cm tall, what is its volume?
  • 3.
  • 4.
    How do wecollect information? To collect data or pieces of information we use surveys and questionnaires. A questionnaire is any written set of questions, while a survey is both the set of questions and the process of collecting and analyzing the responses from those questions.
  • 5.
    Data can beclassified into two. CATEGORY DATA •Described in words such as “favorite subjects” or “favorite colors” DISCRETE DATA •Described using numbers such as “number of marbles” or “height of grade 4 learners”
  • 6.
    A variable isany characteristics, number, or quantity that can be measured or counted. A variable may also be called a data item. Statistical Variables A variable is any characteristics, number, or quantity that can be measured or counted. A variable may also be called a data item. (e.g. “favorite colors”, “number of marbles”) Example of Survey Questions: 1. What movie is the most favorite? 2. Which day of this week is the warmest.
  • 7.
    A variable isany characteristics, number, or quantity that can be measured or counted. A variable may also be called a data item. Variables Category Data “favorite colors” “favorite foods” Discrete Data “number of grade 4 learners who plays Minecraft” “quiz scores” Statistical Investigation
  • 8.
    A variable isany characteristics, number, or quantity that can be measured or counted. A variable may also be called a data item. Example: Leo examined his 10 quiz scores in Math, as shown in the table below. 8 10 9 7 5 6 8 10 8 7 SCORES TALLIES FREQUENCIES 5 I 1 6 I 1 7 II 2 8 III 3 9 I 1 10 II 2 5 6 7 8 9 10
  • 9.
    Different ways topresent data. Tally chart or Frequency Table • Are used to organize and display data. Tallies are counted to find the total number of times a number occurs. Dot Plot • Is a quick way of organizing data. A dot is used to plot the frequency of each number or score. It shows data in order and allows you to easily compare frequencies.
  • 10.
    A variable isany characteristics, number, or quantity that can be measured or counted. A variable may also be called a data item. Example: Andrea and Nikki surveyed 20 pupils about their favorite snack. To keep track of their gathered data, they made a tally chart. RESPONSES Tallies IIII - II IIII - IIII IIII - III IIII Frequencies 1. How many pupils like biscuits? 2. How many pupils like sandwiches? 3. How many pupils like chips? 4. What is the total frequency? 5. Which is the most favorite snack of the pupils? The least favorite snack?
  • 11.
    A variable isany characteristics, number, or quantity that can be measured or counted. A variable may also be called a data item. Exercise 1: Gabby recorded the color of the cars parked every Monday morning in the school’s parking lot. CAR COLORS TALLIES FREQUENCIES RED WHITE BLUE BLACK RED WHITE BLUE SILVER RED BLUE RED YELLOW
  • 12.
    8 9 2 6 5 0 1 2 3 4 5 6 7 8 9 10 Banana Mango DurianLanzones Mangosteen Favorite Fruits Fruits Number of Pupils
  • 13.
    8 9 2 6 5 0 1 2 3 4 5 6 7 8 9 10 Banana Mango DurianLanzones Mangosteen Favorite Fruits Fruits Number of Pupils A bar graph is a chart with rectangular bars with lengths proportional to values that they represent. It is used to show and compare data.
  • 14.
    8 9 2 6 5 0 1 2 3 4 5 6 7 8 9 10 Banana Mango DurianLanzones Mangosteen Favorite Fruits Fruits Number of Pupils TITLE – tells who & what the graph is about. VERTICAL (y axis) – tells what is being counted. BAR LABELS – tells specific type of data. HORIZONTAL (x axis) – tells what data is being collected. SCALE – tells the amount of data. BARS – represent the data amount for each group. LEGEND– explains the data being presented.
  • 15.
    2 Types ofBar Graphs A B
  • 16.
    How to constructa bar graph? Example: Five teams of a grade 4 class collected empty cans and plastic bottles for recycling. Data Recorded: TEAM A = 60 kg TEAM C = 60 kg TEAM E = 85 kg TEAM B = 73 kg TEAM D = 70 kg TEAMS EMPTY CANS AND PLASTIC BOTTLES COLLECTION (in kg) TEAM A 60 TEAM B 73 TEAM C 60 TEAM D 70 TEAM E 85 The given data can be organized in a table as shown below.
  • 17.
    12 5 6 10 8 0 2 4 6 8 10 12 14 Doughnut French FriesBanana Cue Cheeseburger Cookies Favorite Snack Items Snacks Number of Pupils
  • 18.
    A variable isany characteristics, number, or quantity that can be measured or counted. A variable may also be called a data item. Summing Up 1. Statistical variable is any characteristics, number, or quantity that can be measured or counted. 2. Category data is described in words such as “favorite subjects” or “favorite colors” 3. Discrete data is described using numbers such as “number of marbles” or “height of grade 4 learners” 4. The use of tables, tally charts, frequency tables and dot plot are some ways to organized and display data. 5. Bar graph is used to show and compare data. It may either be horizontal or vertical.
  • 19.
    A variable isany characteristics, number, or quantity that can be measured or counted. A variable may also be called a data item. Let’s check your understanding. 1. What is the difference between category data and discrete data? 2. How will you present gathered data? 3. What are the parts of a graph? 4. What is the difference between vertical bar graph and horizontal bar graph? 5. What is the purpose of bar graph?
  • 20.
    A variable isany characteristics, number, or quantity that can be measured or counted. A variable may also be called a data item. Offline Activity Week 5: 04/12/21 Offline Activity 4.5 – Collecting and Analyzing Data Total points = 30 In your book, answer the following: a. QUIZ on page 365 (A – numbers 1 and 2) * 5 points each b. PRACTICE on page 376 (1 and 2) * Do this in a your Math Notebook *10 points each Take a clear picture of your answer and send it in the comment section. To be submitted on or before Monday, 04/19/21. Thank you!