1. www.colliers.com/houston
Q2 2013 | INDUSTRIAL MARKET
2%
3%
4%
5%
6%
7%
8%
-500,000
0
500,000
1,000,000
1,500,000
2,000,000
2,500,000
3,000,000
Absorption New Supply Vacancy
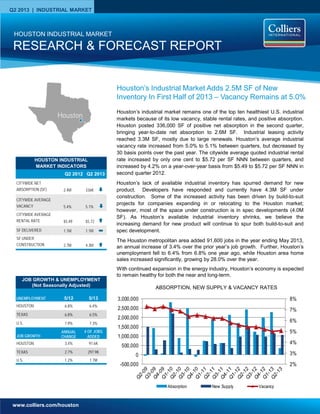
Houston’s industrial market remains one of the top ten healthiest U.S. industrial
markets because of its low vacancy, stable rental rates, and positive absorption.
Houston posted 336,000 SF of positive net absorption in the second quarter,
bringing year-to-date net absorption to 2.6M SF. Industrial leasing activity
reached 3.3M SF, mostly due to large renewals. Houston’s average industrial
vacancy rate increased from 5.0% to 5.1% between quarters, but decreased by
30 basis points over the past year. The citywide average quoted industrial rental
rate increased by only one cent to $5.72 per SF NNN between quarters, and
increased by 4.2% on a year-over-year basis from $5.49 to $5.72 per SF NNN in
second quarter 2012.
Houston’s lack of available industrial inventory has spurred demand for new
product. Developers have responded and currently have 4.3M SF under
construction. Some of the increased activity has been driven by build-to-suit
projects for companies expanding in or relocating to the Houston market;
however, most of the space under construction is in spec developments (4.0M
SF). As Houston’s available industrial inventory shrinks, we believe the
increasing demand for new product will continue to spur both build-to-suit and
spec development.
The Houston metropolitan area added 91,600 jobs in the year ending May 2013,
an annual increase of 3.4% over the prior year’s job growth. Further, Houston’s
unemployment fell to 6.4% from 6.8% one year ago, while Houston area home
sales increased significantly, growing by 28.0% over the year.
With continued expansion in the energy industry, Houston’s economy is expected
to remain healthy for both the near and long-term.
RESEARCH & FORECAST REPORT
HOUSTON INDUSTRIAL MARKET
ABSORPTION, NEW SUPPLY & VACANCY RATES
Houston’s Industrial Market Adds 2.5M SF of New
Inventory In First Half of 2013 – Vacancy Remains at 5.0%
UNEMPLOYMENT 5/12 5/13
HOUSTON 6.8% 6.4%
TEXAS 6.8% 6.5%
U.S. 7.9% 7.3%
JOB GROWTH
ANNUAL
CHANGE
# OF JOBS
ADDED
HOUSTON 3.4% 91.6K
TEXAS 2.7% 297.9K
U.S. 1.2% 1.7M
JOB GROWTH & UNEMPLOYMENT
(Not Seasonally Adjusted)
HOUSTON INDUSTRIAL
MARKET INDICATORS
Q2 2012 Q2 2013
CITYWIDE NET
ABSORPTION (SF) 2.4M 336K
CITYWIDE AVERAGE
VACANCY 5.4% 5.1%
CITYWIDE AVERAGE
RENTAL RATE $5.49 $5.72
SF DELIVERED 1.1M 1.1M
SF UNDER
CONSTRUCTION 2.7M 4.3M
Houston
2. RESEARCH & FORECAST REPORT | Q2 2013 | HOUSTON INDUSTRIAL MARKET
COLLIERS INTERNATIONAL | P.2
Vacancy & Availability
Although 1.0M SF of new inventory
delivered during the second quarter,
Houston’s industrial vacancy rate only
increased from 5.0% to 5.1% between
quarters. The average industrial
vacancy rate decreased by 30 basis
points from 5.4% reported in the
second quarter 2012.
At the end of the second quarter,
Houston had 24.5M SF of vacant
industrial space citywide, 700K SF
more than the previous quarter.
Among the major industrial corridors,
the Southeast Corridor has the largest
amount of vacant space with 5.2M SF
(6.7% vacancy), followed by the North
Corridor with 4.7M SF vacant (6.4%
vacancy), the Northwest Corridor with
4.4M SF vacant (3.4% vacancy), and
the Southwest Corridor with 3.7M SF
vacant (5.8% vacancy).
Houston’s industrial construction
pipeline had 4.3M SF of projects
underway at the end of the second
quarter, including 4.0M SF of spec
development. The largest project
under construction is a 3-building,
611,000-SF spec distribution
warehouse complex located in North
Houston at Imperial Valley Dr. and
FM 1960, near George Bush
Intercontinental Airport. A list of
additional buildings currently under
construction can be found on Page 4
of this report. The largest build-to-suit
project in the pipeline is a 181,900-SF
office/warehouse located on Central
Green Boulevard in North Houston.
GAC Energy & Marine Services will
occupy the building which will be
completed in third quarter 2013.
Rental Rates
Houston’s citywide average quoted
industrial rental rate for all product
types increased from $5.71 to $5.72
per SF NNN in the second quarter,
and increased by 4.2% on a year-
over-year basis from $5.49 per SF
NNN. By property type, the average
quoted NNN rental rates are as
follows: $5.38 per SF for Distribution
space; $4.44 per SF for Bulk Logistics
space; $8.10 per SF for Flex/Service
space; with Tech/R&D space
averaging $10.77 per SF.
Absorption & Demand
Houston’s industrial market posted
336,000 SF of positive net absorption
in the second quarter, bringing the
2013 year-to-date total to 2.6M SF of
positive net absorption. The
Northwest and Inner Loop Corridor
submarkets outperformed all others in
the second quarter, posting the
largest positive net quarterly
absorption of 408K SF and 248K SF
respectively.
There were several major tenant
move-ins contributing to net
absorption gains in the second
quarter, including Deep Down, Inc.
(215,000 SF); Mattress One (46,800
SF); Office Pavilion (44,000 SF);
Aluminum Screen Manufacturers, Inc.
(40,600 SF); and Utilitech Power
Products, LLC ( 16,960 SF).
Leasing
Houston’s industrial leasing activity
reached 3.2M SF in the second
quarter. A list of select second
quarter industrial lease transactions
are included in the table below.
Building Name/Address Submarket SF Tenant Lease Date
6400 Hollister Northw est Near 222,000 Krausz Houston One, LLC1,2
Jun-13
18511 Beaumont Hw y Northeast Hw y 90 215,000 Deep Dow n, Inc. Jun-13
11503 Hightw ay 225 East-SE Far 210,000 Jacobson Warehouse Co2
Jun-13
88 Jensen Dr - Bldg B CBD 124,810 DSI Logistics2
Apr-13
8503 Citypark Loop Northeast Hw y 90 114,000 Exel2
Apr-13
415 W Crosstimbers Northw est Near 91,860 Crosstimbers AB Mayfield, LLC1,2
May-13
16685 Air Center Blvd North Hardy Toll Rd 64,800 Crane Worldw ide Apr-13
10735 W Litlle York Rd - Bldg 2 Northw est Inner Loop 44,000 Office Pavilion Apr-13
9990 E I-10 Fw y Southeast Outer Loop 40,000 Rock Wool Manufacturing Company2
Apr-13
7607 Bluff Point Dr North Fw y/Tomball Pky 39,278 The New dell Company3
Apr-13
7502 Mesa Northeast Hw y 90 39,058 T&B Master Logistics Apr-13
10648 West Little York Northw est 36,000 Freudenberg Oil & Gas Jun-13
10200 New Decade Dr East-SE Far 32,000 Furmanite America, Inc Apr-13
Eastport 6 Southeast Outer Loop 31,165 Blickman, Inc.2
May-13
3360 Rogerdale Southw est Outer Loop 28,846 Blue Line Foodservice Distribution Apr-13
Willow bend Distribution Center Southw est Far 26,453 Pfillo, LLC Apr-13
Q2 2013 Top Industrial Leases
1 Colliers International transaction
2 Renewal
3 Expansion
3. RESEARCH & FORECAST REPORT | Q2 2013 | HOUSTON INDUSTRIAL MARKET
COLLIERS INTERNATIONAL | P.3
Houston Industrial Market Summary
Houston industrial sales activity
remained steady between quarters
with 91 property sales recorded in
Q2 2013, compared to 90 in Q1
2013. Two of the sales transactions
that occurred in Q2 2013 are
summarized at right.
Sales Activity
Q2 2013
Total Volume: $410.6M
No. of Properties: 91
Total SF: 10.9M
Average $/SF: $58
Average Cap Rate: 8.1%
TA Associates sold the 1.1M SF, 6-
building City Park East Industrial
Portfolio to CenterPoint Properties for
$42.6M or $40 per SF. The bulk
industrial space, located in the
Northeast Industrial Submarket, is rail-
served and 100% leased to Exel
Logistics.
Northstar Commercial Partners sold a
201,500-SF Class B industrial
warehouse to STAG Industrial
Management for $13.6M or $67 per
SF. The property was 100% leased by
CTS on a triple net lease with
approximately 8.5 years remaining on
the lease term. The property traded at
an 8.25% cap rate.Sources: Real Capital Analytics; CoStar Comps
Market Rentable Area
Direct
Vacant SF
Direct
Vacancy
Rate
Sublet
Vacant SF
Sublet
Vacancy
Rate
Total
Vacant SF
Total
Vacancy
Rate
2Q13 Net
Absorption
YTD 2013 Net
Absorption
2Q13
Completions
YTD 2013
Completions
SF Under
Construction
Greater Houston Total 478,412,510 23,587,717 4.9% 529,976 0.1% 24,517,693 5.1% 336,116 2,599,666 1,058,764 2,542,228 4,259,723
CBD-NW Inner Loop 11,661,716 636,402 5.5% 22,200 0.2% 658,602 5.6% 92,648 100,896 - - -
Downtown 31,715,138 1,870,241 5.9% - 0.0% 1,870,241 5.9% 169,920 (14,492) - - -
North Inner Loop 5,068,517 451,369 8.9% - 0.0% 451,369 8.9% - - - - -
SW Inner Loop 7,791,374 123,467 1.6% - 0.0% 123,467 1.6% (14,544) 10,546 - - -
Total Inner Loop 56,236,745 3,081,479 5.5% 22,200 0.0% 3,103,679 5.5% 248,024 96,950 - - -
North Fwy/Tomball Pky 15,696,110 1,372,608 8.7% 10,100 0.1% 1,382,708 8.8% (195,160) 80,357 44,000 377,272 190,742
North Hardy Toll Rd 26,018,056 1,559,511 6.0% 44,090 0.2% 1,603,601 6.2% (88,400) 78,213 275,972 566,637 1,823,971
North Outer Loop 18,051,301 1,089,697 6.0% - 0.0% 1,089,697 6.0% 104,038 (3,733) 98,391 98,391 123,391
The Woodlands/Conroe 13,827,754 647,587 4.7% - 0.0% 647,587 4.7% 56,481 108,943 74,901 94,901 20,432
Total North Corridor 73,593,221 4,669,403 6.3% 54,190 0.1% 4,723,593 6.4% (123,041) 263,780 493,264 1,137,201 2,158,536
Northeast Hwy 321 1,238,145 27,720 2.2% - 0.0% 27,720 2.2% (18,240) (18,240) - - -
Northeast Hwy 90 16,042,626 277,579 1.7% 129,000 0.8% 406,579 2.5% (4,973) 51,227 - 20,000 -
Northeast I-10 3,634,195 136,450 3.8% - 0.0% 136,450 3.8% (16,647) 13,622 - 21,000 -
Northeast Inner Loop 11,561,429 558,995 4.8% - 0.0% 558,995 4.8% (50,499) 177,501 - - -
Total Northeast Corridor 32,476,395 1,000,744 3.1% 129,000 0.4% 1,129,744 3.5% (90,359) 224,110 - 41,000 -
Hwy 290/Tomball Pky 15,106,619 809,039 5.4% - 0.0% 809,039 5.4% (139,611) (13,400) 20,000 94,300 121,175
Northwest Hwy 6 4,134,484 111,223 2.7% - 0.0% 111,223 2.7% (15,100) 8,824 - - -
Northwest Inner Loop 58,682,885 1,944,488 3.3% 96,273 0.2% 2,040,761 3.5% 349,228 617,120 - - 150,000
Northwest Near 16,471,442 671,584 4.1% 61,451 0.4% 733,035 4.5% 21,482 24,421 18,000 18,000 299,840
Northwest Outlier 13,354,337 363,528 2.7% - 0.0% 363,528 2.7% 111,614 444,435 - 355,034 980,749
West Outer Loop 22,837,505 313,537 1.4% 6,000 0.0% 319,537 1.4% 80,709 356,076 22,500 58,250 25,000
Total Northwest Corridor 130,587,272 4,213,399 3.2% 163,724 0.1% 4,377,123 3.4% 408,322 1,437,476 60,500 525,584 1,576,764
-
South Highway 35 30,570,223 1,058,523 3.5% 23,600 0.1% 1,082,123 3.5% (1,499) 92,794 - 10,672 83,000
South Inner Loop 13,132,275 786,160 6.0% - 0.0% 786,160 6.0% (60,124) (111,673) - - -
Total South Corridor 43,702,498 1,844,683 4.2% 23,600 0.1% 1,868,283 4.3% (61,623) (18,879) - 10,672 83,000
-
East I-10 Outer Loop 13,494,574 195,135 1.4% - 0.0% 195,135 1.4% (74,000) (79,600) - - -
East-SE Far 46,010,653 4,417,625 9.6% 14,250 0.0% 4,431,875 9.6% 52,829 292,832 - 292,771 365,462
SE Outer Loop 19,171,337 609,774 3.2% - 0.0% 609,774 3.2% (88,245) (236,652) - - -
Total Southeast Corridor 78,676,564 5,222,534 6.6% 14,250 0.0% 5,236,784 6.7% (109,416) (23,420) - 292,771 365,462
-
Highway 59/Highway 90 21,563,730 824,236 3.8% 50,372 0.2% 874,608 4.1% 77,677 273,207 475,000 475,000 -
Southwest Far 10,345,221 809,033 7.8% - 0.0% 809,033 7.8% 72,148 87,767 - - 45,961
Southwest Outer Loop 12,654,510 786,571 6.2% 4,240 0.0% 790,811 6.2% (13,670) 105,537 - - -
Fort Bend County/Sugar Land 18,576,354 1,135,635 6.1% 68,400 0.4% 1,204,035 6.5% (71,946) 153,138 30,000 60,000 30,000
Total Southwest Corridor 63,139,815 3,555,475 5.6% 123,012 0.2% 3,678,487 5.8% 64,209 619,649 505,000 535,000 75,961
Houston Industrial Market Statistical Summary
2nd Quarter 2013
4. RESEARCH & FORECAST REPORT | Q2 2013 | HOUSTON INDUSTRIAL MARKET
COLLIERS INTERNATIONAL | P.4
Q2 2013 Industrial Under Construction – 30,000 SF or greater
Q2 2013 Industrial Deliveries - 25,000 SF or greater
Submarket Cluster Submarket Building Address RBA % Leased Developer Delivered
Southwest Corridor Ind Hwy 59/Hwy 90 725 S Cravens Rd 475,000 100.0% Ben E. Keith Foods Jun-13
North Corridor Ind North Hardy Toll Rd 100 Northpark Central Dr - Bldg 10 108,160 0.0% ProLogis Jun-13
North Corridor Ind North Hardy Toll Rd 250 Century Plaza Dr 91,520 0.0% Avera Companies Jun-13
North Corridor Ind Woodlands/Conroe 4001 Technology Forest Blvd 74,901 0.0% Stream Realty Partners, L.P. Jun-13
North Corridor Ind North Outer Loop 14134 Vickery Dr 41,964 100.0% Clay Development & Construction Jun-13
Southwest Corridor Ind Southwest Far 1145 Highway 90 A 38,000 0.0% Jacob Realty Group Jun-13
North Corridor Ind North Hardy Toll Rd 1368 E Richey Rd 33,000 0.0% Northwinds Commercial Jun-13
North Corridor Ind North Outer Loop 4641 Kennedy Commerce Dr 31,427 100.0% Clay Development & Construction Jun-13
Southwest Corridor Ind Fort Bend Co/Sugar Land 19830 FM 1093 30,000 0.0% Moody Rambin Interests May-13
North Corridor Ind North Fwy/Tomball Pky Ind 6811 Willowbrook Park Dr 26,000 0.0% Capital Commercial Investments, May-13
North Corridor Ind North Outer Loop 6010 Dwyer Dr 25,000 0.0% Nobel House Real Estate Jun-13
North Corridor Ind North Outer Loop 4615 Kennedy Commerce Dr 25,000 100.0% Clay Development & Construction Jun-13
Submarket Building Address RBA
% Pre-
Leased Developer
Estimated
Delivery Building Description
North Hardy Toll Rd Imperial Valley Dr @ FM 1960 611,000 0.0% Sowell Interest Imperial Dec-13 Spec Warehouse/ Distribution
Northwest Outliers I-10 & Highway 90 500,000 71.4% Cushman & Wakefield Sep-13 Spec Warehouse/Distribution
Northwest Near 7310 Langfield - Bldg 200 299,840 0.0% Avera Companies Jul-13 Spec Distribution Warehouse
North Hardy Toll Rd 110 Airtex Dr 267,170 0.0% DCT Industrial Trust Aug-13 Spec Office/Warehouse
North Hardy Toll Rd 8310 Humble Westfield Rd 240,000 0.0% Duke Realty Sep-13 Spec Office/Warehouse
East-Southeast Far 3750 Highway 225 185,168 0.0% The Carson Companies Sep-13 Spec Distribution Warehouse
North Hardy Toll Rd 16200 Central Green Blvd 181,067 100.0% Liberty Property Trust Sep-13 BTS Office/Warehouse for GAC Energy &
Marine Services
North Hardy Toll Rd 500 Northpark Central Dr 174,200 0.0% Prologis Inc. Jul-13 Spec Office/Warehouse
North Hardy Toll Rd 500 Northpark Central Dr 174,200 0.0% Prologis Inc. Jul-13 Spec Office/Warehouse
North Hardy Toll Rd 14650 Heathrow Forest Pky 121,919 100.0% Wolff Properties Aug-13 BTS Office/Manufacturing/ Distribution for
Suhm Spring Works, Inc.
Northwest Outliers 21201-21601 Park Row Dr 121,500 100.0% Transwestern Sep-13 Spec Office/Warehouse
East-Southeast Far 3700 Highway 225 118,500 0.0% The Carson Companies Sep-13 Spec Office/Warehouse
North Hardy Toll Rd 4730 Consulate Plaza Dr 101,200 0.0% EastGroup Properties Aug-13 Spec Office/Warehouse
North Fwy/Tomball Pky 21200 Spring Plaza Dr 83,542 100.0% Unknown Jul-13 BTS Distribution Truck Terminal
Northwest Outliers 21201-21601 Park Row Rd 79,950 100.0% Transwestern Sep-13 Spec Office/Warehouse
Northwest Inner Loop 1315 W Sam Houston Pky N - Bldg 70,000 0.0% Caldwell Companies Jul-13 Spec Warehouse Distribution
Northwest Outliers Merchants Way 67,743 0.0% InSite Commercial Real Estate Sep-13 Spec Office/Warehouse
North Fwy/Tomball Pky 1050 Greens Pky 67,200 0.0% Liberty Property Trust Dec-13 Spec Office/Warehouse
Northwest Outliers 21201-21601 Park Row Dr 64,350 100.0% Transwestern Sep-13 Spec Office/Warehouse
East-Southeast Far 3800 Highway 225 61,794 0.0% The Carson Companies Sep-13 Spec crane-served Office/Warehouse
Northwest Outliers 1550 Westborough Dr 56,573 100.0% Lin & Sons Enterprises Inc. Dec-13 Spec Office/Warehouse
North Hardy Toll Rd 4741 World Houston Pky 56,513 0.0% EastGroup Properties Aug-13 Spec Office/Warehouse
South Hwy 35 2425 Mowery Rd - Bldg A 53,000 0.0% Colliers International Jul-13 Spec Office/Warehouse
North Hardy Toll Rd 4740 Consulate Plaza Dr 50,340 100.0% EastGroup Properties Aug-13 BTS Office/Warehouse
Northwest Outliers Merchants Way 45,633 0.0% InSite Commercial Real Estate Sep-13 Spec Office/Warehouse
North Hardy Toll Rd 4721 World Houston Pky 45,040 0.0% EastGroup Properties Sep-13 Spec Office/Warehouse
Northwest Outliers 21201-21601 Park Row Dr 45,000 100.0% Transwestern Sep-13 Spec Office/Warehouse
North Fwy/Tomball Pky 7047 W Greens Rd 40,000 0.0% Clay Development Nov-13 Spec Office/Warehouse
Northwest Inner Loop 1315 W Sam Houston Pky N - Bldg 2 40,000 0.0% Caldwell Companies Jul-13 Spec Warehouse Distribution
Northwest Inner Loop 1315 W Sam Houston Pky N - Bldg 3 40,000 0.0% Caldwell Companies Jul-13 Spec Warehouse Distribution
South Hwy 35 9841 Saber Power Ln 30,000 100.0% TXI Operations Dec-13 Spec Office/Warehouse
5. RESEARCH & FORECAST REPORT | Q2 2013 | HOUSTON INDUSTRIAL MARKET
Accelerating success.
COLLIERS INTERNATIONAL
1223 W. Loop South
Suite 900
Houston, Texas 77027
Main +1 713 222 2111
LISA R. BRIDGES
Director of Market Research | Houston
Direct +1 713 830 2125
Fax +1 713 830 2118
lisa.bridges@colliers.com
The Colliers Advantage
Enterprising Culture
Colliers International is a leader in global real estate services,
defined by our spirit of enterprise. Through a culture of service
excellence and a shared sense of initiative, we integrate the
resources of real estate specialists worldwide to accelerate the
success of our partners.
When you choose to work with Colliers, you choose to work
with the best. In addition to being highly skilled experts in their
field, our people are passionate about what they do. And they
know we are invested in their success just as much as we are
in our clients’ success.
This is evident throughout our platform—from Colliers University, our proprietary education and professional development platform, to our
client engagement strategy that encourages cross-functional service integration, to our culture of caring.
We connect through a shared set of values that shape a collaborative environment throughout our organization that is unsurpassed in the
industry. That’s why we attract top recruits and have one of the highest retention rates in the industry. Colliers International has also been
recognized as one of the “best places to work” by top business organizations in many of our markets across the globe.
Colliers International offers a comprehensive portfolio of real estate services to occupiers, owners and investors on a local, regional, national
and international basis.
COLLIERS INTERNATIONAL | P. 5