SlideShare a Scribd company logo
1 of 6
Share or view online at colliers.com/houston
Houston industrial tenants move to new space, increasing
vacancy in older inventory
Research &
Forecast Report
HOUSTON | INDUSTRIAL
Q2 2018
Lisa Bridges Director of Market Research | Houston
E-commerce continues to expand, helping to grow Houston’s
industrial inventory. More than 12.3 million SF of industrial
space is currently under construction, much of that in the form
of distribution and logistics facilities. Liberty Property Trust
is developing a 727,600-SF distribution warehouse located at
14803 Woodham Drive in the North Hardy Toll Rd submarket
for Grocers Supply and a 550,000-SF distribution center is
under construction at 636 Highway 90 in the Hwy 59/Hwy 90
submarket for Best Buy, just to name a few.
In general, the negative absorption as a percentage of the 560
million SF of existing industrial inventory is a small number, but
we do keep an eye on vacancies as they arise. The vacancies
created during the quarter of 2018 resulted from tenants who
left older functionally obsolete buildings in a “flight to quality”
for newer, state of the art buildings in different submarkets, or
a couple of smaller 60,000 - 80,000 SF tenants that closed
operations due to corporate M&A activity, or due to other
restructuring. The strength of the market overall, including the
balance of new deliveries in submarkets around the city indicate
that the overall industrial market is healthy.
According to the U.S. Bureau of Labor Statistics, the Houston
MSA created 79,200 jobs (not seasonally adjusted) between
May 2017 and May 2018, an annual growth rate of 2.6%, which
is above the national average job growth rate of 1.6%. The
largest gains by sector include manufacturing, construction and
employment services.
Summary Statistics
Houston Industrial Market Q2 2017 Q1 2018 Q2 2018
Vacancy Rate 5.6% 5.3% 5.5%
Net Absorption (SF) (13,100) 2,812,181 (231,558)
New Construction (SF) 1,502,400 3,091,633 1,625,625
Under Construction (SF) 4,227,300 9,266,194 12,370,032
Asking Rents
Per Square Foot Per Year (NNN)
Average $6.89 $6.76 $7.03
Warehouse/Distribution $6.63 $6.53 $6.66
Flex/Service $10.52 $9.82 $9.98
Tech/R&D $11.49 $10.22 $10.82
Market Indicators
Relative to prior period
Annual
Change
Quarterly
Change
Quarterly
Forecast*
VACANCY
NET ABSORPTION
NEW CONSTRUCTION
UNDER CONSTRUCTION
*Projected
Change in Sales (Year over Year)
-100.0%
-50.0%
0.0%
50.0%
100.0%
150.0%
200.0%
250.0%
300.0%
Q2 '14 Q2 '15 Q2 '16 Q2 '17 Q2 '18
Average Price Per SF
40
45
50
55
60
65
70
75
80
85
90
Q2 '14 Q2 '15 Q2 '16 Q2 '17 Q2 '18
Houston U.S.
Average CAP Rate
4.0%
5.0%
6.0%
7.0%
8.0%
9.0%
10.0%
Q2 '14 Q2 '15 Q2 '16 Q2 '17 Q2 '18
Houston U.S.
2 Houston Research & Forecast Report | Q2 2018 | Industrial | Colliers International
Sales Activity
Source: Real Capital Analytics
Q2 2018
NO. OF PROPERTIES: 38
TOTAL SF: 4.5M
AVERAGE $/SF: $81
AVERAGE CAP RATE: 6.0%
Job Growth & Unemployment
(not seasonally adjusted)
UNEMPLOYMENT 5/17 5/18
HOUSTON 4.8% 4.2%
TEXAS 4.1% 3.7%
U.S. 4.1% 3.6%
Vacancy & Availability
Houston’s average industrial vacancy rate increased 20 basis points from 5.3% to
5.5% over the quarter. At the end of theecond quarter, Houston had 28.8 million
SF of vacant industrial space for direct lease and an additional 1.9 million SF
of vacant sublease space. Among the major industrial corridors, the Northeast
Corridor had the lowest vacancy rate at 2.5%, followed by the South Corridor
at 3.9%. The submarket with the largest percentage of vacant space is the
Northwest Corridor which had a 6.0% vacancy rate.
Absorption & Demand
Houston’s industrial market posted 231,558 of negative net absorption in the
second quarter, a significant decrease from the 2.8 million SF or positive
absorption recorded in the previous quarter. The negative absorption as a
percentage of the total existing industrial inventory is a small number and
was mostly the effect of tenants relocating to newly delivered space, leaving
older space vacant. Some of the tenants that relocated or expanded into newly
constructed space during Q1 2018 include B&H Bag Company (186,306 SF) in the
Northwest Outliers submarket, Evoqua Water Technologies (107,000 SF) in the
North Hardy Toll Rd submarket and ThyssenKrupp (71,916 SF) in the North Fwy/
Tomball Pky submarket.
The Southeast and North Corridors posted the largest amount of positive net
absorption during the second quarter, posting 0.4 million SF and 0.3 million SF,
respectively. The submarket with the highest amount of negative absorption was
the Northwest Corridor, posting 962,116 SF of negative net absorption.
Rental Rates
According to CoStar, our data service provider, Houston’s citywide average
quoted industrial rental rate for all product types increased from $6.76 per
SF NNN to $7.03 per SF NNN over the quarter. According to Colliers’ internal
data, actual lease transactions are in the $4.56 – $5.04 per SF NNN range for
newer bulk industrial spaces, while flex rates range from $7.20 to $10.80 per
SF depending on the existing improvements or the allowance provided for tenant
improvements and the location of the property.
According to CoStar, the average quoted NNN rental rates by property type are
as follows: $6.66 per SF for Warehouse Distribution space; $9.98 per SF for Flex/
Service space; with Tech/R&D space averaging $10.82 per SF.
JOB GROWTH
Annual
Change
# of Jobs
Added
HOUSTON 2.6% 79.2K
TEXAS 2.8% 344.7K
U.S. 1.6% 2.4M
3 Houston Research & Forecast Report | Q2 2018 | Industrial | Colliers International33
Q2 2018 Industrial Lease Transactions over 50,000 SF
BUILDING NAME/ADDRESS SUBMARKET SF TENANT LEASE DATE
14803 Woodham Dr North Hardy Toll Rd 727,600 Grocers Supply2
Jun-18
12101 McLain Rd Hwy 59/Hwy 90 143,986 Hose Master1
Apr-18
800 Koomey Rd Northwest Outliers 186,306 B&H Bag Company1
Apr-18
600 Fallbrook Dr North Fwy/Tomball Pky 107,790 Kitchen Cabinet Distributors1
Apr-18
15414 International Plaza Dr North Hardy Toll Rd 107,000 Evoqua Water Technologies1
May-18
8000 Market St Southeast Outer Loop 93,600 Metrix1
Jun-18
Leasing Activity
Houston’s industrial leasing activity decreased 9% over the quarter from 5.8M SF in Q1 2018 to 5.4M SF in Q2 2018. Most of the
transactions consisted of leases for 75,000 SF or less; however, there were several larger deals that occurred. The table below highlights
some of the larger transactions that closed in Q2 2018.
1
Direct/New
2
Pre-lease in BTS
Under Construction
Currently 12.4M SF of industrial space is under construction in Houston and 37.4% is pre-leased. The largest project under construction
is a 727,600-SF BTS distribution warehouse for Grocers Supply Company which is being developed by Liberty Property Trust. Below is a
partial list of buildings currently under construction.
Q2 2018 Industrial Under Construction - 300,000 SF or greater
BUSINESS PARK/ADDRESS SUBMARKET RBA % LEASED DEVELOPER/CONTRACTOR
DELIVERY
DATE
BUILDING DESCRIPTION
14803 Woodham Dr North Hardy Toll Rd 727,600 100% Liberty Property Trust Apr-19 BTS for Grocers Supply
Company
Parc Air 59 - 18250 Hwy 59 N Northeast Hwy 90 677,040 0% Archway Properties Dec-18 Spec Distribution
525 Cane Island Pky Northwest Outliers 673,785 0% Oakmont Industrial Group Jul-18 Spec Distribution
1302 Wharton Weems Blvd -
Bldg B2
East-Southeast Far 600,360 0% Liberty Property Trust Jul-18 Spec Distribution
636 Hwy 90 Hwy 59/Hwy90 550,000 100% Seefried Properties, Inc. Oct-18 BTS for Best Buy
Cedar Port Industrial Park East-Southeast Far 500,000 100% Avera Companies Sep-18 BTS Vinmar International
Bayport South Business Park III East-Southeast Far 500,000 0% Johnson Development Assoc. Mar-19 Spec Distribution
Northwest Logistics Center West Outer Loop 411,442 0% Stream Realty Partners, L.P. Jul-18 Spec Distribution
Bayport Logistics Park Bldg 2 East-Southeast Far 369,755 100% Avera Companies Oct-18 BTS for Kuraray
Fallbrook Pines Business Park Hwy 290/Tomball Pky 368,467 0% TrammellCrowCompany Aug-18 Spec Warehouse
Gateway Northwest Business
Park
Northwest Hwy 6 368,432 43.7% Duke Realty Corporation Jul-18 Spec Warehouse
Victory Commerce Center East-Southeast Far 349,050 0% Crow Holdings Industrial Mar-19 Spec Distribution
Point North Three North Hardy Toll Road 337,700 0% Duke Realty Corporation Aug-18 Spec Warehouse
22806 Northwest Lake Dr Northwest Outliers 320,000 100% Kingham Dalton Ltd. Dec-18 BTS for AIV Inc.
4 Houston Research & Forecast Report | Q2 2018 | Industrial | Colliers International
Q2 2018 Houston Industrial Market Statistical Summary
MARKET
RENTABLE
AREA
DIRECT
VACANT SF
DIRECT
VACANCY
RATE
SUBLET
VACANT
SF
SUBLET
VACANCY
RATE
TOTAL
VACANT SF
TOTAL
VACANCY
RATE
2Q18 NET
ABSORP-
TION
1Q18 NET
ABSORP-
TION
2Q18
COMPLE-
TIONS
SF UNDER
CONSTRUC-
TION
HOUSTON TOTAL 562,070,336 28,795,315 5.1% 1,936,971 0.3% 30,732,286 5.5% (231,558) 2,812,181 1,625,625 12,370,032
CBD-NW Inner Loop 11,405,369 503,921 4.4% 25,755 0.2% 529,676 4.6% 99,834 (88,855) 0 14,250
Downtown 31,418,190 1,048,076 3.3% 26,437 0.1% 1,074,513 3.4% 237,057 16,776 0 0
North Inner Loop 4,858,519 296,272 6.1% 0 0.0% 296,272 6.1% 33,722 (72,779) 0 0
Southwest Inner Loop 7,007,302 267,259 3.8% 0 0.0% 267,259 3.8% (108,629) (26,513) 0 0
INNER LOOP
CORRIDOR TOTAL
54,689,380 2,115,528 3.9% 52,192 0.1% 2,167,720 4.0% 261,984 (171,371) 0 14,250
North Fwy/Tomball
Pky
25,324,246 2,633,030 10.4% 158,702 0.6% 2,791,732 11.0% 357,585 (33,994) 894,280 631,370
North Hardy Toll Rd 34,510,616 2,549,867 7.4% 203,465 0.6% 2,753,332 8.0% (145,055) 324,596 176,900 1,295,425
North Outer Loop 21,991,436 627,808 2.9% 76,910 0.3% 704,718 3.2% 235,242 195,550 0 0
The Woodlands/
Conroe
17,615,356 1,240,149 7.0% 103,949 0.6% 1,344,098 7.6% (122,601) 139,977 98,366 25,685
NORTH CORRIDOR
TOTAL
99,441,654 7,050,854 7.1% 543,026 0.5% 7,593,880 7.6% 325,171 626,129 1,169,546 1,952,480
Northeast Hwy 321 1,324,329 33,000 2.5% 0 0.0% 33,000 2.5% 12,000 7,340 0 0
Northeast Hwy 90 18,551,333 355,485 1.9% 0 0.0% 355,485 1.9% (89,282) 316,805 21,000 997,040
Northeast I-10 4,091,145 76,922 1.9% 6195 0.2% 83,117 2.0% 26,360 48,950 0 0
Northeast Inner Loop 11,681,548 394,988 3.4% 22,500 0.2% 417,488 3.6% (61,045) (109,402) 0 0
NORTHEAST
CORRIDOR TOTAL
35,648,355 860,395 2.4% 28,695 0.1% 889,090 2.5% (111,967) 263,693 21,000 997,040
Hwy 290/Tomball Pky 22,618,017 1,290,461 5.7% 154,123 0.7% 1,444,584 6.4% (276,865) 41,707 0 889,319
Northwest Hwy 6 10,350,641 424,125 4.1% 0 0.0% 424,125 4.1% 28,833 101,340 0 435,672
Northwest Inner Loop 60,353,714 3,642,194 6.0% 193,022 0.3% 3,835,216 6.4% (859,026) 110,031 0 42,166
Northwest Near 18,419,329 982,376 5.3% 78,943 0.4% 1,061,319 5.8% 62,858 (139,867) 0 0
Northwest Outlier 22,791,795 1,421,668 6.2% 37,216 0.2% 1,458,884 6.4% 84,429 1,178,956 231,839 2,422,655
West Outer Loop 25,582,078 1,354,781 5.3% 84,200 0.3% 1,438,981 5.6% (2,345) 67,734 0 433,042
NORTHWEST
CORRIDOR TOTAL
160,115,574 9,115,605 5.7% 547,504 0.3% 9,663,109 6.0% (962,116) 1,359,901 231,839 4,222,854
South Highway 35 35,113,991 1,228,297 3.5% 121,836 0.3% 1,350,133 3.8% (17,275) (257,196) 38,500 75,765
South Inner Loop 12,564,984 504,380 4.0% 20,295 0.2% 524,675 4.2% (111,506) 233,569 0 0
SOUTH CORRIDOR
TOTAL
47,678,975 1,732,677 3.6% 142,131 0.3% 1,874,808 3.9% (128,781) (23,627) 38,500 75,765
East I-10 Outer Loop 13,072,490 350,468 2.7% 0 0.0% 350,468 2.7% (77,381) (93,921) 0 10,000
East-Southeast Far 63,475,496 2,835,598 4.5% 443,000 0.7% 3,278,598 5.2% 638,821 859,768 89,440 4,496,805
Southeast Outer Loop 17,334,371 722,351 4.2% 15,000 0.1% 737,351 4.3% (149,782) (97,982) 0 0
SOUTHEAST
CORRIDOR TOTAL
93,882,357 3,908,417 4.2% 458,000 0.5% 4,366,417 4.7% 411,658 667,865 89,440 4,506,805
Highway 59/Highway
90
23,211,646 1,518,349 6.5% 81,411 0.4% 1,599,760 6.9% 58,668 (146,030) 0 550,000
Southwest Far 12,686,309 902,541 7.1% 9,117 0.1% 911,658 7.2% 39,045 231,559 75,300 10,000
Southwest Outer Loop 13,256,970 835,321 6.3% 8,691 0.1% 844,012 6.4% (46,617) 8,905 0 13,198
Sugar Land/Ft Bend
Co
21,459,116 755,628 3.5% 66,204 0.3% 821,832 3.8% (78,603) (4,843) 0 27,640
SOUTHWEST
CORRIDOR TOTAL
70,614,041 4,011,839 5.7% 165,423 0.2% 4,177,262 5.9% (27,507) 89,591 75,300 600,838
Market Summary
5 North American Research & Forecast Report | Q4 2014 | Office Market Outlook | Colliers International
Copyright © 2015 Colliers International.
The information contained herein has been obtained from sources deemed reliable. While
every reasonable effort has been made to ensure its accuracy, we cannot guarantee it. No
responsibility is assumed for any inaccuracies. Readers are encouraged to consult their
professional advisors prior to acting on any of the material contained in this report.
Colliers International | Market
000 Address, Suite #
+1 000 000 0000
colliers.com/<<market>>
5 North American Research & Forecast Report | Q4 2014 | Office Market Outlook | Colliers International
Copyright © 2018 Colliers International.
The information contained herein has been obtained from sources deemed reliable. While
every reasonable effort has been made to ensure its accuracy, we cannot guarantee it. No
responsibility is assumed for any inaccuracies. Readers are encouraged to consult their
professional advisors prior to acting on any of the material contained in this report.
Colliers International | Houston
1233 West Loop South, Suite 900
Houston, Texas 77027
+1 713 222 2111
colliers.com/houston
FOR MORE INFORMATION
Lisa Bridges
Director of Market Research | Houston
+1 713 830 2125
lisa.bridges@colliers.com
Q2 Houston Industrial 2018 Highlights
6 Houston Research & Forecast Report | Q2 2018 | Industrial | Colliers International6
Our philosophy
revolves around the fact
that the best
possible results come
from linking our global
enterprise with
local advisors who
understand your
business, your market,
and how to
integrate real estate
into a successful
business strategy.
C O L L I E R S I N T E R N A T I O N A L G L O B A L L O C A T I O N S
COMMERCIAL REAL ESTATE SECTORS REPRESENTED
OFFICE
INDUSTRIAL
LAND
RETAIL
HEALTHCARE
MULTIFAMILY
HOTEL
$116BTRANSACTION VALUE
2BSF UNDER MANAGEMENT
$2.7BIN REVENUE
413OFFICES
15,400PROFESSIONALS
340ACCREDITED MEMBERS
69COUNTRIES
SIOR
ADVANTAGE
Colliers International Group Inc. (NASDAQ: CIGI) (TSX: CIGI) is a top tier global real estate
services and investment management company operating in 69 countries with a workforce of
more than 12,000 professionals. Colliers is the fastest-growing publicly listed global real
estate services and investment management company, with 2017 corporate revenues of $2.3
billion ($2.7 billion including affiliates). With an enterprising culture and significant employee
ownership and control, Colliers professionals provide a full range of services to real estate
occupiers, owners and investors worldwide, and through its investment management services
platform, has more than $20 billion of assets under management from the world’s most
respected institutional real estate investors.
Colliers professionals think differently, share great ideas and offer thoughtful and innovative
advice to accelerate the success of its clients. Colliers has been ranked among the top 100
global outsourcing firms by the International Association of Outsourcing Professionals for 13
consecutive years, more than any other real estate services firm. Colliers is ranked the
number one property manager in the world by Commercial Property Executive for two years
in a row.
Colliers is led by an experienced leadership team with a proven record of delivering more than
20% annualized returns for shareholders, over more than 20 years.

More Related Content

What's hot

Austin’s industrial market closes 2018 with new buildings and high absorption
Austin’s industrial market closes 2018 with new buildings and high absorptionAustin’s industrial market closes 2018 with new buildings and high absorption
Austin’s industrial market closes 2018 with new buildings and high absorptionColliers International | Houston
 
Q3 2015 Houston Industrial Market Research & Forecast Report
Q3 2015 Houston Industrial Market Research & Forecast ReportQ3 2015 Houston Industrial Market Research & Forecast Report
Q3 2015 Houston Industrial Market Research & Forecast ReportColliers International | Houston
 
4Q15 houston industrial report
4Q15 houston industrial report4Q15 houston industrial report
4Q15 houston industrial reportBob Berry, SIOR
 
Industrial Insight Report - GMA (Q2 2015)
Industrial Insight Report - GMA (Q2 2015)Industrial Insight Report - GMA (Q2 2015)
Industrial Insight Report - GMA (Q2 2015)Victoriya Gouchtchina
 
Houston industrial market report 3 q 10
Houston industrial market report 3 q 10Houston industrial market report 3 q 10
Houston industrial market report 3 q 10Coy Davidson
 
Q1 2021 | Austin Industrial | Research & Forecast Commericial Real Estate Report
Q1 2021 | Austin Industrial | Research & Forecast Commericial Real Estate ReportQ1 2021 | Austin Industrial | Research & Forecast Commericial Real Estate Report
Q1 2021 | Austin Industrial | Research & Forecast Commericial Real Estate ReportColliers International | Houston
 
JLL Louisville Industrial Outlook - Q4 2016
JLL Louisville Industrial Outlook - Q4 2016JLL Louisville Industrial Outlook - Q4 2016
JLL Louisville Industrial Outlook - Q4 2016Ross Bratcher
 
Q1 2014 Houston Industrial Market Research & Forecast Report
Q1 2014 Houston Industrial Market Research & Forecast ReportQ1 2014 Houston Industrial Market Research & Forecast Report
Q1 2014 Houston Industrial Market Research & Forecast ReportColliers International | Houston
 
Q4 2012 Cincinnati Market Trends Industrial
Q4 2012 Cincinnati Market Trends IndustrialQ4 2012 Cincinnati Market Trends Industrial
Q4 2012 Cincinnati Market Trends Industrialcolliersohio
 
St. Louis Industrial Outlook Q3 2016
St. Louis Industrial Outlook Q3 2016St. Louis Industrial Outlook Q3 2016
St. Louis Industrial Outlook Q3 2016Blaise Tomazic
 

What's hot (20)

Q1 2020 | Houston Industrial Market Report
Q1 2020 | Houston Industrial Market ReportQ1 2020 | Houston Industrial Market Report
Q1 2020 | Houston Industrial Market Report
 
Q2 2017 Houston Industrial Research & Forecast Report
Q2 2017 Houston Industrial Research & Forecast ReportQ2 2017 Houston Industrial Research & Forecast Report
Q2 2017 Houston Industrial Research & Forecast Report
 
Austin’s industrial market closes 2018 with new buildings and high absorption
Austin’s industrial market closes 2018 with new buildings and high absorptionAustin’s industrial market closes 2018 with new buildings and high absorption
Austin’s industrial market closes 2018 with new buildings and high absorption
 
Q2 2014 Houston Industrial Market Report
Q2 2014 Houston Industrial Market ReportQ2 2014 Houston Industrial Market Report
Q2 2014 Houston Industrial Market Report
 
Q3 2015 Houston Industrial Market Research & Forecast Report
Q3 2015 Houston Industrial Market Research & Forecast ReportQ3 2015 Houston Industrial Market Research & Forecast Report
Q3 2015 Houston Industrial Market Research & Forecast Report
 
Q2 2018 | Houston Office | Research & Forecast Report
Q2 2018 | Houston Office | Research & Forecast ReportQ2 2018 | Houston Office | Research & Forecast Report
Q2 2018 | Houston Office | Research & Forecast Report
 
4Q15 houston industrial report
4Q15 houston industrial report4Q15 houston industrial report
4Q15 houston industrial report
 
Industrial Insight Report - GMA (Q2 2015)
Industrial Insight Report - GMA (Q2 2015)Industrial Insight Report - GMA (Q2 2015)
Industrial Insight Report - GMA (Q2 2015)
 
Q3 2013 Houston Industrial Market Research Report
Q3 2013 Houston Industrial Market Research ReportQ3 2013 Houston Industrial Market Research Report
Q3 2013 Houston Industrial Market Research Report
 
Q3 2013 Houston Office Market Research Report
Q3 2013 Houston Office Market Research ReportQ3 2013 Houston Office Market Research Report
Q3 2013 Houston Office Market Research Report
 
Houston industrial market report 3 q 10
Houston industrial market report 3 q 10Houston industrial market report 3 q 10
Houston industrial market report 3 q 10
 
Q1 2018 austin_industrial_market_research_report
Q1 2018 austin_industrial_market_research_reportQ1 2018 austin_industrial_market_research_report
Q1 2018 austin_industrial_market_research_report
 
Q4 2013 Houston Industrial Market Research Report
Q4 2013 Houston Industrial Market Research ReportQ4 2013 Houston Industrial Market Research Report
Q4 2013 Houston Industrial Market Research Report
 
Q1 2021 | Austin Industrial | Research & Forecast Commericial Real Estate Report
Q1 2021 | Austin Industrial | Research & Forecast Commericial Real Estate ReportQ1 2021 | Austin Industrial | Research & Forecast Commericial Real Estate Report
Q1 2021 | Austin Industrial | Research & Forecast Commericial Real Estate Report
 
JLL Louisville Industrial Outlook - Q4 2016
JLL Louisville Industrial Outlook - Q4 2016JLL Louisville Industrial Outlook - Q4 2016
JLL Louisville Industrial Outlook - Q4 2016
 
Q1 2014 Houston Industrial Market Research & Forecast Report
Q1 2014 Houston Industrial Market Research & Forecast ReportQ1 2014 Houston Industrial Market Research & Forecast Report
Q1 2014 Houston Industrial Market Research & Forecast Report
 
Q1 2019 | Austin Industrial | Research & Forecast Report
Q1 2019 | Austin Industrial | Research & Forecast ReportQ1 2019 | Austin Industrial | Research & Forecast Report
Q1 2019 | Austin Industrial | Research & Forecast Report
 
Q2 2019 | Austin Industrial | Research & Forecast Report
Q2 2019 | Austin Industrial | Research & Forecast ReportQ2 2019 | Austin Industrial | Research & Forecast Report
Q2 2019 | Austin Industrial | Research & Forecast Report
 
Q4 2012 Cincinnati Market Trends Industrial
Q4 2012 Cincinnati Market Trends IndustrialQ4 2012 Cincinnati Market Trends Industrial
Q4 2012 Cincinnati Market Trends Industrial
 
St. Louis Industrial Outlook Q3 2016
St. Louis Industrial Outlook Q3 2016St. Louis Industrial Outlook Q3 2016
St. Louis Industrial Outlook Q3 2016
 

Similar to Q2 2018 | Houston Industrial | Research & Forecast Report

JLL Louisville Industrial Outlook - Q1 2019
JLL Louisville Industrial Outlook - Q1 2019JLL Louisville Industrial Outlook - Q1 2019
JLL Louisville Industrial Outlook - Q1 2019Alex Westcott
 
JLL Louisville Industrial Outlook - Q1 2019
JLL Louisville Industrial Outlook - Q1 2019JLL Louisville Industrial Outlook - Q1 2019
JLL Louisville Industrial Outlook - Q1 2019Alex Westcott
 
2019 Q4 Industrial St. Louis Report Colliers
2019 Q4 Industrial St. Louis Report Colliers2019 Q4 Industrial St. Louis Report Colliers
2019 Q4 Industrial St. Louis Report ColliersColliersSTL
 
JLL Louisville Industrial Outlook - Q3 2019
JLL Louisville Industrial Outlook - Q3 2019JLL Louisville Industrial Outlook - Q3 2019
JLL Louisville Industrial Outlook - Q3 2019Alex Westcott
 
JLL Louisville Industrial Outlook - Q3 2019
JLL Louisville Industrial Outlook - Q3 2019JLL Louisville Industrial Outlook - Q3 2019
JLL Louisville Industrial Outlook - Q3 2019Alex Westcott
 
JLL Louisville Industrial Outlook - Q3 2019
JLL Louisville Industrial Outlook - Q3 2019JLL Louisville Industrial Outlook - Q3 2019
JLL Louisville Industrial Outlook - Q3 2019Alex Westcott
 
Jll cincinnati industrial outlook q1 2017
Jll cincinnati industrial outlook   q1 2017Jll cincinnati industrial outlook   q1 2017
Jll cincinnati industrial outlook q1 2017Abby Armbruster
 
Q2 2018 | Houston Office Sublease | Research & Forecast Report
Q2 2018 | Houston Office Sublease | Research & Forecast ReportQ2 2018 | Houston Office Sublease | Research & Forecast Report
Q2 2018 | Houston Office Sublease | Research & Forecast ReportColliers International | Houston
 
Q2 2017: Columbus Industrial Trends 2017
Q2 2017: Columbus Industrial Trends 2017Q2 2017: Columbus Industrial Trends 2017
Q2 2017: Columbus Industrial Trends 2017Kyle Ghiloni
 

Similar to Q2 2018 | Houston Industrial | Research & Forecast Report (17)

Q3 2019 | Austin Industrial | Research & Forecast Report
Q3 2019 | Austin Industrial | Research & Forecast ReportQ3 2019 | Austin Industrial | Research & Forecast Report
Q3 2019 | Austin Industrial | Research & Forecast Report
 
Q1 2019 | Houston Industrial | Research & Forecast Report
Q1 2019 | Houston Industrial | Research & Forecast ReportQ1 2019 | Houston Industrial | Research & Forecast Report
Q1 2019 | Houston Industrial | Research & Forecast Report
 
JLL Louisville Industrial Outlook - Q1 2019
JLL Louisville Industrial Outlook - Q1 2019JLL Louisville Industrial Outlook - Q1 2019
JLL Louisville Industrial Outlook - Q1 2019
 
JLL Louisville Industrial Outlook - Q1 2019
JLL Louisville Industrial Outlook - Q1 2019JLL Louisville Industrial Outlook - Q1 2019
JLL Louisville Industrial Outlook - Q1 2019
 
Q2 2013 Houston Office Market Research Report
Q2 2013 Houston Office Market Research ReportQ2 2013 Houston Office Market Research Report
Q2 2013 Houston Office Market Research Report
 
Q1 2022 Austin Industrial Report
Q1 2022 Austin Industrial ReportQ1 2022 Austin Industrial Report
Q1 2022 Austin Industrial Report
 
Q3 2012 Houston Office Market Research Report
Q3 2012 Houston Office Market Research ReportQ3 2012 Houston Office Market Research Report
Q3 2012 Houston Office Market Research Report
 
2019 Q4 Industrial St. Louis Report Colliers
2019 Q4 Industrial St. Louis Report Colliers2019 Q4 Industrial St. Louis Report Colliers
2019 Q4 Industrial St. Louis Report Colliers
 
JLL Louisville Industrial Outlook - Q3 2019
JLL Louisville Industrial Outlook - Q3 2019JLL Louisville Industrial Outlook - Q3 2019
JLL Louisville Industrial Outlook - Q3 2019
 
Q2 2020 | Austin Office | Research & Forecast Report
Q2 2020 | Austin Office | Research & Forecast ReportQ2 2020 | Austin Office | Research & Forecast Report
Q2 2020 | Austin Office | Research & Forecast Report
 
JLL Louisville Industrial Outlook - Q3 2019
JLL Louisville Industrial Outlook - Q3 2019JLL Louisville Industrial Outlook - Q3 2019
JLL Louisville Industrial Outlook - Q3 2019
 
JLL Louisville Industrial Outlook - Q3 2019
JLL Louisville Industrial Outlook - Q3 2019JLL Louisville Industrial Outlook - Q3 2019
JLL Louisville Industrial Outlook - Q3 2019
 
Jll cincinnati industrial outlook q1 2017
Jll cincinnati industrial outlook   q1 2017Jll cincinnati industrial outlook   q1 2017
Jll cincinnati industrial outlook q1 2017
 
Q2 2018 | Houston Office Sublease | Research & Forecast Report
Q2 2018 | Houston Office Sublease | Research & Forecast ReportQ2 2018 | Houston Office Sublease | Research & Forecast Report
Q2 2018 | Houston Office Sublease | Research & Forecast Report
 
Q1 2018 | Houston Office | Research & Forecast Report
Q1 2018 | Houston Office | Research & Forecast ReportQ1 2018 | Houston Office | Research & Forecast Report
Q1 2018 | Houston Office | Research & Forecast Report
 
Houston industrial report suite q1 2018
Houston industrial report suite q1 2018Houston industrial report suite q1 2018
Houston industrial report suite q1 2018
 
Q2 2017: Columbus Industrial Trends 2017
Q2 2017: Columbus Industrial Trends 2017Q2 2017: Columbus Industrial Trends 2017
Q2 2017: Columbus Industrial Trends 2017
 

More from Colliers International | Houston

2019 | Year-End Texas Seniors Housing & Care | Research & Forecast Report
2019 | Year-End Texas Seniors Housing & Care | Research & Forecast Report2019 | Year-End Texas Seniors Housing & Care | Research & Forecast Report
2019 | Year-End Texas Seniors Housing & Care | Research & Forecast ReportColliers International | Houston
 

More from Colliers International | Houston (20)

Q1 2022 Austin Office Market Report
Q1 2022 Austin Office Market ReportQ1 2022 Austin Office Market Report
Q1 2022 Austin Office Market Report
 
2021 Q3 Office Austin Report
2021 Q3 Office Austin Report2021 Q3 Office Austin Report
2021 Q3 Office Austin Report
 
Q2 2021 Austin Industrial Report
Q2 2021 Austin Industrial ReportQ2 2021 Austin Industrial Report
Q2 2021 Austin Industrial Report
 
Q2 2021 Austin Office Report
Q2 2021 Austin Office ReportQ2 2021 Austin Office Report
Q2 2021 Austin Office Report
 
Q1 2021 Austin Office Report
Q1 2021 Austin Office ReportQ1 2021 Austin Office Report
Q1 2021 Austin Office Report
 
Colliers Q4 2020 Austin Industrial Report
Colliers Q4 2020 Austin Industrial ReportColliers Q4 2020 Austin Industrial Report
Colliers Q4 2020 Austin Industrial Report
 
Q4 2020 Austin Office Report
Q4 2020 Austin Office ReportQ4 2020 Austin Office Report
Q4 2020 Austin Office Report
 
Q4 2020 | Houston Office | Research & Forecast Report
Q4 2020 | Houston Office | Research & Forecast ReportQ4 2020 | Houston Office | Research & Forecast Report
Q4 2020 | Houston Office | Research & Forecast Report
 
Q3 2020 | The Woodlands Office | Research Snapshot
Q3 2020 | The Woodlands Office | Research SnapshotQ3 2020 | The Woodlands Office | Research Snapshot
Q3 2020 | The Woodlands Office | Research Snapshot
 
Q3 2020 | Fort Bend | Submarket Snapshot
Q3 2020 | Fort Bend | Submarket SnapshotQ3 2020 | Fort Bend | Submarket Snapshot
Q3 2020 | Fort Bend | Submarket Snapshot
 
Q3 2020 | Austin Office | Research & Forecast Report
Q3 2020 | Austin Office | Research & Forecast ReportQ3 2020 | Austin Office | Research & Forecast Report
Q3 2020 | Austin Office | Research & Forecast Report
 
Q3 2020 | Houston Office | Research & Forecast Report
Q3 2020 | Houston Office | Research & Forecast ReportQ3 2020 | Houston Office | Research & Forecast Report
Q3 2020 | Houston Office | Research & Forecast Report
 
Q2 2020 | The Woodlands Office | Research Snapshot
Q2 2020 | The Woodlands Office | Research SnapshotQ2 2020 | The Woodlands Office | Research Snapshot
Q2 2020 | The Woodlands Office | Research Snapshot
 
Q2 2020 | E Fort Bend Commercial Real Estate Trends
Q2 2020 | E Fort Bend Commercial Real Estate TrendsQ2 2020 | E Fort Bend Commercial Real Estate Trends
Q2 2020 | E Fort Bend Commercial Real Estate Trends
 
Mid-Year 2020 | Houston Healthcare | Market Report
Mid-Year 2020 | Houston Healthcare | Market ReportMid-Year 2020 | Houston Healthcare | Market Report
Mid-Year 2020 | Houston Healthcare | Market Report
 
Q1 2020 | The Woodlands Office | Research Snapshot
Q1 2020 | The Woodlands Office | Research SnapshotQ1 2020 | The Woodlands Office | Research Snapshot
Q1 2020 | The Woodlands Office | Research Snapshot
 
Q1 2020 | Fort Bend Submarket Snapshot
Q1 2020 | Fort Bend Submarket SnapshotQ1 2020 | Fort Bend Submarket Snapshot
Q1 2020 | Fort Bend Submarket Snapshot
 
Q1 2020 | Houston Retail | Research & Forecast Report
Q1 2020 | Houston Retail | Research & Forecast ReportQ1 2020 | Houston Retail | Research & Forecast Report
Q1 2020 | Houston Retail | Research & Forecast Report
 
Q1 2020 | Austin Office | Research & Forecast Report
Q1 2020 | Austin Office | Research & Forecast ReportQ1 2020 | Austin Office | Research & Forecast Report
Q1 2020 | Austin Office | Research & Forecast Report
 
2019 | Year-End Texas Seniors Housing & Care | Research & Forecast Report
2019 | Year-End Texas Seniors Housing & Care | Research & Forecast Report2019 | Year-End Texas Seniors Housing & Care | Research & Forecast Report
2019 | Year-End Texas Seniors Housing & Care | Research & Forecast Report
 

Recently uploaded

Best Deal Virtual Space in Satya The Hive Tata Zudio 750 Sqft 1.89 Cr All inc...
Best Deal Virtual Space in Satya The Hive Tata Zudio 750 Sqft 1.89 Cr All inc...Best Deal Virtual Space in Satya The Hive Tata Zudio 750 Sqft 1.89 Cr All inc...
Best Deal Virtual Space in Satya The Hive Tata Zudio 750 Sqft 1.89 Cr All inc...ApartmentWala1
 
Call Girls In Chand Nagar (Delhi)+918447779280 Welcome To Vip Women Seeking M...
Call Girls In Chand Nagar (Delhi)+918447779280 Welcome To Vip Women Seeking M...Call Girls In Chand Nagar (Delhi)+918447779280 Welcome To Vip Women Seeking M...
Call Girls In Chand Nagar (Delhi)+918447779280 Welcome To Vip Women Seeking M...asmaqueen5
 
Call Girls in laxmi Nagar Delhi 💯Call Us 🔝 9582086666🔝 South Delhi Escorts Se...
Call Girls in laxmi Nagar Delhi 💯Call Us 🔝 9582086666🔝 South Delhi Escorts Se...Call Girls in laxmi Nagar Delhi 💯Call Us 🔝 9582086666🔝 South Delhi Escorts Se...
Call Girls in laxmi Nagar Delhi 💯Call Us 🔝 9582086666🔝 South Delhi Escorts Se...delhimodel235
 
Call Girls in Noida Sector 13 Noida 💯Call Us 🔝 9582086666 🔝 South Delhi Escor...
Call Girls in Noida Sector 13 Noida 💯Call Us 🔝 9582086666 🔝 South Delhi Escor...Call Girls in Noida Sector 13 Noida 💯Call Us 🔝 9582086666 🔝 South Delhi Escor...
Call Girls in Noida Sector 13 Noida 💯Call Us 🔝 9582086666 🔝 South Delhi Escor...delhimodel235
 
Call Girls in Noida Sector 12 Noida 💯Call Us 🔝 9582086666 🔝 South Delhi Escor...
Call Girls in Noida Sector 12 Noida 💯Call Us 🔝 9582086666 🔝 South Delhi Escor...Call Girls in Noida Sector 12 Noida 💯Call Us 🔝 9582086666 🔝 South Delhi Escor...
Call Girls in Noida Sector 12 Noida 💯Call Us 🔝 9582086666 🔝 South Delhi Escor...delhimodel235
 
Call Girls In Laxmi Nagar Delhi +91-8447779280! !Best Woman Seeking Man Escor...
Call Girls In Laxmi Nagar Delhi +91-8447779280! !Best Woman Seeking Man Escor...Call Girls In Laxmi Nagar Delhi +91-8447779280! !Best Woman Seeking Man Escor...
Call Girls In Laxmi Nagar Delhi +91-8447779280! !Best Woman Seeking Man Escor...asmaqueen5
 
Magarpatta Nova Elegance Mundhwa Pune E-Brochure.pdf
Magarpatta Nova Elegance Mundhwa Pune  E-Brochure.pdfMagarpatta Nova Elegance Mundhwa Pune  E-Brochure.pdf
Magarpatta Nova Elegance Mundhwa Pune E-Brochure.pdfManishSaxena95
 
9990771857 Call Girls in Dwarka Sector 6 Delhi (Call Girls) Delhi
9990771857 Call Girls in Dwarka Sector 6 Delhi (Call Girls) Delhi9990771857 Call Girls in Dwarka Sector 6 Delhi (Call Girls) Delhi
9990771857 Call Girls in Dwarka Sector 6 Delhi (Call Girls) Delhidelhimodel235
 
Call Girls in Noida Sector 77 Noida 💯Call Us 🔝 9582086666 🔝 South Delhi Escor...
Call Girls in Noida Sector 77 Noida 💯Call Us 🔝 9582086666 🔝 South Delhi Escor...Call Girls in Noida Sector 77 Noida 💯Call Us 🔝 9582086666 🔝 South Delhi Escor...
Call Girls in Noida Sector 77 Noida 💯Call Us 🔝 9582086666 🔝 South Delhi Escor...delhimodel235
 
Majestique Viman Nagar Pune Brochure.pdf
Majestique Viman Nagar Pune Brochure.pdfMajestique Viman Nagar Pune Brochure.pdf
Majestique Viman Nagar Pune Brochure.pdfBabyrudram
 
Purva Soukhyam in Guduvancheri Chennai.pdf
Purva Soukhyam in Guduvancheri Chennai.pdfPurva Soukhyam in Guduvancheri Chennai.pdf
Purva Soukhyam in Guduvancheri Chennai.pdfpritika141199
 
Kohinoor Flats In Hinjewadi Phase 2 | Homes Built To Suit Your Needs
Kohinoor Flats In Hinjewadi Phase 2 | Homes Built To Suit Your NeedsKohinoor Flats In Hinjewadi Phase 2 | Homes Built To Suit Your Needs
Kohinoor Flats In Hinjewadi Phase 2 | Homes Built To Suit Your Needsaidasheikh47
 
Telibagh & Call Girls Lucknow - 450+ Call Girl Cash Payment 🎂 8923113531 🎪 Ne...
Telibagh & Call Girls Lucknow - 450+ Call Girl Cash Payment 🎂 8923113531 🎪 Ne...Telibagh & Call Girls Lucknow - 450+ Call Girl Cash Payment 🎂 8923113531 🎪 Ne...
Telibagh & Call Girls Lucknow - 450+ Call Girl Cash Payment 🎂 8923113531 🎪 Ne...gurkirankumar98700
 
Shapoorji Pallonji Joyville Vista Pune | Spend Your Family Time Together
Shapoorji Pallonji Joyville Vista Pune | Spend Your Family Time TogetherShapoorji Pallonji Joyville Vista Pune | Spend Your Family Time Together
Shapoorji Pallonji Joyville Vista Pune | Spend Your Family Time Togetheraidasheikh47
 
Properties for Sale in Istanbul with Schools and Parks | Antalya Development
Properties for Sale in Istanbul with Schools and Parks | Antalya DevelopmentProperties for Sale in Istanbul with Schools and Parks | Antalya Development
Properties for Sale in Istanbul with Schools and Parks | Antalya DevelopmentAntalya Development
 
Call Girls in shastri nagar Delhi 8264348440 ✅ call girls ❤️
Call Girls in shastri nagar Delhi 8264348440 ✅ call girls ❤️Call Girls in shastri nagar Delhi 8264348440 ✅ call girls ❤️
Call Girls in shastri nagar Delhi 8264348440 ✅ call girls ❤️soniya singh
 
M3M The Line Brochure - Premium Investment Opportunity for Commercial Ventures
M3M The Line Brochure - Premium Investment Opportunity for Commercial VenturesM3M The Line Brochure - Premium Investment Opportunity for Commercial Ventures
M3M The Line Brochure - Premium Investment Opportunity for Commercial Venturessheltercareglobal
 
Premium Villa Projects in Sarjapur Road Bengaluru
Premium Villa Projects in Sarjapur Road BengaluruPremium Villa Projects in Sarjapur Road Bengaluru
Premium Villa Projects in Sarjapur Road BengaluruShivaSeo3
 
Call Girls In Mayur Vihar Delhi ☆↫8447779280 ❤Escorts Service In Delhi
Call Girls In Mayur Vihar Delhi ☆↫8447779280 ❤Escorts Service In DelhiCall Girls In Mayur Vihar Delhi ☆↫8447779280 ❤Escorts Service In Delhi
Call Girls In Mayur Vihar Delhi ☆↫8447779280 ❤Escorts Service In Delhiasmaqueen5
 
Call Girls in Noida Sector 11 Noida 💯Call Us 🔝 9582086666 🔝 South Delhi Escor...
Call Girls in Noida Sector 11 Noida 💯Call Us 🔝 9582086666 🔝 South Delhi Escor...Call Girls in Noida Sector 11 Noida 💯Call Us 🔝 9582086666 🔝 South Delhi Escor...
Call Girls in Noida Sector 11 Noida 💯Call Us 🔝 9582086666 🔝 South Delhi Escor...delhimodel235
 

Recently uploaded (20)

Best Deal Virtual Space in Satya The Hive Tata Zudio 750 Sqft 1.89 Cr All inc...
Best Deal Virtual Space in Satya The Hive Tata Zudio 750 Sqft 1.89 Cr All inc...Best Deal Virtual Space in Satya The Hive Tata Zudio 750 Sqft 1.89 Cr All inc...
Best Deal Virtual Space in Satya The Hive Tata Zudio 750 Sqft 1.89 Cr All inc...
 
Call Girls In Chand Nagar (Delhi)+918447779280 Welcome To Vip Women Seeking M...
Call Girls In Chand Nagar (Delhi)+918447779280 Welcome To Vip Women Seeking M...Call Girls In Chand Nagar (Delhi)+918447779280 Welcome To Vip Women Seeking M...
Call Girls In Chand Nagar (Delhi)+918447779280 Welcome To Vip Women Seeking M...
 
Call Girls in laxmi Nagar Delhi 💯Call Us 🔝 9582086666🔝 South Delhi Escorts Se...
Call Girls in laxmi Nagar Delhi 💯Call Us 🔝 9582086666🔝 South Delhi Escorts Se...Call Girls in laxmi Nagar Delhi 💯Call Us 🔝 9582086666🔝 South Delhi Escorts Se...
Call Girls in laxmi Nagar Delhi 💯Call Us 🔝 9582086666🔝 South Delhi Escorts Se...
 
Call Girls in Noida Sector 13 Noida 💯Call Us 🔝 9582086666 🔝 South Delhi Escor...
Call Girls in Noida Sector 13 Noida 💯Call Us 🔝 9582086666 🔝 South Delhi Escor...Call Girls in Noida Sector 13 Noida 💯Call Us 🔝 9582086666 🔝 South Delhi Escor...
Call Girls in Noida Sector 13 Noida 💯Call Us 🔝 9582086666 🔝 South Delhi Escor...
 
Call Girls in Noida Sector 12 Noida 💯Call Us 🔝 9582086666 🔝 South Delhi Escor...
Call Girls in Noida Sector 12 Noida 💯Call Us 🔝 9582086666 🔝 South Delhi Escor...Call Girls in Noida Sector 12 Noida 💯Call Us 🔝 9582086666 🔝 South Delhi Escor...
Call Girls in Noida Sector 12 Noida 💯Call Us 🔝 9582086666 🔝 South Delhi Escor...
 
Call Girls In Laxmi Nagar Delhi +91-8447779280! !Best Woman Seeking Man Escor...
Call Girls In Laxmi Nagar Delhi +91-8447779280! !Best Woman Seeking Man Escor...Call Girls In Laxmi Nagar Delhi +91-8447779280! !Best Woman Seeking Man Escor...
Call Girls In Laxmi Nagar Delhi +91-8447779280! !Best Woman Seeking Man Escor...
 
Magarpatta Nova Elegance Mundhwa Pune E-Brochure.pdf
Magarpatta Nova Elegance Mundhwa Pune  E-Brochure.pdfMagarpatta Nova Elegance Mundhwa Pune  E-Brochure.pdf
Magarpatta Nova Elegance Mundhwa Pune E-Brochure.pdf
 
9990771857 Call Girls in Dwarka Sector 6 Delhi (Call Girls) Delhi
9990771857 Call Girls in Dwarka Sector 6 Delhi (Call Girls) Delhi9990771857 Call Girls in Dwarka Sector 6 Delhi (Call Girls) Delhi
9990771857 Call Girls in Dwarka Sector 6 Delhi (Call Girls) Delhi
 
Call Girls in Noida Sector 77 Noida 💯Call Us 🔝 9582086666 🔝 South Delhi Escor...
Call Girls in Noida Sector 77 Noida 💯Call Us 🔝 9582086666 🔝 South Delhi Escor...Call Girls in Noida Sector 77 Noida 💯Call Us 🔝 9582086666 🔝 South Delhi Escor...
Call Girls in Noida Sector 77 Noida 💯Call Us 🔝 9582086666 🔝 South Delhi Escor...
 
Majestique Viman Nagar Pune Brochure.pdf
Majestique Viman Nagar Pune Brochure.pdfMajestique Viman Nagar Pune Brochure.pdf
Majestique Viman Nagar Pune Brochure.pdf
 
Purva Soukhyam in Guduvancheri Chennai.pdf
Purva Soukhyam in Guduvancheri Chennai.pdfPurva Soukhyam in Guduvancheri Chennai.pdf
Purva Soukhyam in Guduvancheri Chennai.pdf
 
Kohinoor Flats In Hinjewadi Phase 2 | Homes Built To Suit Your Needs
Kohinoor Flats In Hinjewadi Phase 2 | Homes Built To Suit Your NeedsKohinoor Flats In Hinjewadi Phase 2 | Homes Built To Suit Your Needs
Kohinoor Flats In Hinjewadi Phase 2 | Homes Built To Suit Your Needs
 
Telibagh & Call Girls Lucknow - 450+ Call Girl Cash Payment 🎂 8923113531 🎪 Ne...
Telibagh & Call Girls Lucknow - 450+ Call Girl Cash Payment 🎂 8923113531 🎪 Ne...Telibagh & Call Girls Lucknow - 450+ Call Girl Cash Payment 🎂 8923113531 🎪 Ne...
Telibagh & Call Girls Lucknow - 450+ Call Girl Cash Payment 🎂 8923113531 🎪 Ne...
 
Shapoorji Pallonji Joyville Vista Pune | Spend Your Family Time Together
Shapoorji Pallonji Joyville Vista Pune | Spend Your Family Time TogetherShapoorji Pallonji Joyville Vista Pune | Spend Your Family Time Together
Shapoorji Pallonji Joyville Vista Pune | Spend Your Family Time Together
 
Properties for Sale in Istanbul with Schools and Parks | Antalya Development
Properties for Sale in Istanbul with Schools and Parks | Antalya DevelopmentProperties for Sale in Istanbul with Schools and Parks | Antalya Development
Properties for Sale in Istanbul with Schools and Parks | Antalya Development
 
Call Girls in shastri nagar Delhi 8264348440 ✅ call girls ❤️
Call Girls in shastri nagar Delhi 8264348440 ✅ call girls ❤️Call Girls in shastri nagar Delhi 8264348440 ✅ call girls ❤️
Call Girls in shastri nagar Delhi 8264348440 ✅ call girls ❤️
 
M3M The Line Brochure - Premium Investment Opportunity for Commercial Ventures
M3M The Line Brochure - Premium Investment Opportunity for Commercial VenturesM3M The Line Brochure - Premium Investment Opportunity for Commercial Ventures
M3M The Line Brochure - Premium Investment Opportunity for Commercial Ventures
 
Premium Villa Projects in Sarjapur Road Bengaluru
Premium Villa Projects in Sarjapur Road BengaluruPremium Villa Projects in Sarjapur Road Bengaluru
Premium Villa Projects in Sarjapur Road Bengaluru
 
Call Girls In Mayur Vihar Delhi ☆↫8447779280 ❤Escorts Service In Delhi
Call Girls In Mayur Vihar Delhi ☆↫8447779280 ❤Escorts Service In DelhiCall Girls In Mayur Vihar Delhi ☆↫8447779280 ❤Escorts Service In Delhi
Call Girls In Mayur Vihar Delhi ☆↫8447779280 ❤Escorts Service In Delhi
 
Call Girls in Noida Sector 11 Noida 💯Call Us 🔝 9582086666 🔝 South Delhi Escor...
Call Girls in Noida Sector 11 Noida 💯Call Us 🔝 9582086666 🔝 South Delhi Escor...Call Girls in Noida Sector 11 Noida 💯Call Us 🔝 9582086666 🔝 South Delhi Escor...
Call Girls in Noida Sector 11 Noida 💯Call Us 🔝 9582086666 🔝 South Delhi Escor...
 

Q2 2018 | Houston Industrial | Research & Forecast Report

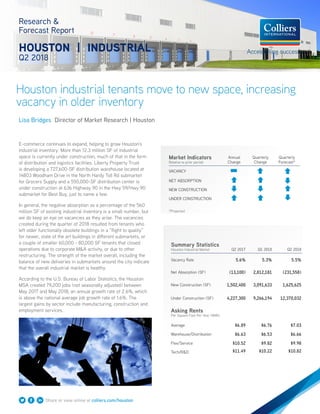
  • 1. Share or view online at colliers.com/houston Houston industrial tenants move to new space, increasing vacancy in older inventory Research & Forecast Report HOUSTON | INDUSTRIAL Q2 2018 Lisa Bridges Director of Market Research | Houston E-commerce continues to expand, helping to grow Houston’s industrial inventory. More than 12.3 million SF of industrial space is currently under construction, much of that in the form of distribution and logistics facilities. Liberty Property Trust is developing a 727,600-SF distribution warehouse located at 14803 Woodham Drive in the North Hardy Toll Rd submarket for Grocers Supply and a 550,000-SF distribution center is under construction at 636 Highway 90 in the Hwy 59/Hwy 90 submarket for Best Buy, just to name a few. In general, the negative absorption as a percentage of the 560 million SF of existing industrial inventory is a small number, but we do keep an eye on vacancies as they arise. The vacancies created during the quarter of 2018 resulted from tenants who left older functionally obsolete buildings in a “flight to quality” for newer, state of the art buildings in different submarkets, or a couple of smaller 60,000 - 80,000 SF tenants that closed operations due to corporate M&A activity, or due to other restructuring. The strength of the market overall, including the balance of new deliveries in submarkets around the city indicate that the overall industrial market is healthy. According to the U.S. Bureau of Labor Statistics, the Houston MSA created 79,200 jobs (not seasonally adjusted) between May 2017 and May 2018, an annual growth rate of 2.6%, which is above the national average job growth rate of 1.6%. The largest gains by sector include manufacturing, construction and employment services. Summary Statistics Houston Industrial Market Q2 2017 Q1 2018 Q2 2018 Vacancy Rate 5.6% 5.3% 5.5% Net Absorption (SF) (13,100) 2,812,181 (231,558) New Construction (SF) 1,502,400 3,091,633 1,625,625 Under Construction (SF) 4,227,300 9,266,194 12,370,032 Asking Rents Per Square Foot Per Year (NNN) Average $6.89 $6.76 $7.03 Warehouse/Distribution $6.63 $6.53 $6.66 Flex/Service $10.52 $9.82 $9.98 Tech/R&D $11.49 $10.22 $10.82 Market Indicators Relative to prior period Annual Change Quarterly Change Quarterly Forecast* VACANCY NET ABSORPTION NEW CONSTRUCTION UNDER CONSTRUCTION *Projected
  • 2. Change in Sales (Year over Year) -100.0% -50.0% 0.0% 50.0% 100.0% 150.0% 200.0% 250.0% 300.0% Q2 '14 Q2 '15 Q2 '16 Q2 '17 Q2 '18 Average Price Per SF 40 45 50 55 60 65 70 75 80 85 90 Q2 '14 Q2 '15 Q2 '16 Q2 '17 Q2 '18 Houston U.S. Average CAP Rate 4.0% 5.0% 6.0% 7.0% 8.0% 9.0% 10.0% Q2 '14 Q2 '15 Q2 '16 Q2 '17 Q2 '18 Houston U.S. 2 Houston Research & Forecast Report | Q2 2018 | Industrial | Colliers International Sales Activity Source: Real Capital Analytics Q2 2018 NO. OF PROPERTIES: 38 TOTAL SF: 4.5M AVERAGE $/SF: $81 AVERAGE CAP RATE: 6.0% Job Growth & Unemployment (not seasonally adjusted) UNEMPLOYMENT 5/17 5/18 HOUSTON 4.8% 4.2% TEXAS 4.1% 3.7% U.S. 4.1% 3.6% Vacancy & Availability Houston’s average industrial vacancy rate increased 20 basis points from 5.3% to 5.5% over the quarter. At the end of theecond quarter, Houston had 28.8 million SF of vacant industrial space for direct lease and an additional 1.9 million SF of vacant sublease space. Among the major industrial corridors, the Northeast Corridor had the lowest vacancy rate at 2.5%, followed by the South Corridor at 3.9%. The submarket with the largest percentage of vacant space is the Northwest Corridor which had a 6.0% vacancy rate. Absorption & Demand Houston’s industrial market posted 231,558 of negative net absorption in the second quarter, a significant decrease from the 2.8 million SF or positive absorption recorded in the previous quarter. The negative absorption as a percentage of the total existing industrial inventory is a small number and was mostly the effect of tenants relocating to newly delivered space, leaving older space vacant. Some of the tenants that relocated or expanded into newly constructed space during Q1 2018 include B&H Bag Company (186,306 SF) in the Northwest Outliers submarket, Evoqua Water Technologies (107,000 SF) in the North Hardy Toll Rd submarket and ThyssenKrupp (71,916 SF) in the North Fwy/ Tomball Pky submarket. The Southeast and North Corridors posted the largest amount of positive net absorption during the second quarter, posting 0.4 million SF and 0.3 million SF, respectively. The submarket with the highest amount of negative absorption was the Northwest Corridor, posting 962,116 SF of negative net absorption. Rental Rates According to CoStar, our data service provider, Houston’s citywide average quoted industrial rental rate for all product types increased from $6.76 per SF NNN to $7.03 per SF NNN over the quarter. According to Colliers’ internal data, actual lease transactions are in the $4.56 – $5.04 per SF NNN range for newer bulk industrial spaces, while flex rates range from $7.20 to $10.80 per SF depending on the existing improvements or the allowance provided for tenant improvements and the location of the property. According to CoStar, the average quoted NNN rental rates by property type are as follows: $6.66 per SF for Warehouse Distribution space; $9.98 per SF for Flex/ Service space; with Tech/R&D space averaging $10.82 per SF. JOB GROWTH Annual Change # of Jobs Added HOUSTON 2.6% 79.2K TEXAS 2.8% 344.7K U.S. 1.6% 2.4M
  • 3. 3 Houston Research & Forecast Report | Q2 2018 | Industrial | Colliers International33 Q2 2018 Industrial Lease Transactions over 50,000 SF BUILDING NAME/ADDRESS SUBMARKET SF TENANT LEASE DATE 14803 Woodham Dr North Hardy Toll Rd 727,600 Grocers Supply2 Jun-18 12101 McLain Rd Hwy 59/Hwy 90 143,986 Hose Master1 Apr-18 800 Koomey Rd Northwest Outliers 186,306 B&H Bag Company1 Apr-18 600 Fallbrook Dr North Fwy/Tomball Pky 107,790 Kitchen Cabinet Distributors1 Apr-18 15414 International Plaza Dr North Hardy Toll Rd 107,000 Evoqua Water Technologies1 May-18 8000 Market St Southeast Outer Loop 93,600 Metrix1 Jun-18 Leasing Activity Houston’s industrial leasing activity decreased 9% over the quarter from 5.8M SF in Q1 2018 to 5.4M SF in Q2 2018. Most of the transactions consisted of leases for 75,000 SF or less; however, there were several larger deals that occurred. The table below highlights some of the larger transactions that closed in Q2 2018. 1 Direct/New 2 Pre-lease in BTS Under Construction Currently 12.4M SF of industrial space is under construction in Houston and 37.4% is pre-leased. The largest project under construction is a 727,600-SF BTS distribution warehouse for Grocers Supply Company which is being developed by Liberty Property Trust. Below is a partial list of buildings currently under construction. Q2 2018 Industrial Under Construction - 300,000 SF or greater BUSINESS PARK/ADDRESS SUBMARKET RBA % LEASED DEVELOPER/CONTRACTOR DELIVERY DATE BUILDING DESCRIPTION 14803 Woodham Dr North Hardy Toll Rd 727,600 100% Liberty Property Trust Apr-19 BTS for Grocers Supply Company Parc Air 59 - 18250 Hwy 59 N Northeast Hwy 90 677,040 0% Archway Properties Dec-18 Spec Distribution 525 Cane Island Pky Northwest Outliers 673,785 0% Oakmont Industrial Group Jul-18 Spec Distribution 1302 Wharton Weems Blvd - Bldg B2 East-Southeast Far 600,360 0% Liberty Property Trust Jul-18 Spec Distribution 636 Hwy 90 Hwy 59/Hwy90 550,000 100% Seefried Properties, Inc. Oct-18 BTS for Best Buy Cedar Port Industrial Park East-Southeast Far 500,000 100% Avera Companies Sep-18 BTS Vinmar International Bayport South Business Park III East-Southeast Far 500,000 0% Johnson Development Assoc. Mar-19 Spec Distribution Northwest Logistics Center West Outer Loop 411,442 0% Stream Realty Partners, L.P. Jul-18 Spec Distribution Bayport Logistics Park Bldg 2 East-Southeast Far 369,755 100% Avera Companies Oct-18 BTS for Kuraray Fallbrook Pines Business Park Hwy 290/Tomball Pky 368,467 0% TrammellCrowCompany Aug-18 Spec Warehouse Gateway Northwest Business Park Northwest Hwy 6 368,432 43.7% Duke Realty Corporation Jul-18 Spec Warehouse Victory Commerce Center East-Southeast Far 349,050 0% Crow Holdings Industrial Mar-19 Spec Distribution Point North Three North Hardy Toll Road 337,700 0% Duke Realty Corporation Aug-18 Spec Warehouse 22806 Northwest Lake Dr Northwest Outliers 320,000 100% Kingham Dalton Ltd. Dec-18 BTS for AIV Inc.
  • 4. 4 Houston Research & Forecast Report | Q2 2018 | Industrial | Colliers International Q2 2018 Houston Industrial Market Statistical Summary MARKET RENTABLE AREA DIRECT VACANT SF DIRECT VACANCY RATE SUBLET VACANT SF SUBLET VACANCY RATE TOTAL VACANT SF TOTAL VACANCY RATE 2Q18 NET ABSORP- TION 1Q18 NET ABSORP- TION 2Q18 COMPLE- TIONS SF UNDER CONSTRUC- TION HOUSTON TOTAL 562,070,336 28,795,315 5.1% 1,936,971 0.3% 30,732,286 5.5% (231,558) 2,812,181 1,625,625 12,370,032 CBD-NW Inner Loop 11,405,369 503,921 4.4% 25,755 0.2% 529,676 4.6% 99,834 (88,855) 0 14,250 Downtown 31,418,190 1,048,076 3.3% 26,437 0.1% 1,074,513 3.4% 237,057 16,776 0 0 North Inner Loop 4,858,519 296,272 6.1% 0 0.0% 296,272 6.1% 33,722 (72,779) 0 0 Southwest Inner Loop 7,007,302 267,259 3.8% 0 0.0% 267,259 3.8% (108,629) (26,513) 0 0 INNER LOOP CORRIDOR TOTAL 54,689,380 2,115,528 3.9% 52,192 0.1% 2,167,720 4.0% 261,984 (171,371) 0 14,250 North Fwy/Tomball Pky 25,324,246 2,633,030 10.4% 158,702 0.6% 2,791,732 11.0% 357,585 (33,994) 894,280 631,370 North Hardy Toll Rd 34,510,616 2,549,867 7.4% 203,465 0.6% 2,753,332 8.0% (145,055) 324,596 176,900 1,295,425 North Outer Loop 21,991,436 627,808 2.9% 76,910 0.3% 704,718 3.2% 235,242 195,550 0 0 The Woodlands/ Conroe 17,615,356 1,240,149 7.0% 103,949 0.6% 1,344,098 7.6% (122,601) 139,977 98,366 25,685 NORTH CORRIDOR TOTAL 99,441,654 7,050,854 7.1% 543,026 0.5% 7,593,880 7.6% 325,171 626,129 1,169,546 1,952,480 Northeast Hwy 321 1,324,329 33,000 2.5% 0 0.0% 33,000 2.5% 12,000 7,340 0 0 Northeast Hwy 90 18,551,333 355,485 1.9% 0 0.0% 355,485 1.9% (89,282) 316,805 21,000 997,040 Northeast I-10 4,091,145 76,922 1.9% 6195 0.2% 83,117 2.0% 26,360 48,950 0 0 Northeast Inner Loop 11,681,548 394,988 3.4% 22,500 0.2% 417,488 3.6% (61,045) (109,402) 0 0 NORTHEAST CORRIDOR TOTAL 35,648,355 860,395 2.4% 28,695 0.1% 889,090 2.5% (111,967) 263,693 21,000 997,040 Hwy 290/Tomball Pky 22,618,017 1,290,461 5.7% 154,123 0.7% 1,444,584 6.4% (276,865) 41,707 0 889,319 Northwest Hwy 6 10,350,641 424,125 4.1% 0 0.0% 424,125 4.1% 28,833 101,340 0 435,672 Northwest Inner Loop 60,353,714 3,642,194 6.0% 193,022 0.3% 3,835,216 6.4% (859,026) 110,031 0 42,166 Northwest Near 18,419,329 982,376 5.3% 78,943 0.4% 1,061,319 5.8% 62,858 (139,867) 0 0 Northwest Outlier 22,791,795 1,421,668 6.2% 37,216 0.2% 1,458,884 6.4% 84,429 1,178,956 231,839 2,422,655 West Outer Loop 25,582,078 1,354,781 5.3% 84,200 0.3% 1,438,981 5.6% (2,345) 67,734 0 433,042 NORTHWEST CORRIDOR TOTAL 160,115,574 9,115,605 5.7% 547,504 0.3% 9,663,109 6.0% (962,116) 1,359,901 231,839 4,222,854 South Highway 35 35,113,991 1,228,297 3.5% 121,836 0.3% 1,350,133 3.8% (17,275) (257,196) 38,500 75,765 South Inner Loop 12,564,984 504,380 4.0% 20,295 0.2% 524,675 4.2% (111,506) 233,569 0 0 SOUTH CORRIDOR TOTAL 47,678,975 1,732,677 3.6% 142,131 0.3% 1,874,808 3.9% (128,781) (23,627) 38,500 75,765 East I-10 Outer Loop 13,072,490 350,468 2.7% 0 0.0% 350,468 2.7% (77,381) (93,921) 0 10,000 East-Southeast Far 63,475,496 2,835,598 4.5% 443,000 0.7% 3,278,598 5.2% 638,821 859,768 89,440 4,496,805 Southeast Outer Loop 17,334,371 722,351 4.2% 15,000 0.1% 737,351 4.3% (149,782) (97,982) 0 0 SOUTHEAST CORRIDOR TOTAL 93,882,357 3,908,417 4.2% 458,000 0.5% 4,366,417 4.7% 411,658 667,865 89,440 4,506,805 Highway 59/Highway 90 23,211,646 1,518,349 6.5% 81,411 0.4% 1,599,760 6.9% 58,668 (146,030) 0 550,000 Southwest Far 12,686,309 902,541 7.1% 9,117 0.1% 911,658 7.2% 39,045 231,559 75,300 10,000 Southwest Outer Loop 13,256,970 835,321 6.3% 8,691 0.1% 844,012 6.4% (46,617) 8,905 0 13,198 Sugar Land/Ft Bend Co 21,459,116 755,628 3.5% 66,204 0.3% 821,832 3.8% (78,603) (4,843) 0 27,640 SOUTHWEST CORRIDOR TOTAL 70,614,041 4,011,839 5.7% 165,423 0.2% 4,177,262 5.9% (27,507) 89,591 75,300 600,838 Market Summary
  • 5. 5 North American Research & Forecast Report | Q4 2014 | Office Market Outlook | Colliers International Copyright © 2015 Colliers International. The information contained herein has been obtained from sources deemed reliable. While every reasonable effort has been made to ensure its accuracy, we cannot guarantee it. No responsibility is assumed for any inaccuracies. Readers are encouraged to consult their professional advisors prior to acting on any of the material contained in this report. Colliers International | Market 000 Address, Suite # 000 Address, Suite # +1 000 000 0000 colliers.com/<<market>> 5 North American Research & Forecast Report | Q4 2014 | Office Market Outlook | Colliers International Copyright © 2018 Colliers International. The information contained herein has been obtained from sources deemed reliable. While every reasonable effort has been made to ensure its accuracy, we cannot guarantee it. No responsibility is assumed for any inaccuracies. Readers are encouraged to consult their professional advisors prior to acting on any of the material contained in this report. Colliers International | Houston 1233 West Loop South, Suite 900 Houston, Texas 77027 +1 713 222 2111 colliers.com/houston FOR MORE INFORMATION Lisa Bridges Director of Market Research | Houston +1 713 830 2125 lisa.bridges@colliers.com Q2 Houston Industrial 2018 Highlights
  • 6. 6 Houston Research & Forecast Report | Q2 2018 | Industrial | Colliers International6 Our philosophy revolves around the fact that the best possible results come from linking our global enterprise with local advisors who understand your business, your market, and how to integrate real estate into a successful business strategy. C O L L I E R S I N T E R N A T I O N A L G L O B A L L O C A T I O N S COMMERCIAL REAL ESTATE SECTORS REPRESENTED OFFICE INDUSTRIAL LAND RETAIL HEALTHCARE MULTIFAMILY HOTEL $116BTRANSACTION VALUE 2BSF UNDER MANAGEMENT $2.7BIN REVENUE 413OFFICES 15,400PROFESSIONALS 340ACCREDITED MEMBERS 69COUNTRIES SIOR ADVANTAGE Colliers International Group Inc. (NASDAQ: CIGI) (TSX: CIGI) is a top tier global real estate services and investment management company operating in 69 countries with a workforce of more than 12,000 professionals. Colliers is the fastest-growing publicly listed global real estate services and investment management company, with 2017 corporate revenues of $2.3 billion ($2.7 billion including affiliates). With an enterprising culture and significant employee ownership and control, Colliers professionals provide a full range of services to real estate occupiers, owners and investors worldwide, and through its investment management services platform, has more than $20 billion of assets under management from the world’s most respected institutional real estate investors. Colliers professionals think differently, share great ideas and offer thoughtful and innovative advice to accelerate the success of its clients. Colliers has been ranked among the top 100 global outsourcing firms by the International Association of Outsourcing Professionals for 13 consecutive years, more than any other real estate services firm. Colliers is ranked the number one property manager in the world by Commercial Property Executive for two years in a row. Colliers is led by an experienced leadership team with a proven record of delivering more than 20% annualized returns for shareholders, over more than 20 years.