Download as PPSX, PPTX


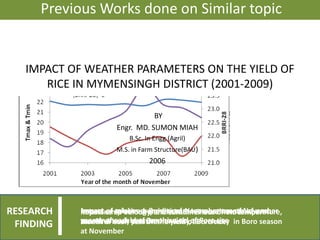
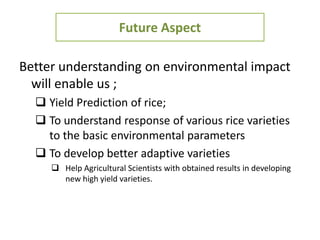
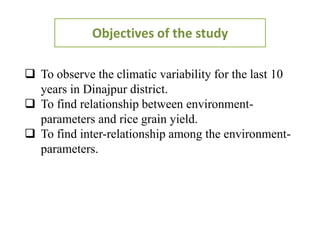
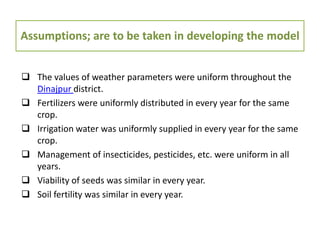
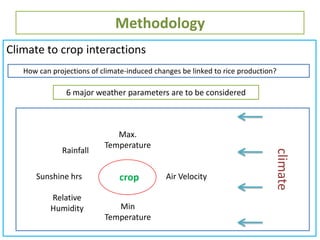
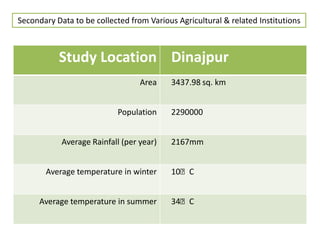
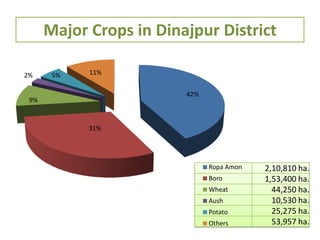
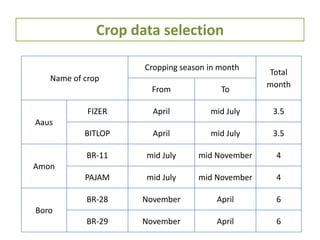
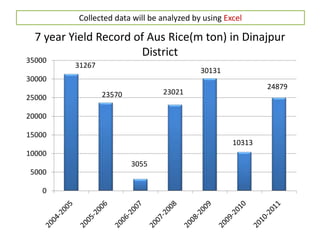
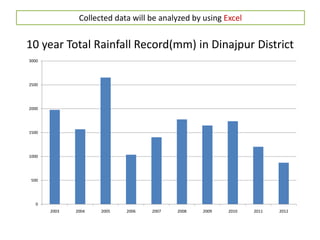
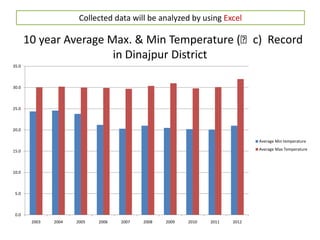
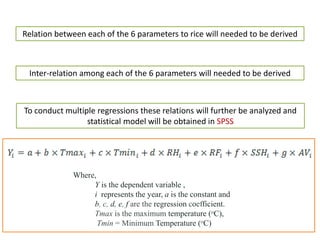


This document presents a project on analyzing the environmental impact on rice yield patterns in Dinajpur District, Bangladesh. The objectives are to observe climate variability over 10 years, find relationships between weather parameters and rice yields, and determine interrelationships among weather parameters. The methodology will analyze data on 6 weather parameters (temperature, rainfall, humidity, air velocity, sunshine hours) collected from agricultural institutions using Excel and develop statistical models using SPSS regression. Previous related studies on the effects of temperature and humidity on rice yields are also presented. The future goal is to help predict rice yields and develop adaptive rice varieties.


