Download as PDF, PPTX

![Data Model
What is a time series?
<identifier> → [ (t0, v0), (t1, v1), … ]](https://image.slidesharecdn.com/108524volz1-170503203337/75/Monitoring-the-Prometheus-Way-Julius-Voltz-Prometheus-8-2048.jpg)
![<identifier> → [ (t0, v0), (t1, v1), … ]
Data Model
What is a time series?
What is this? int64 float64](https://image.slidesharecdn.com/108524volz1-170503203337/75/Monitoring-the-Prometheus-Way-Julius-Voltz-Prometheus-9-2048.jpg)
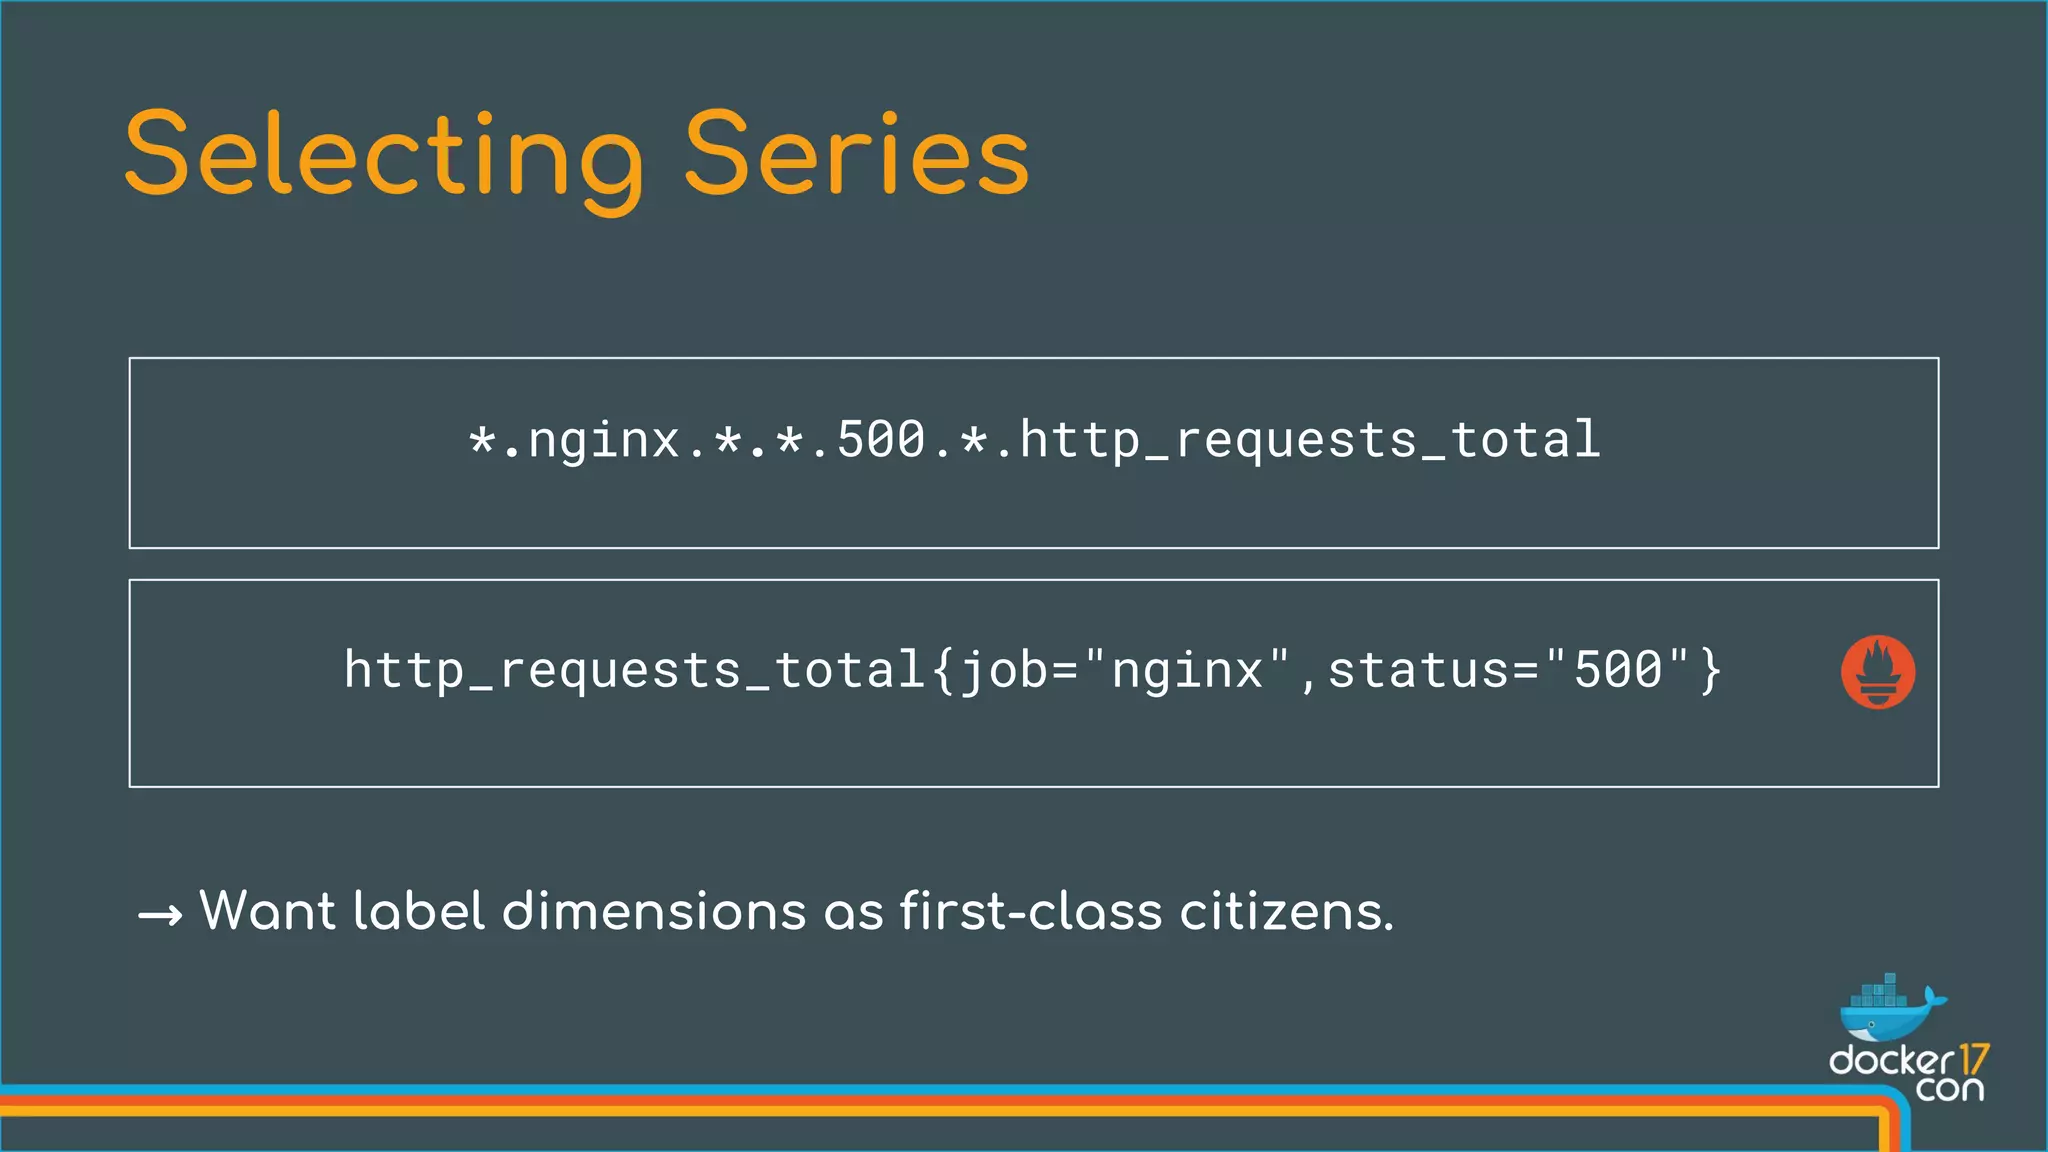
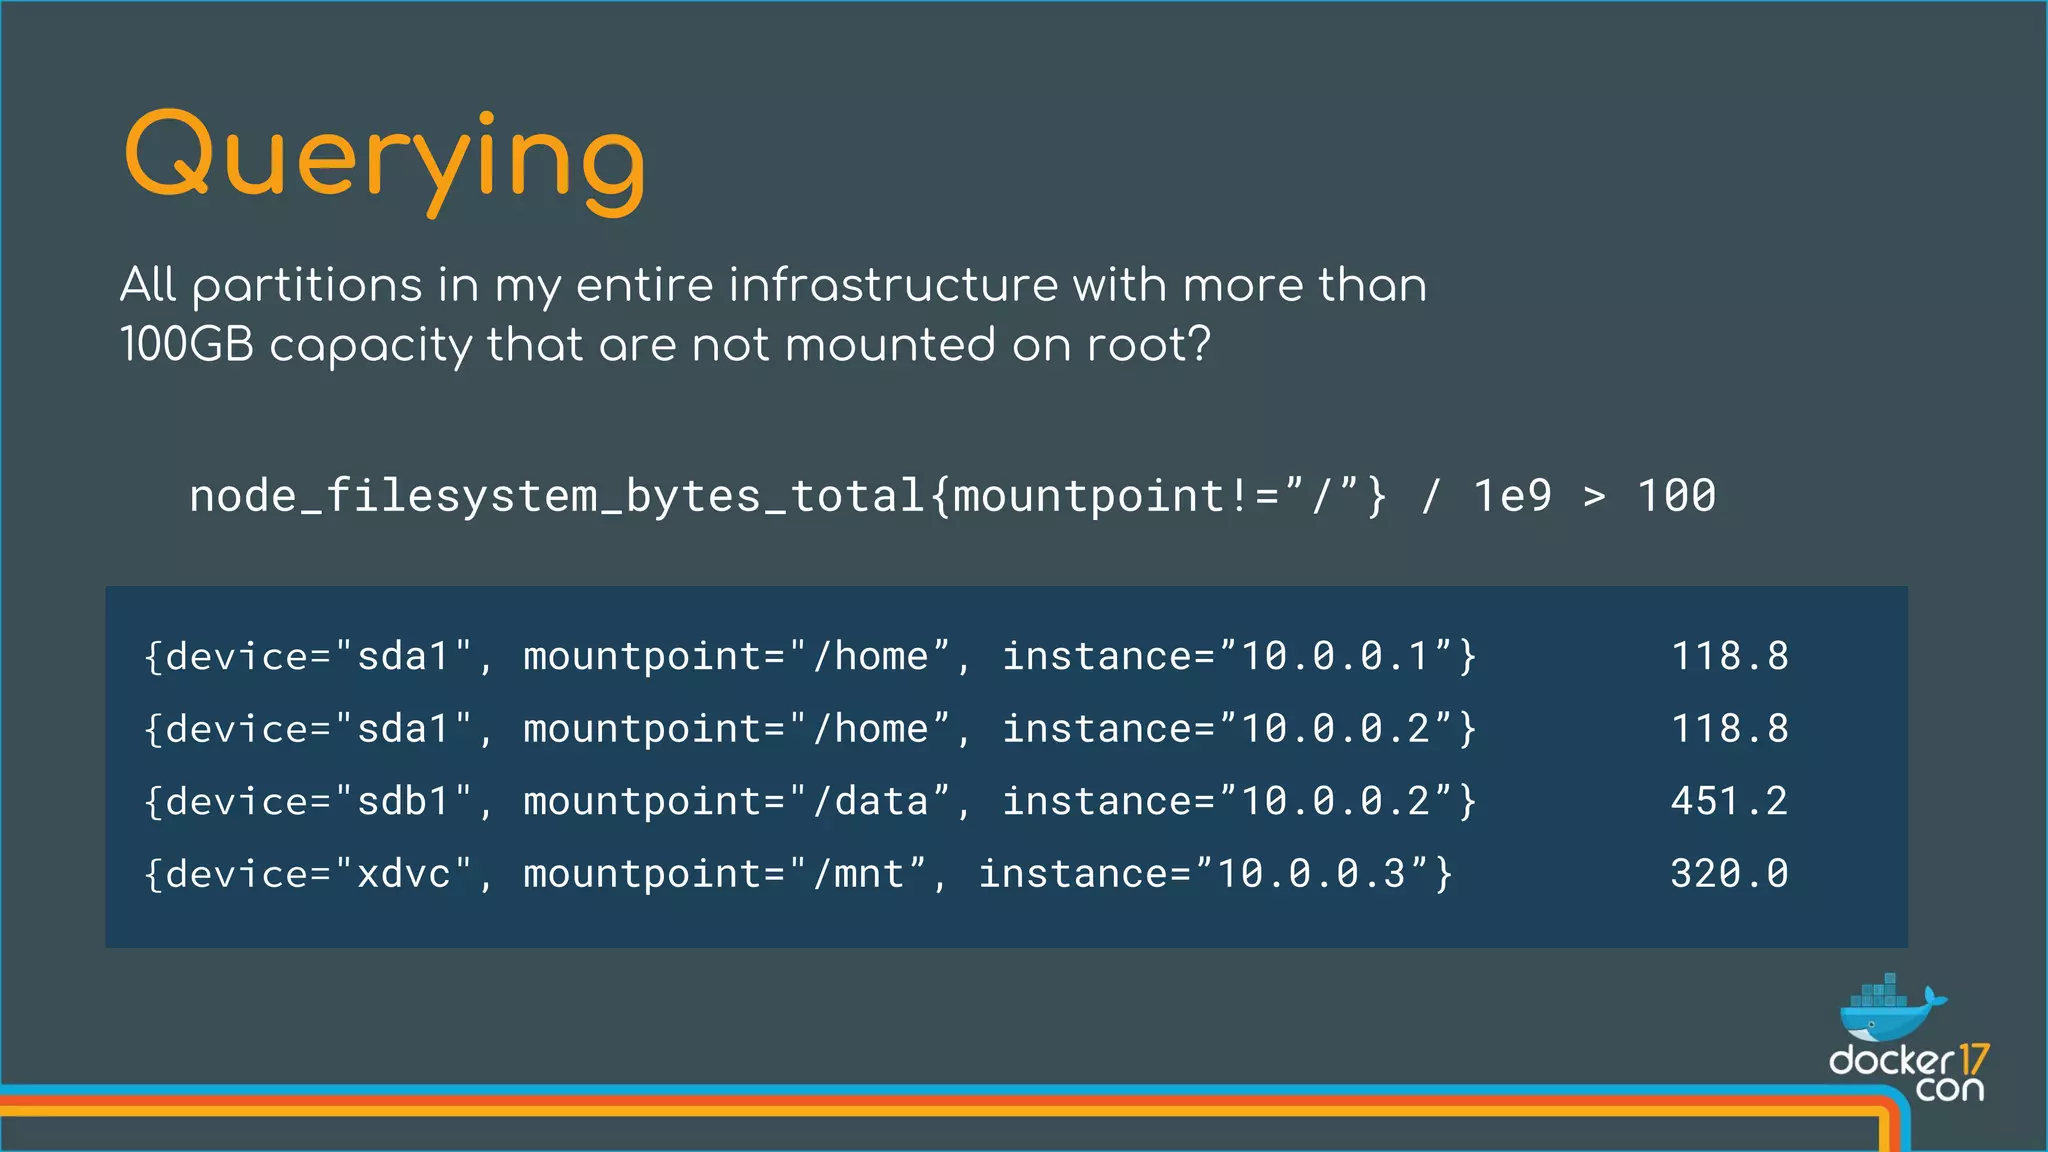
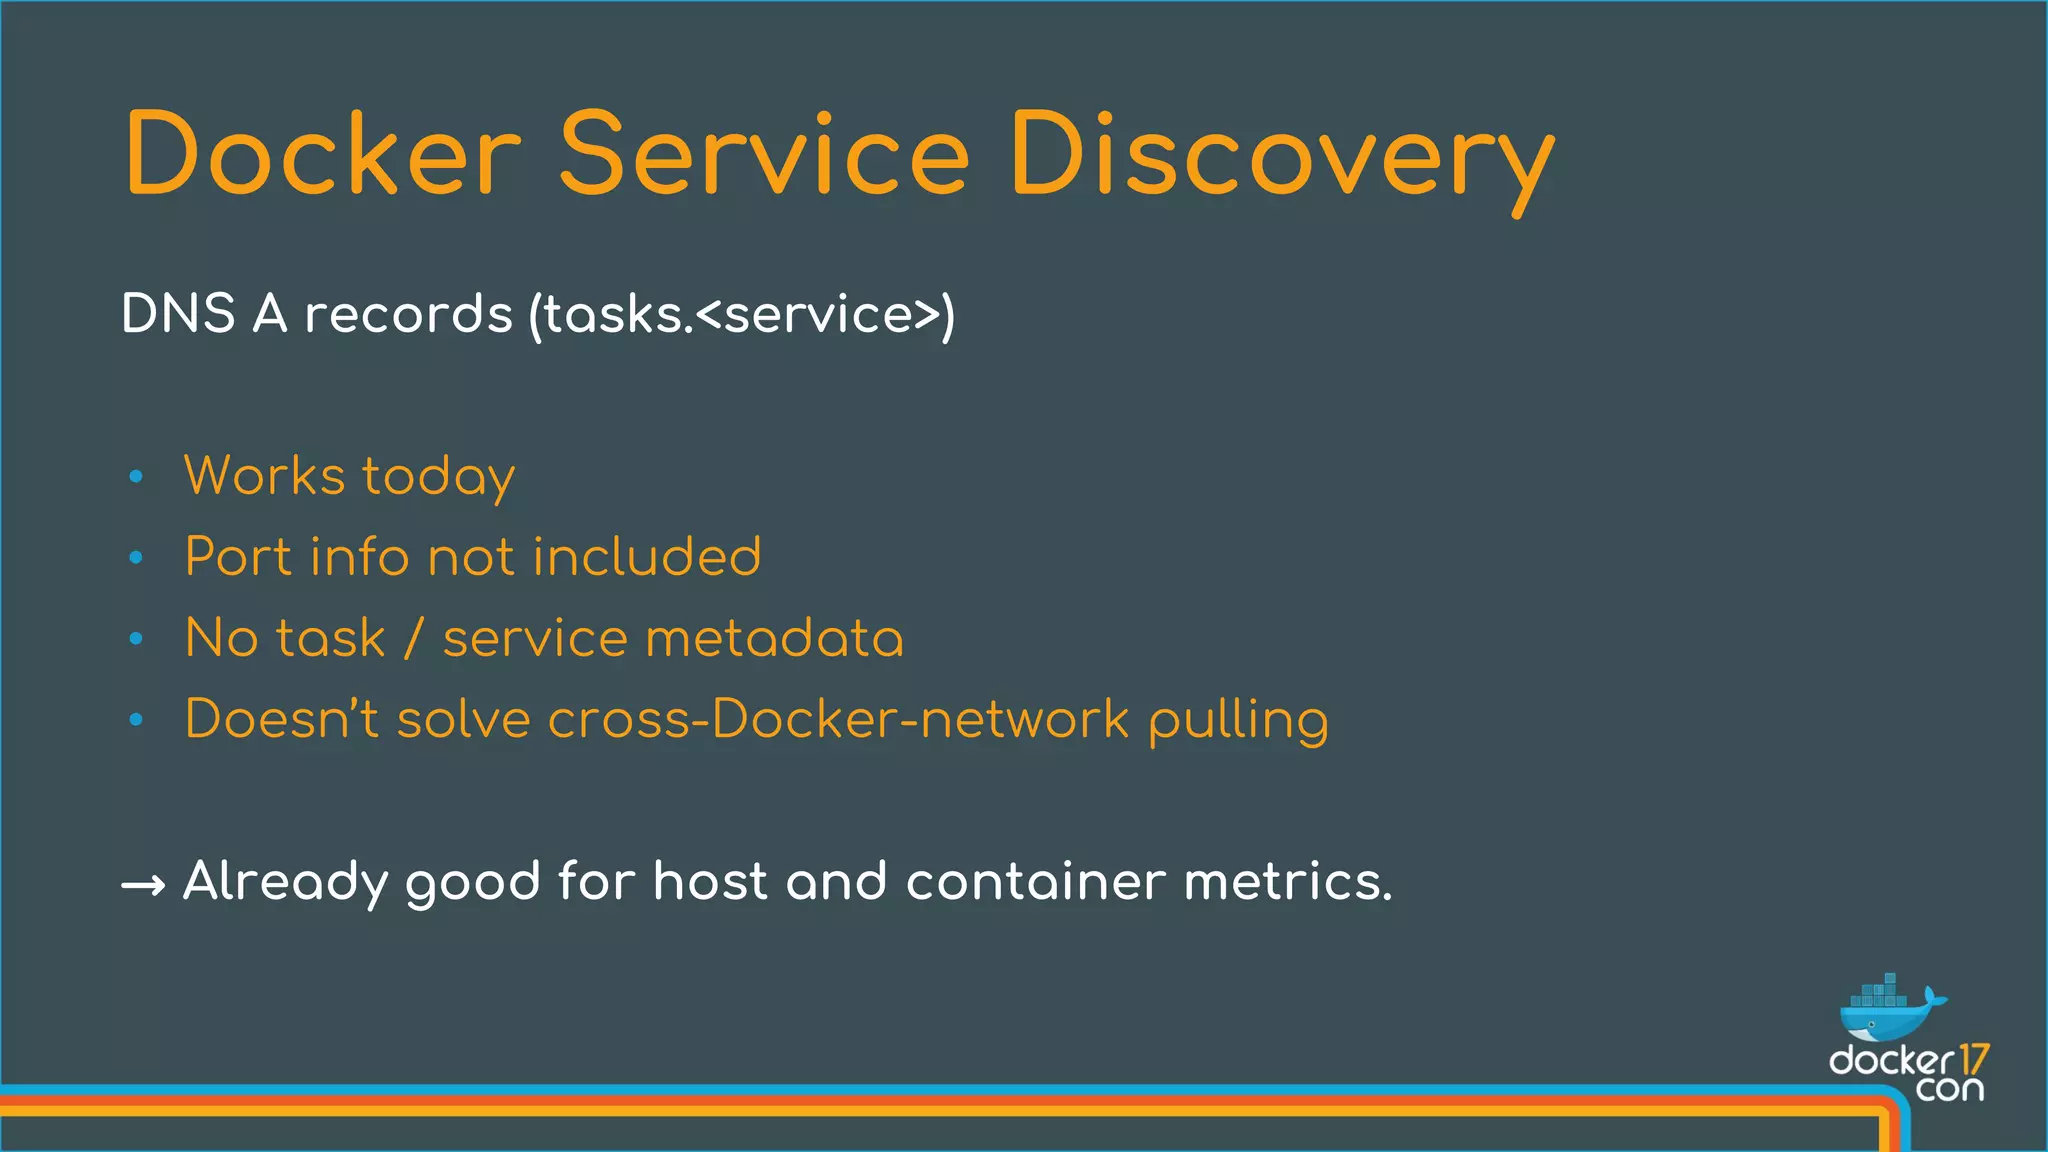
![What’s the ratio of request errors across all service instances?
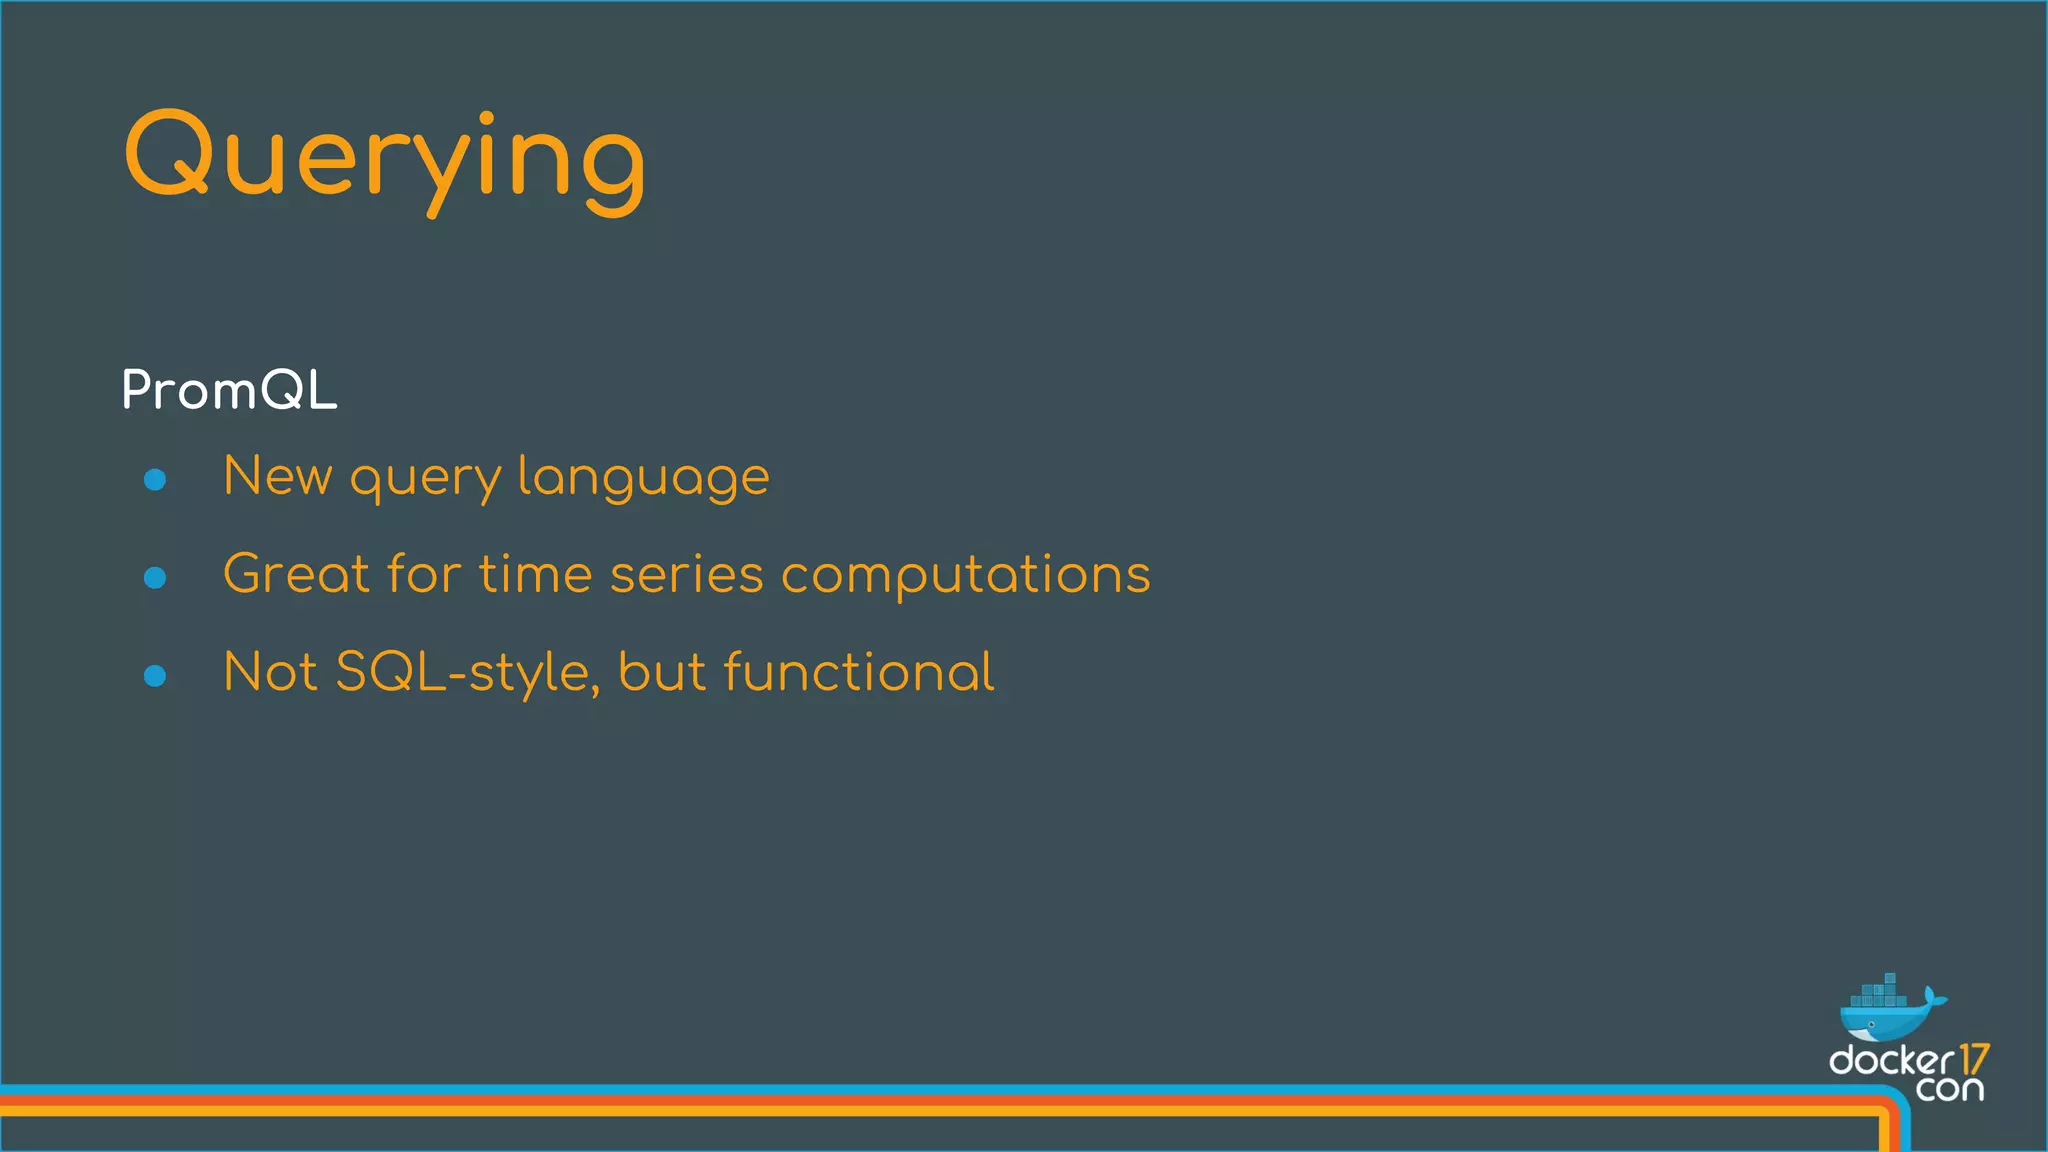
Querying
sum(rate(http_requests_total{status="500"}[5m]))
/ sum(rate(http_requests_total[5m]))
{} 0.029](https://image.slidesharecdn.com/108524volz1-170503203337/75/Monitoring-the-Prometheus-Way-Julius-Voltz-Prometheus-15-2048.jpg)
![What’s the ratio of request errors across all service instances?
Querying
sum by(path) (rate(http_requests_total{status="500"}[5m]))
/ sum by(path) (rate(http_requests_total[5m]))
{path="/status"} 0.0039
{path="/"} 0.0011
{path="/api/v1/topics/:topic"} 0.087
{path="/api/v1/topics} 0.0342](https://image.slidesharecdn.com/108524volz1-170503203337/75/Monitoring-the-Prometheus-Way-Julius-Voltz-Prometheus-16-2048.jpg)
![99th percentile request latency across all instances?
Querying
histogram_quantile(0.99,
sum without(instance) (rate(request_latency_seconds_bucket[5m]))
)
{path="/status", method="GET"} 0.012
{path="/", method="GET"} 0.43
{path="/api/v1/topics/:topic", method="POST"} 1.31
{path="/api/v1/topics, method="GET"} 0.192](https://image.slidesharecdn.com/108524volz1-170503203337/75/Monitoring-the-Prometheus-Way-Julius-Voltz-Prometheus-17-2048.jpg)
![Add engine flags: --experimental=true --metrics-addr=0.0.0.0:4999
$ curl localhost:4999/metrics | more
# HELP engine_daemon_container_actions_seconds The number of seconds [...]
# TYPE engine_daemon_container_actions_seconds histogram
engine_daemon_container_actions_seconds_bucket{action="changes",le="0.005"} 1
engine_daemon_container_actions_seconds_bucket{action="changes",le="0.01"} 1
engine_daemon_container_actions_seconds_bucket{action="changes",le="0.025"} 1
engine_daemon_container_actions_seconds_bucket{action="changes",le="0.05"} 1
engine_daemon_container_actions_seconds_bucket{action="changes",le="0.1"} 1
engine_daemon_container_actions_seconds_bucket{action="changes",le="0.25"} 1
...
Docker Metrics
Native Prometheus metrics in Docker engine since 1.13:](https://image.slidesharecdn.com/108524volz1-170503203337/75/Monitoring-the-Prometheus-Way-Julius-Voltz-Prometheus-31-2048.jpg)
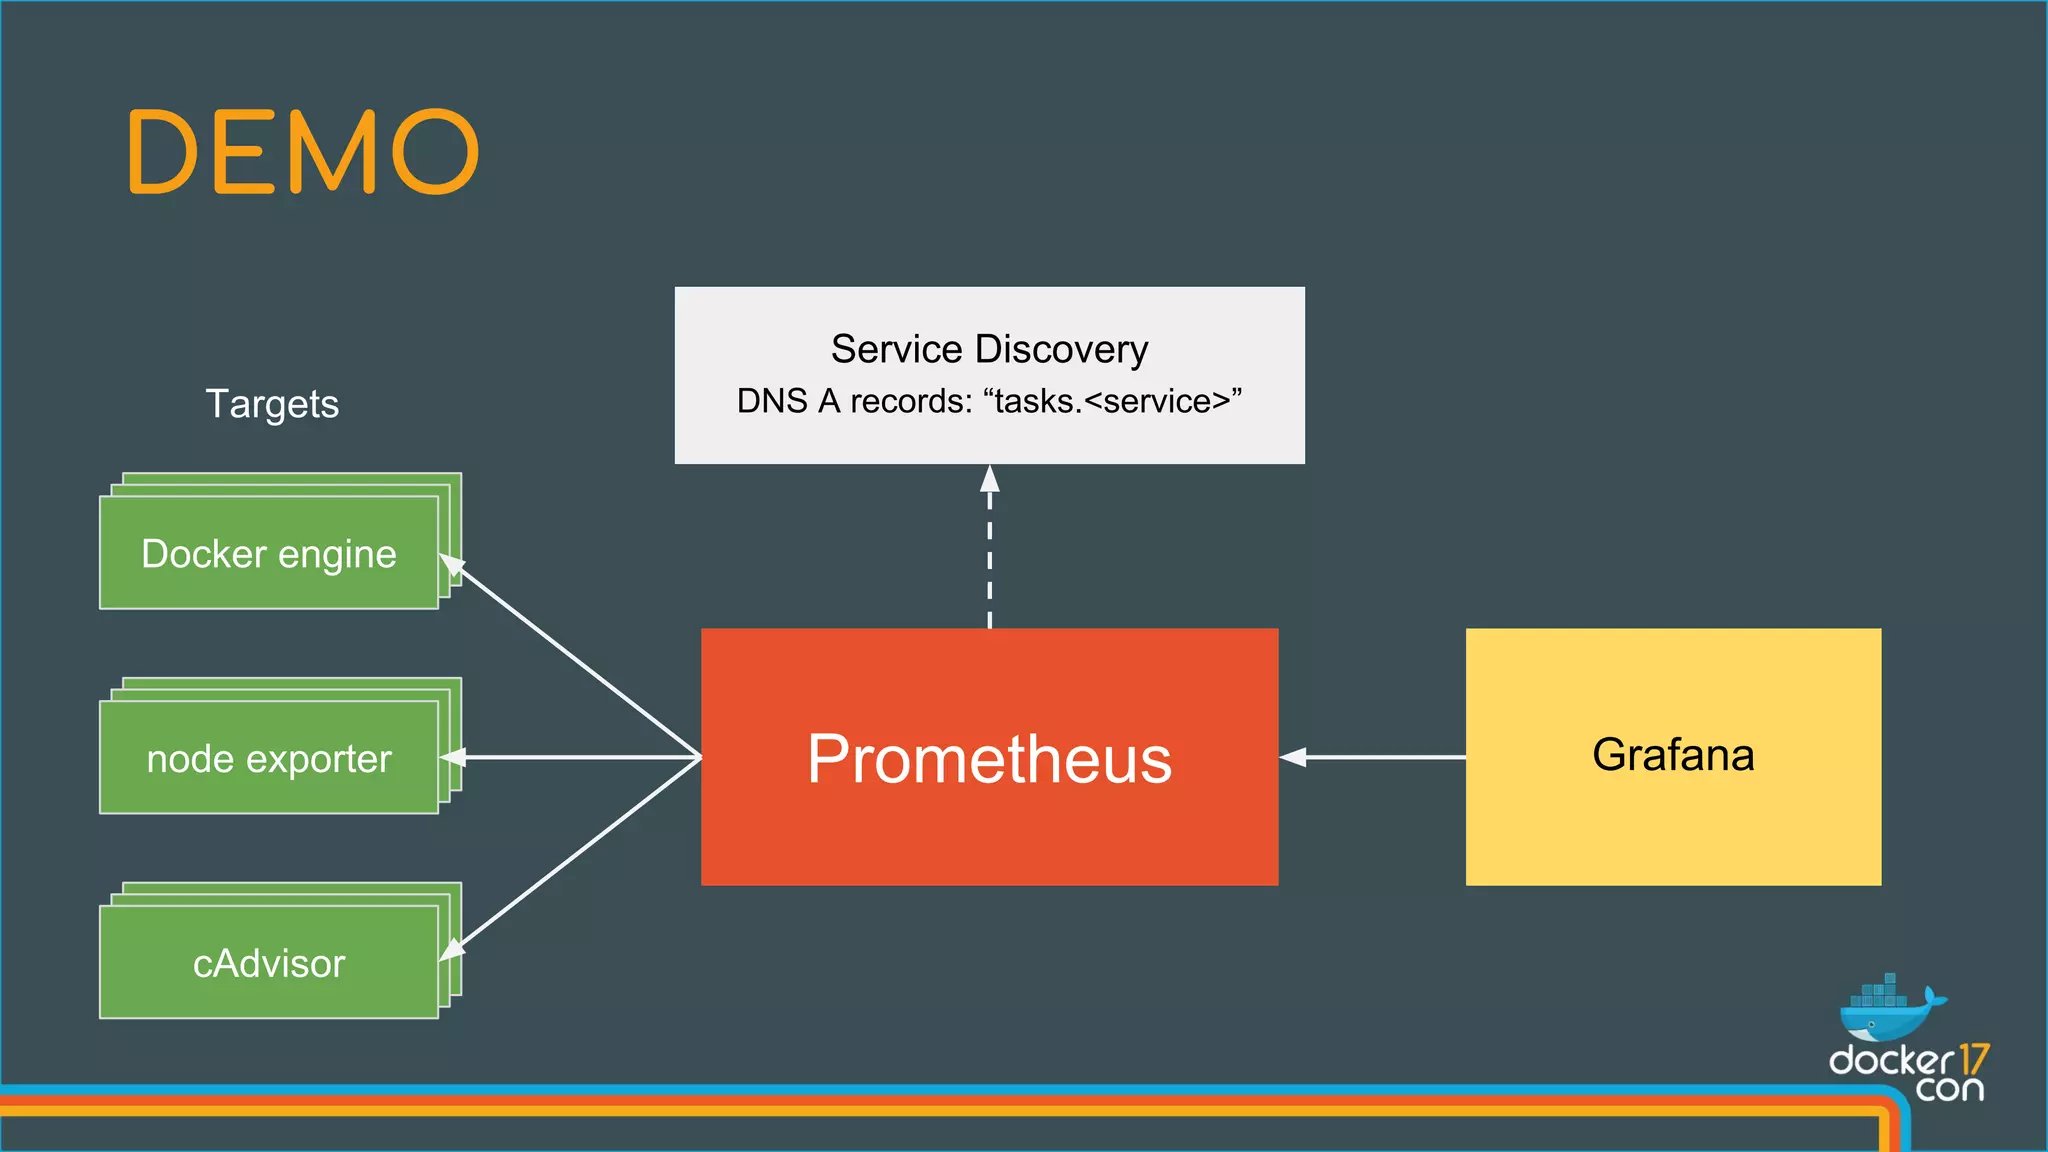

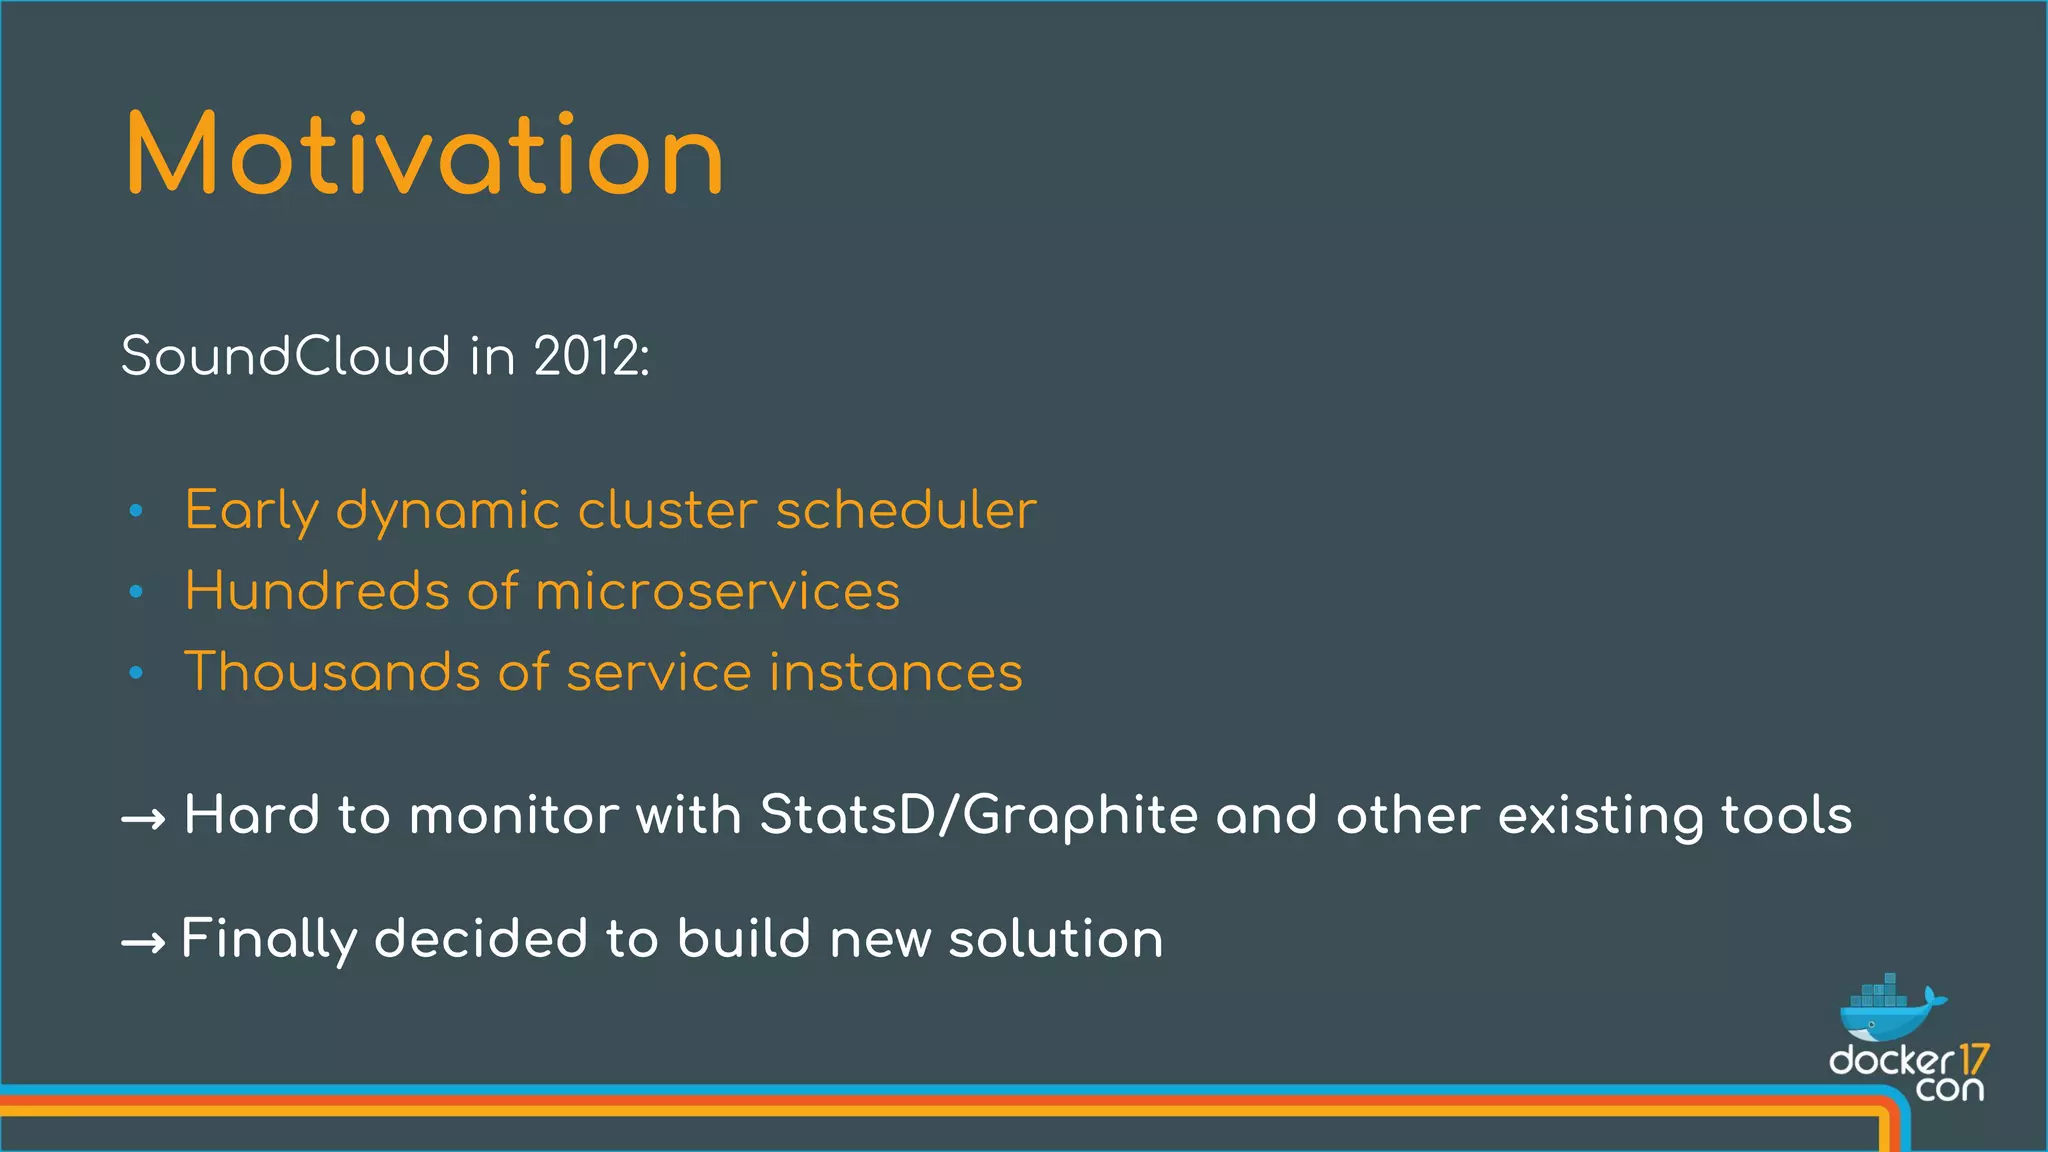
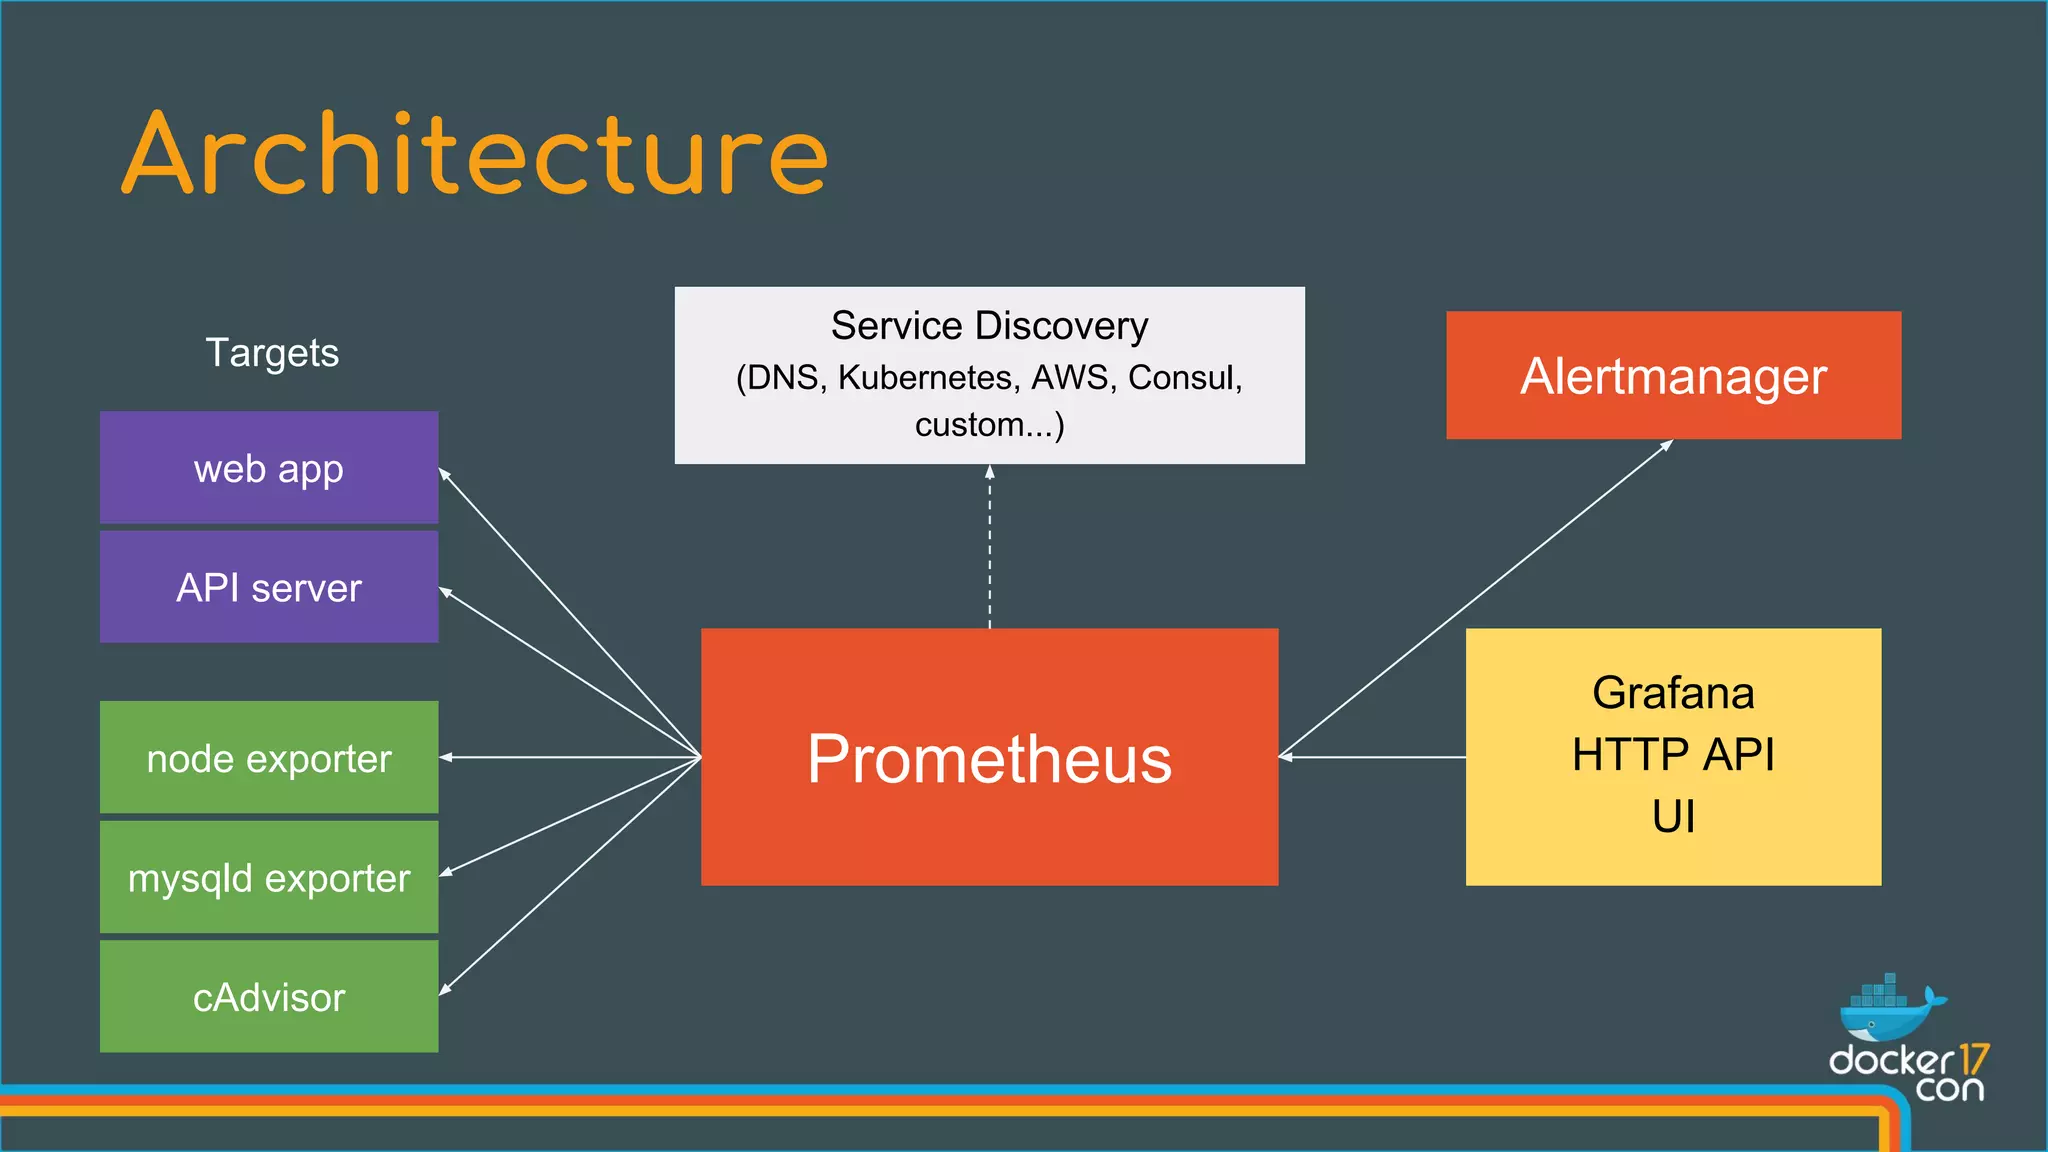
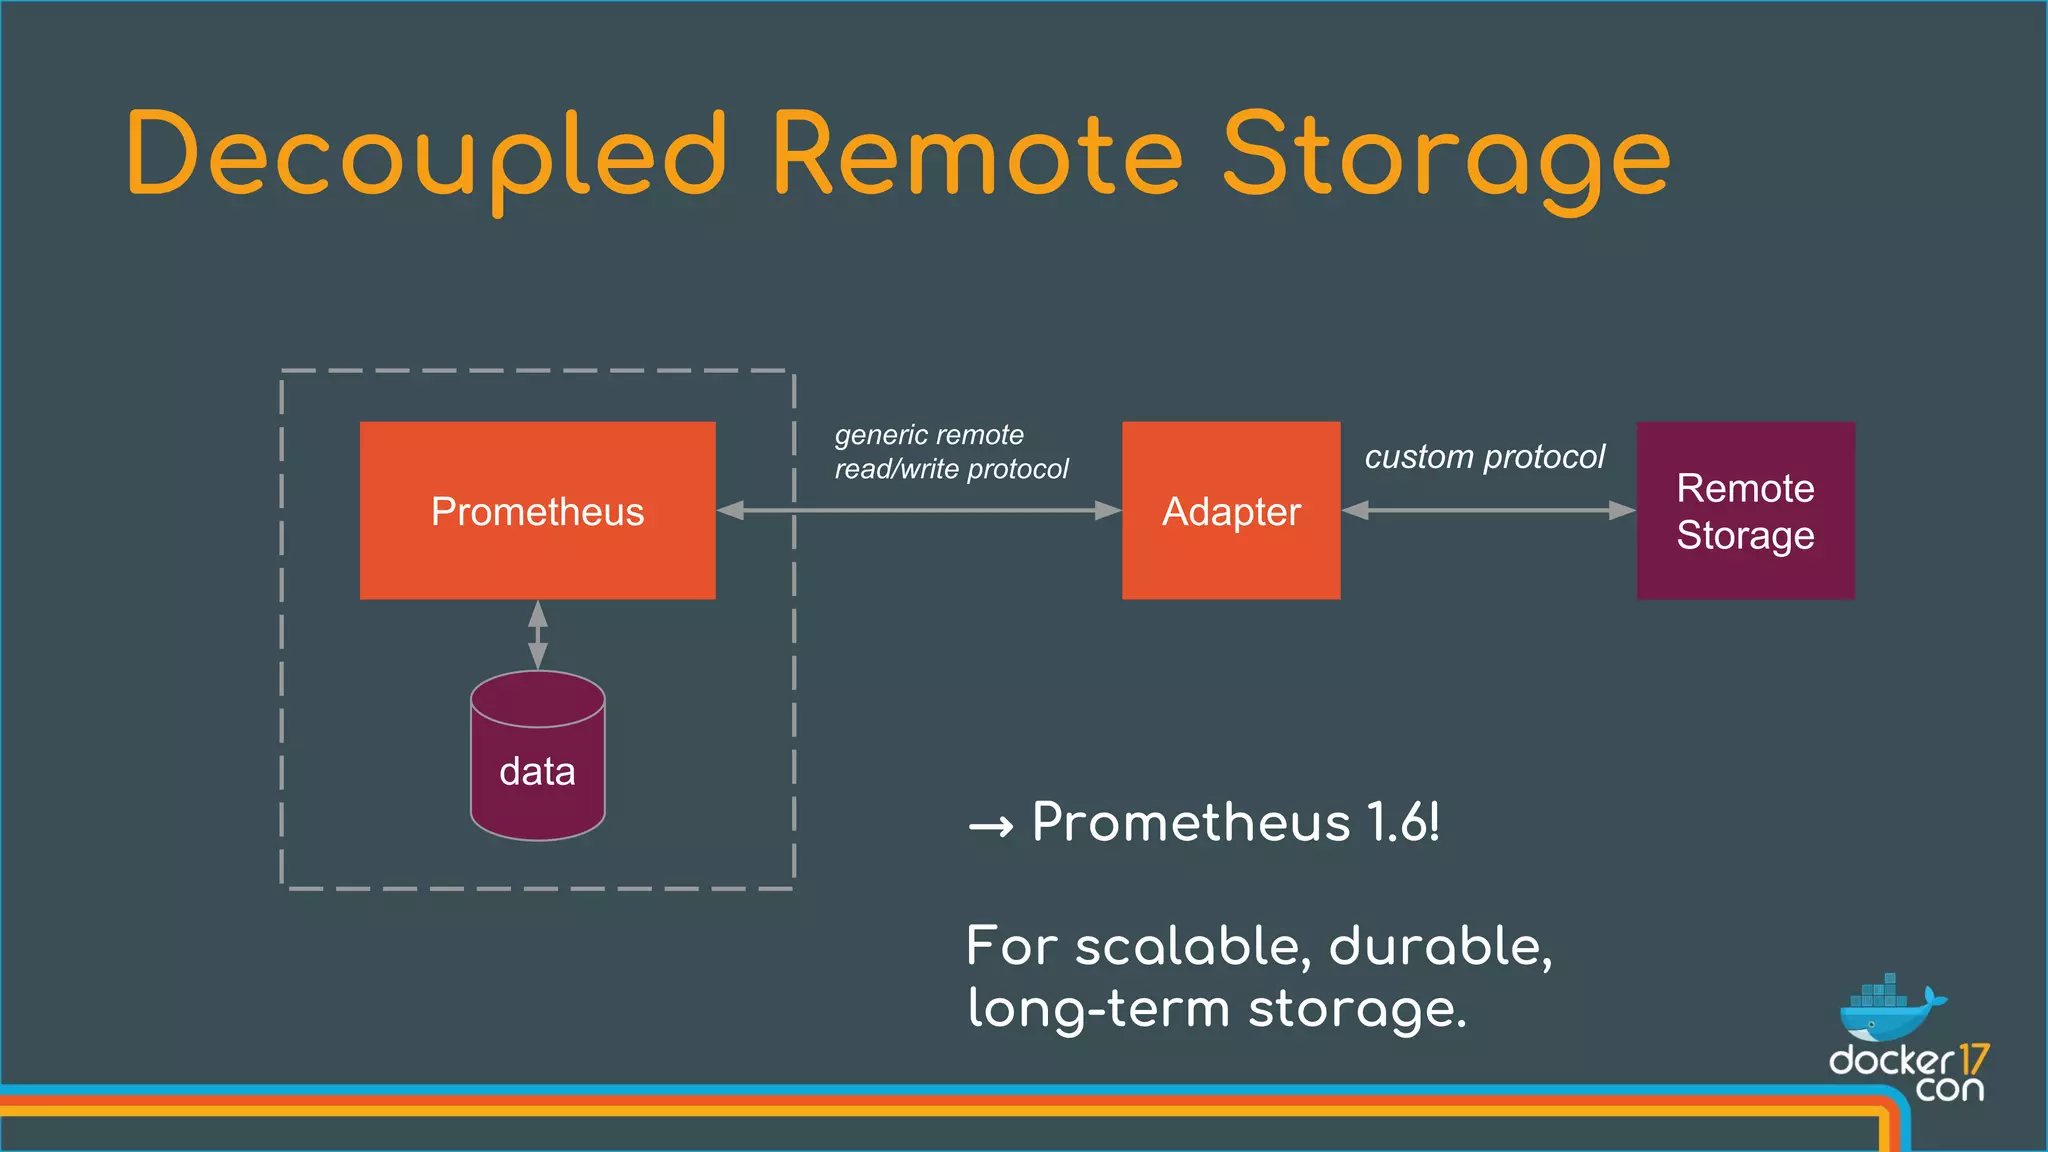
Prometheus is an open-source monitoring system that collects metrics from configured targets at given intervals, stores time series data in a compact format, and allows for querying and alerting on that data. It was created at SoundCloud in 2012 to address the challenges of monitoring hundreds of microservices and thousands of instances. Prometheus uses a dimensional data model with labels rather than nested metrics, and its query language PromQL allows for time series computations and aggregation across instances.


![[dbts-2014-tokyo] 目指せExadata!! Oracle DB高速化を目指した構成](https://cdn.slidesharecdn.com/ss_thumbnails/exadataoracledb-141125203214-conversion-gate01-thumbnail.jpg?width=640&height=640&fit=bounds)

![[Aurora事例祭り]Amazon Aurora を使いこなすためのベストプラクティス](https://cdn.slidesharecdn.com/ss_thumbnails/amazonauroratips-170307140000-thumbnail.jpg?width=640&height=640&fit=bounds)


![[OpenInfra Days Korea 2018] (Track 2) Neutron LBaaS 어디까지 왔니? - Octavia 소개](https://cdn.slidesharecdn.com/ss_thumbnails/26octavia-180704054917-thumbnail.jpg?width=640&height=640&fit=bounds)


![Vibe Coding vs. Spec-Driven Development [Free Meetup]](https://cdn.slidesharecdn.com/ss_thumbnails/vibecodingvsspecdrivendevelopment-251209105622-43f455e7-thumbnail.jpg?width=640&height=640&fit=bounds)


