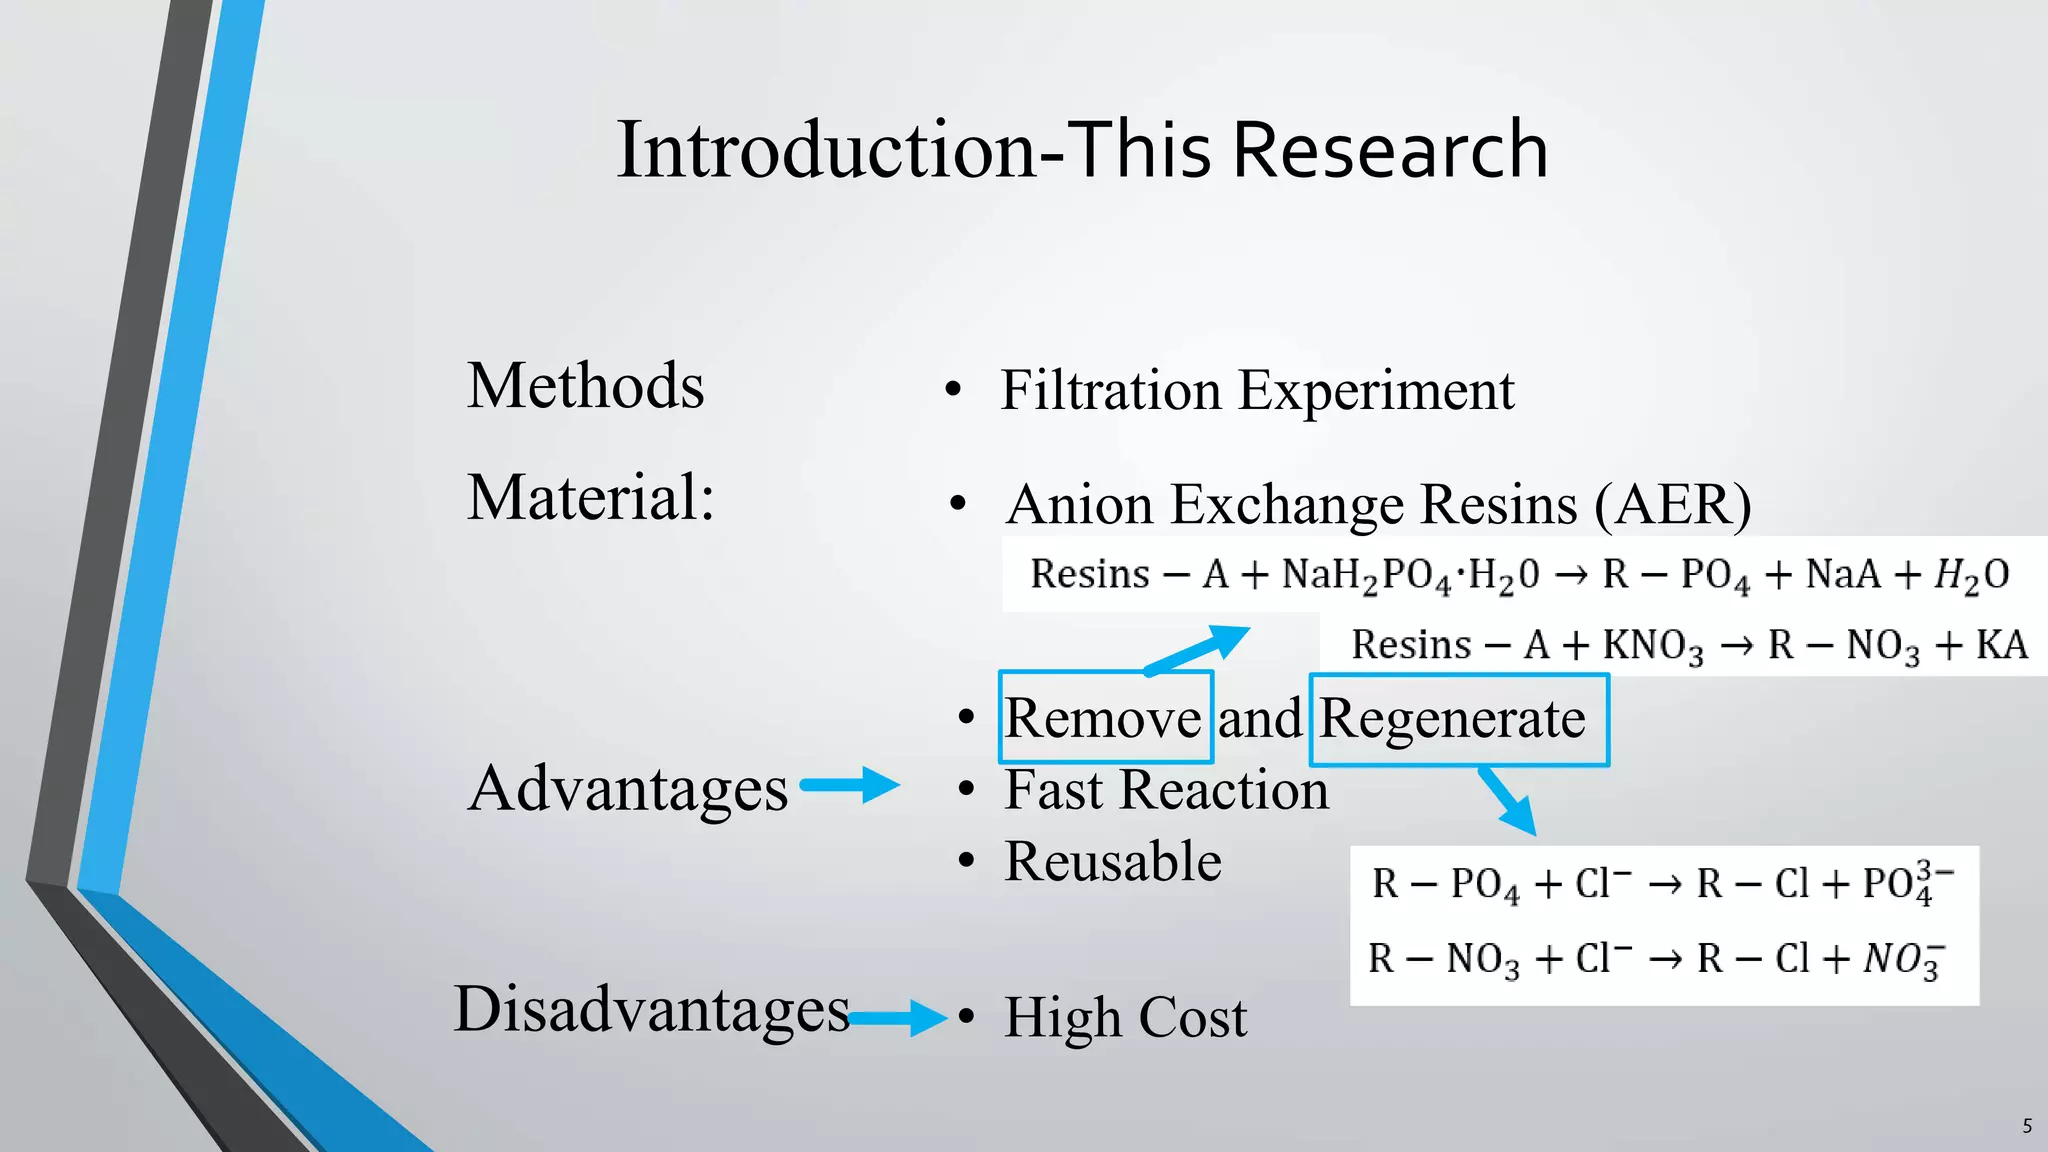
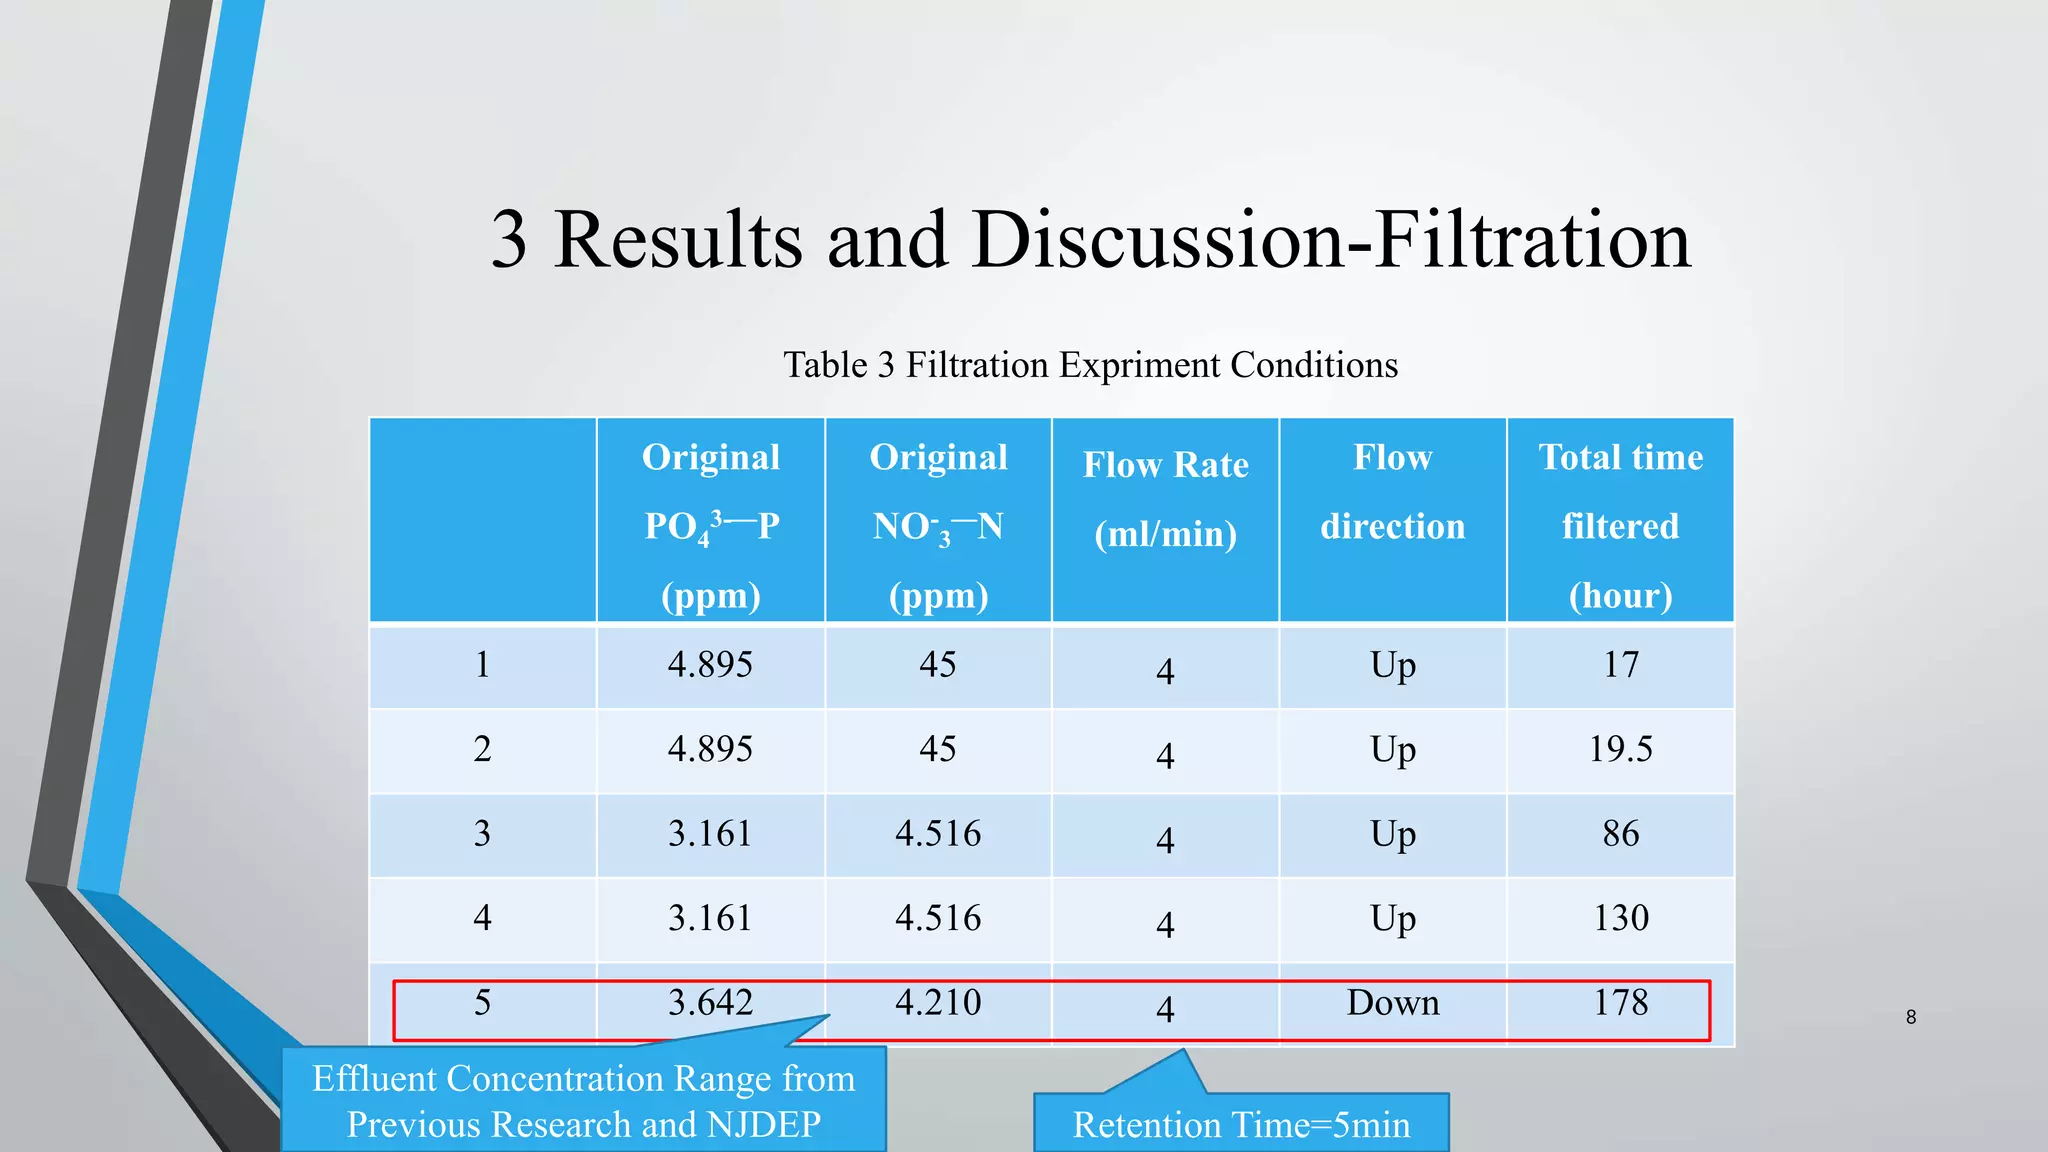
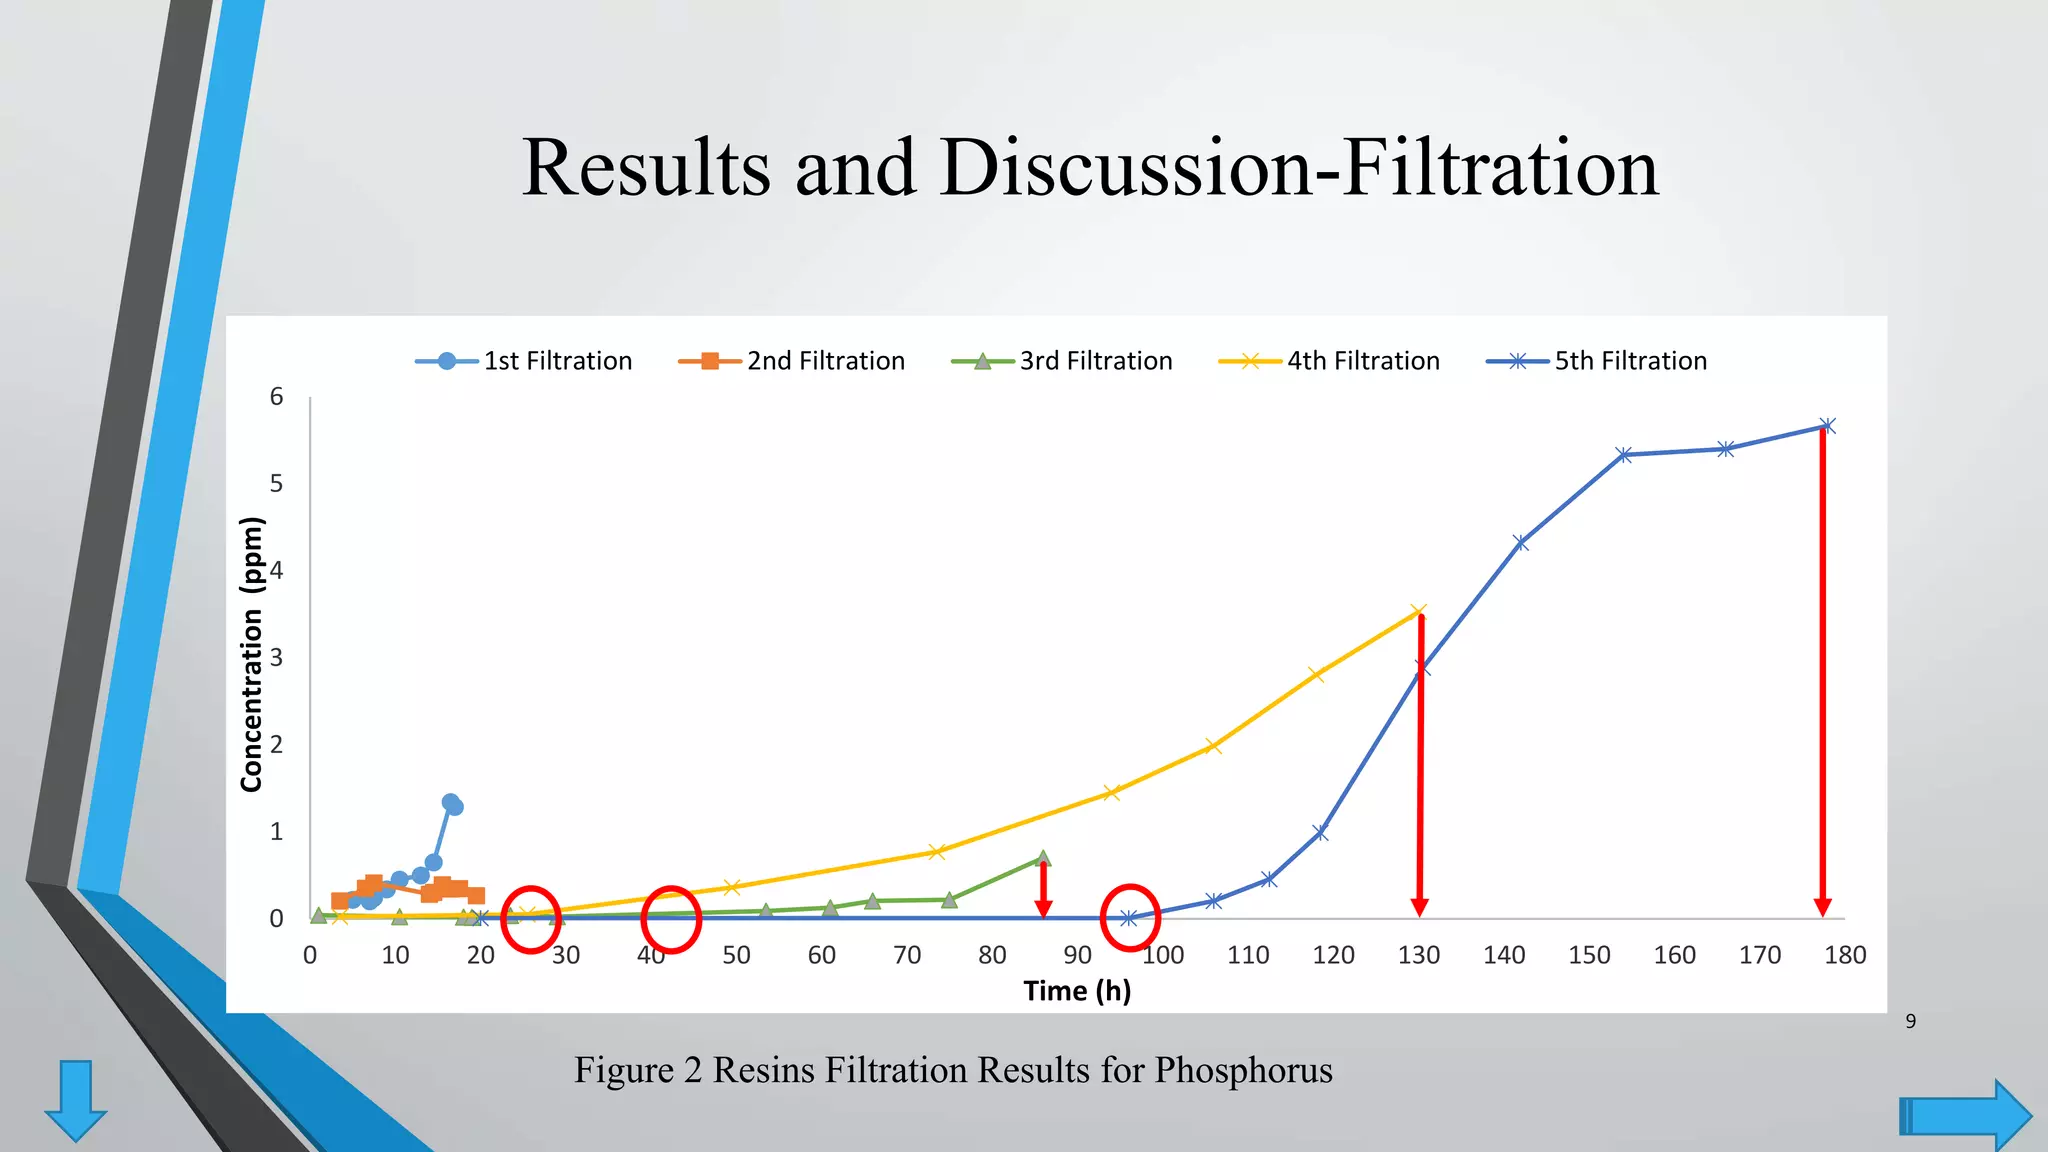
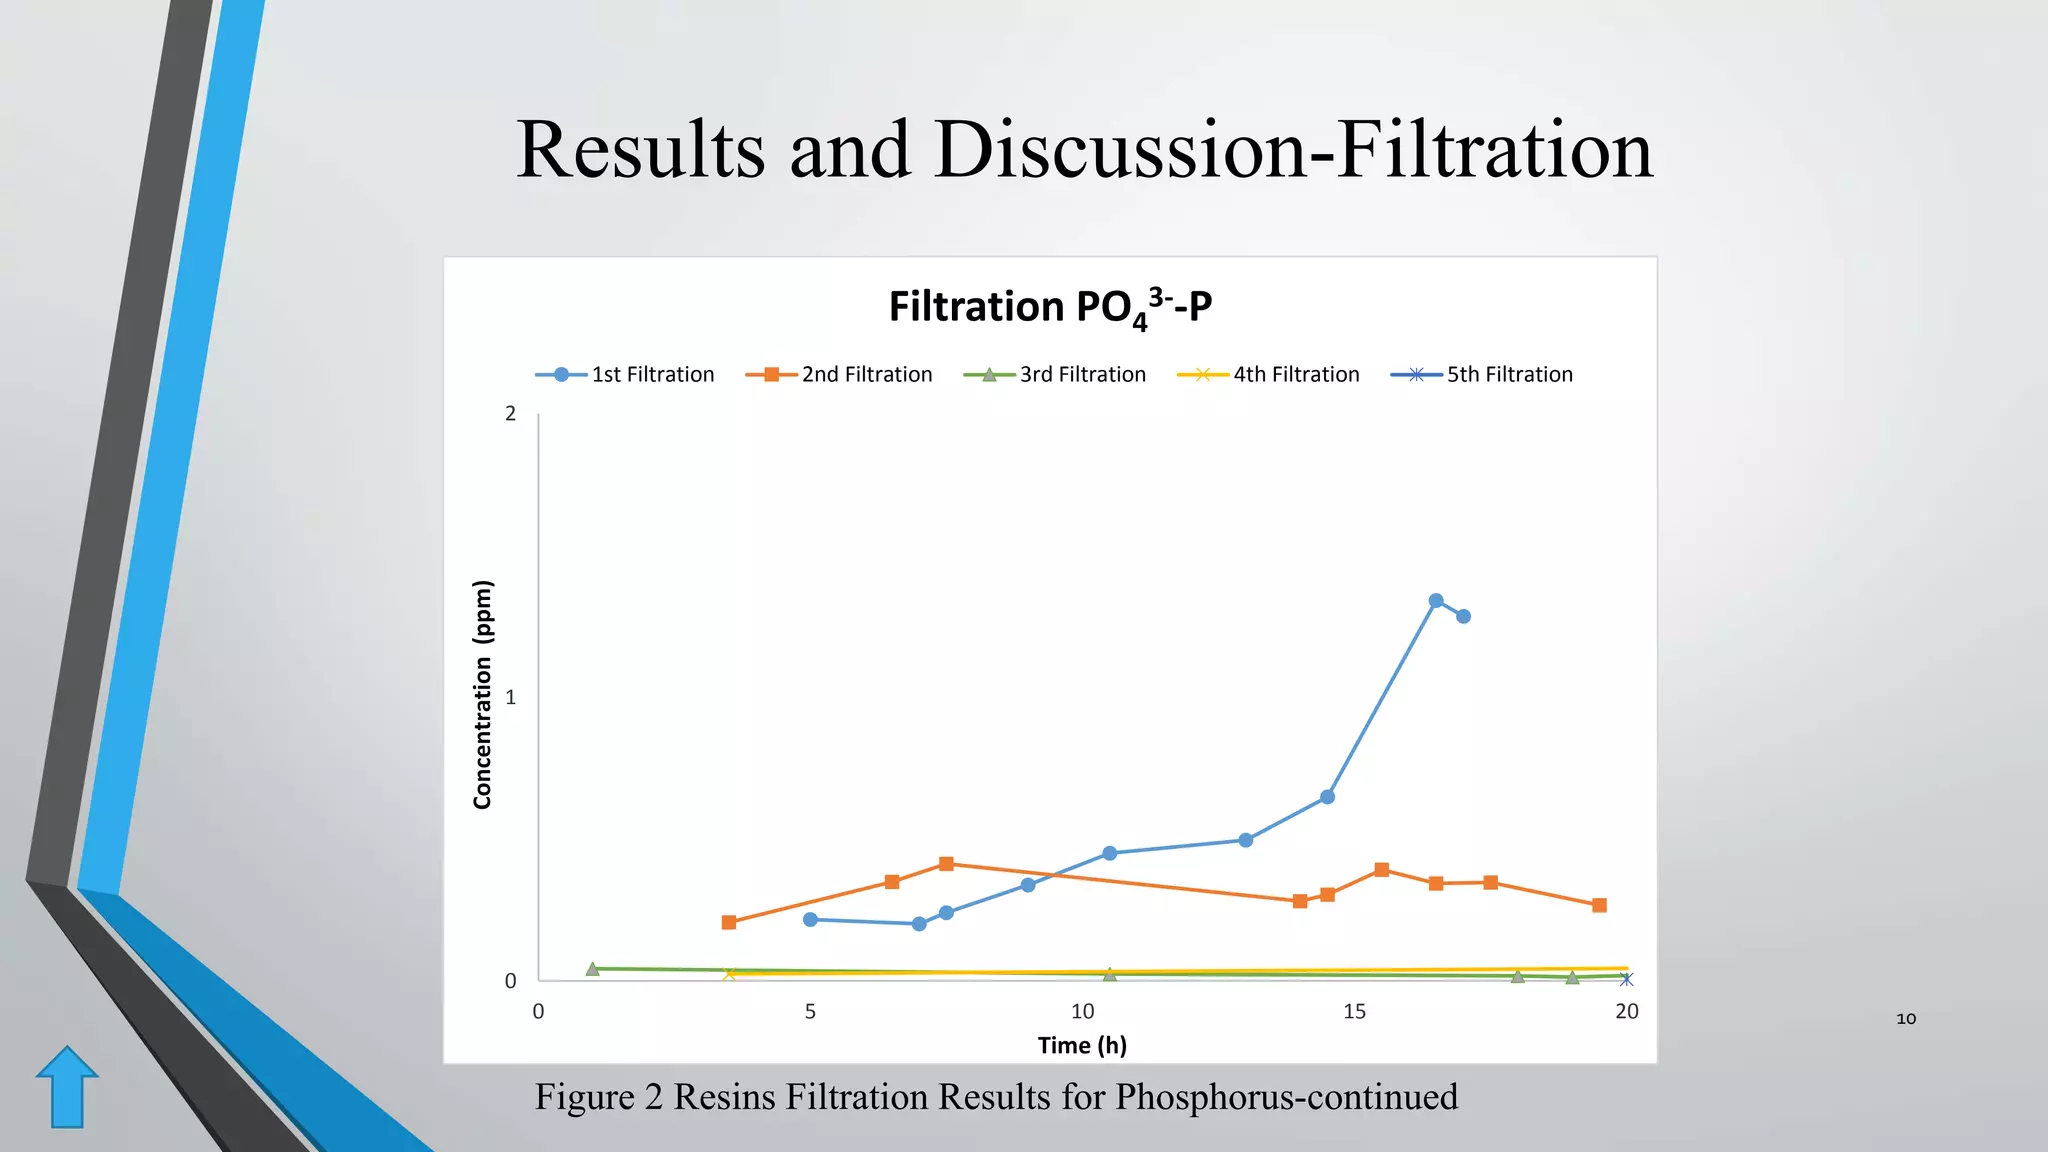
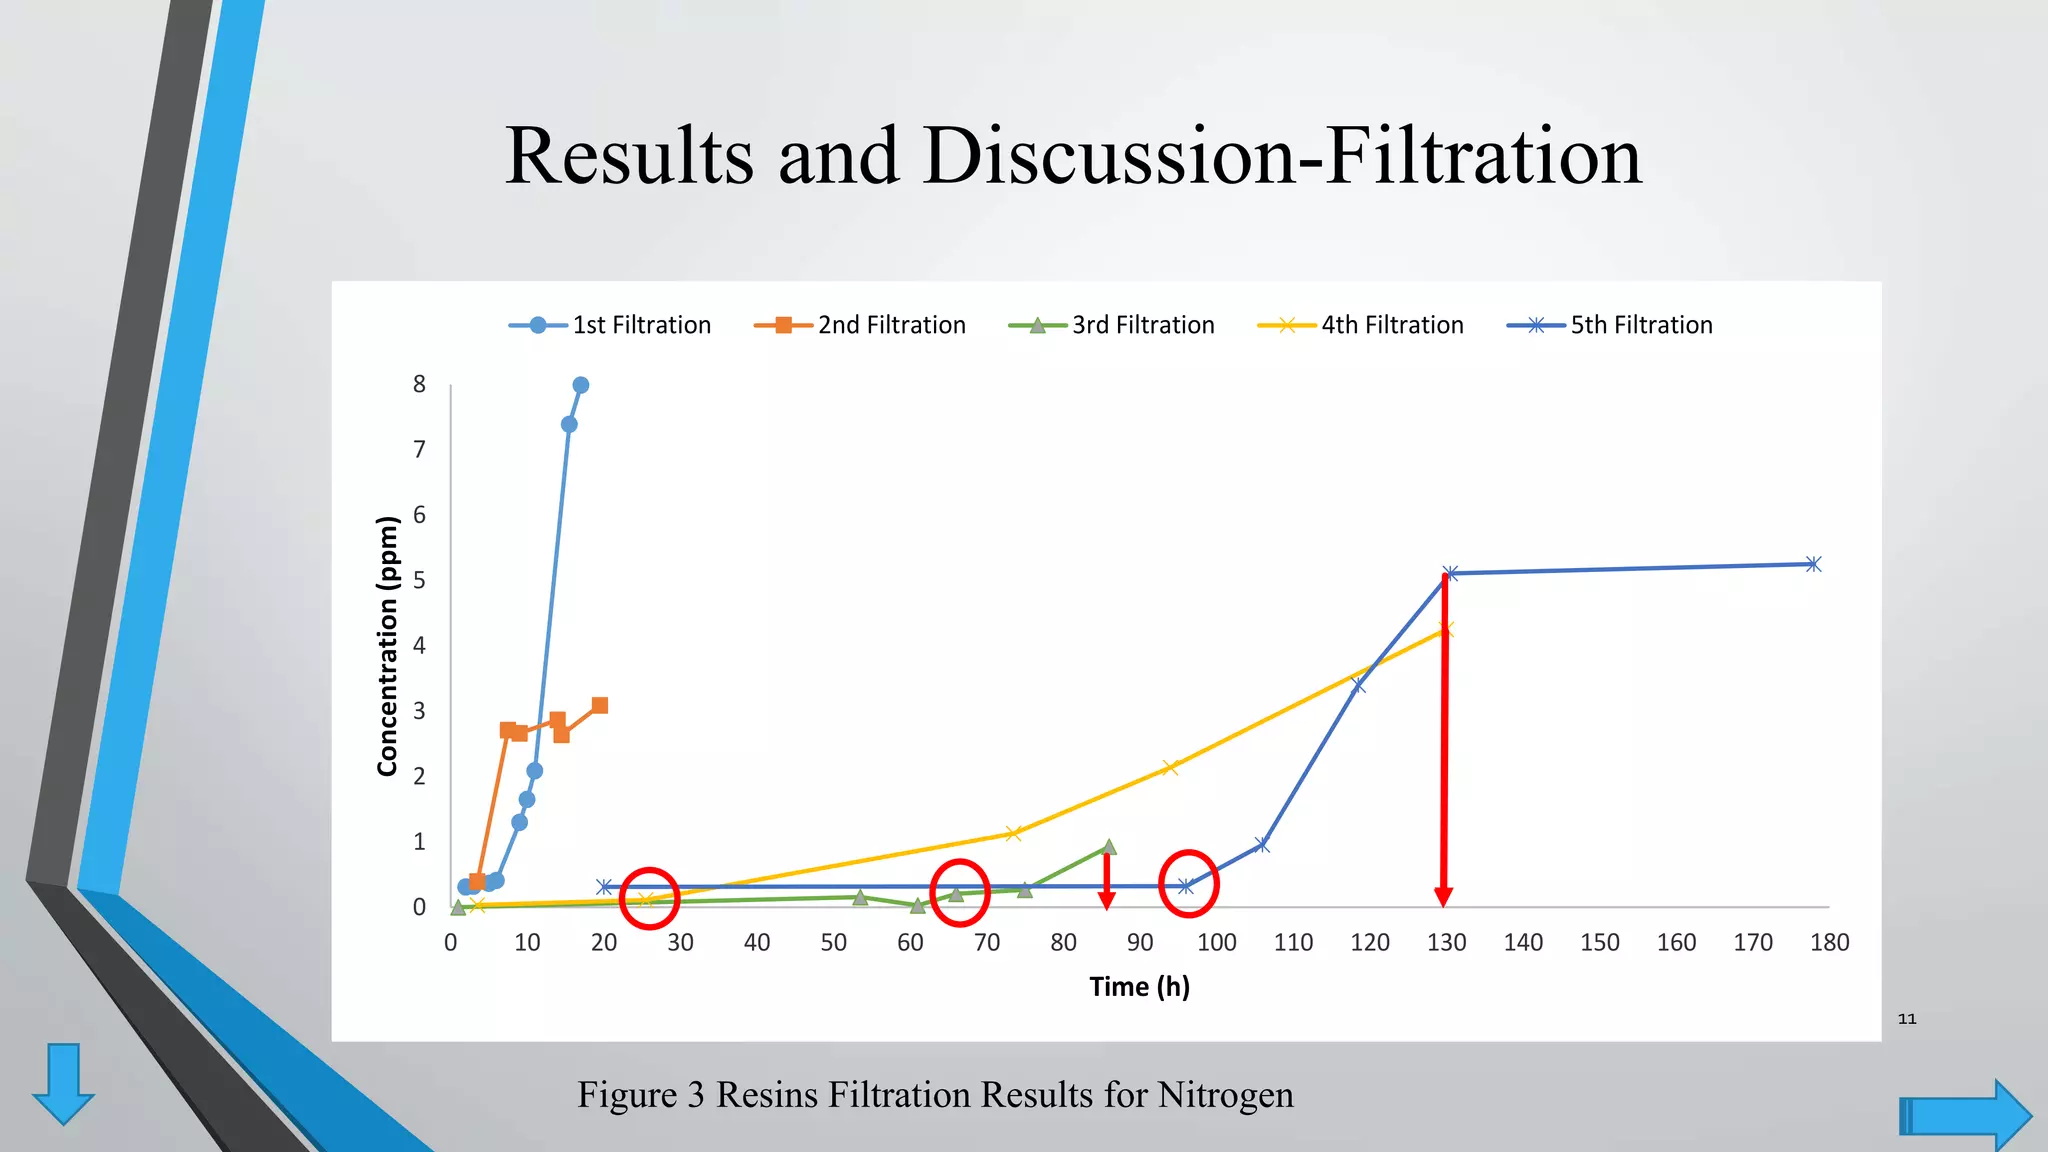
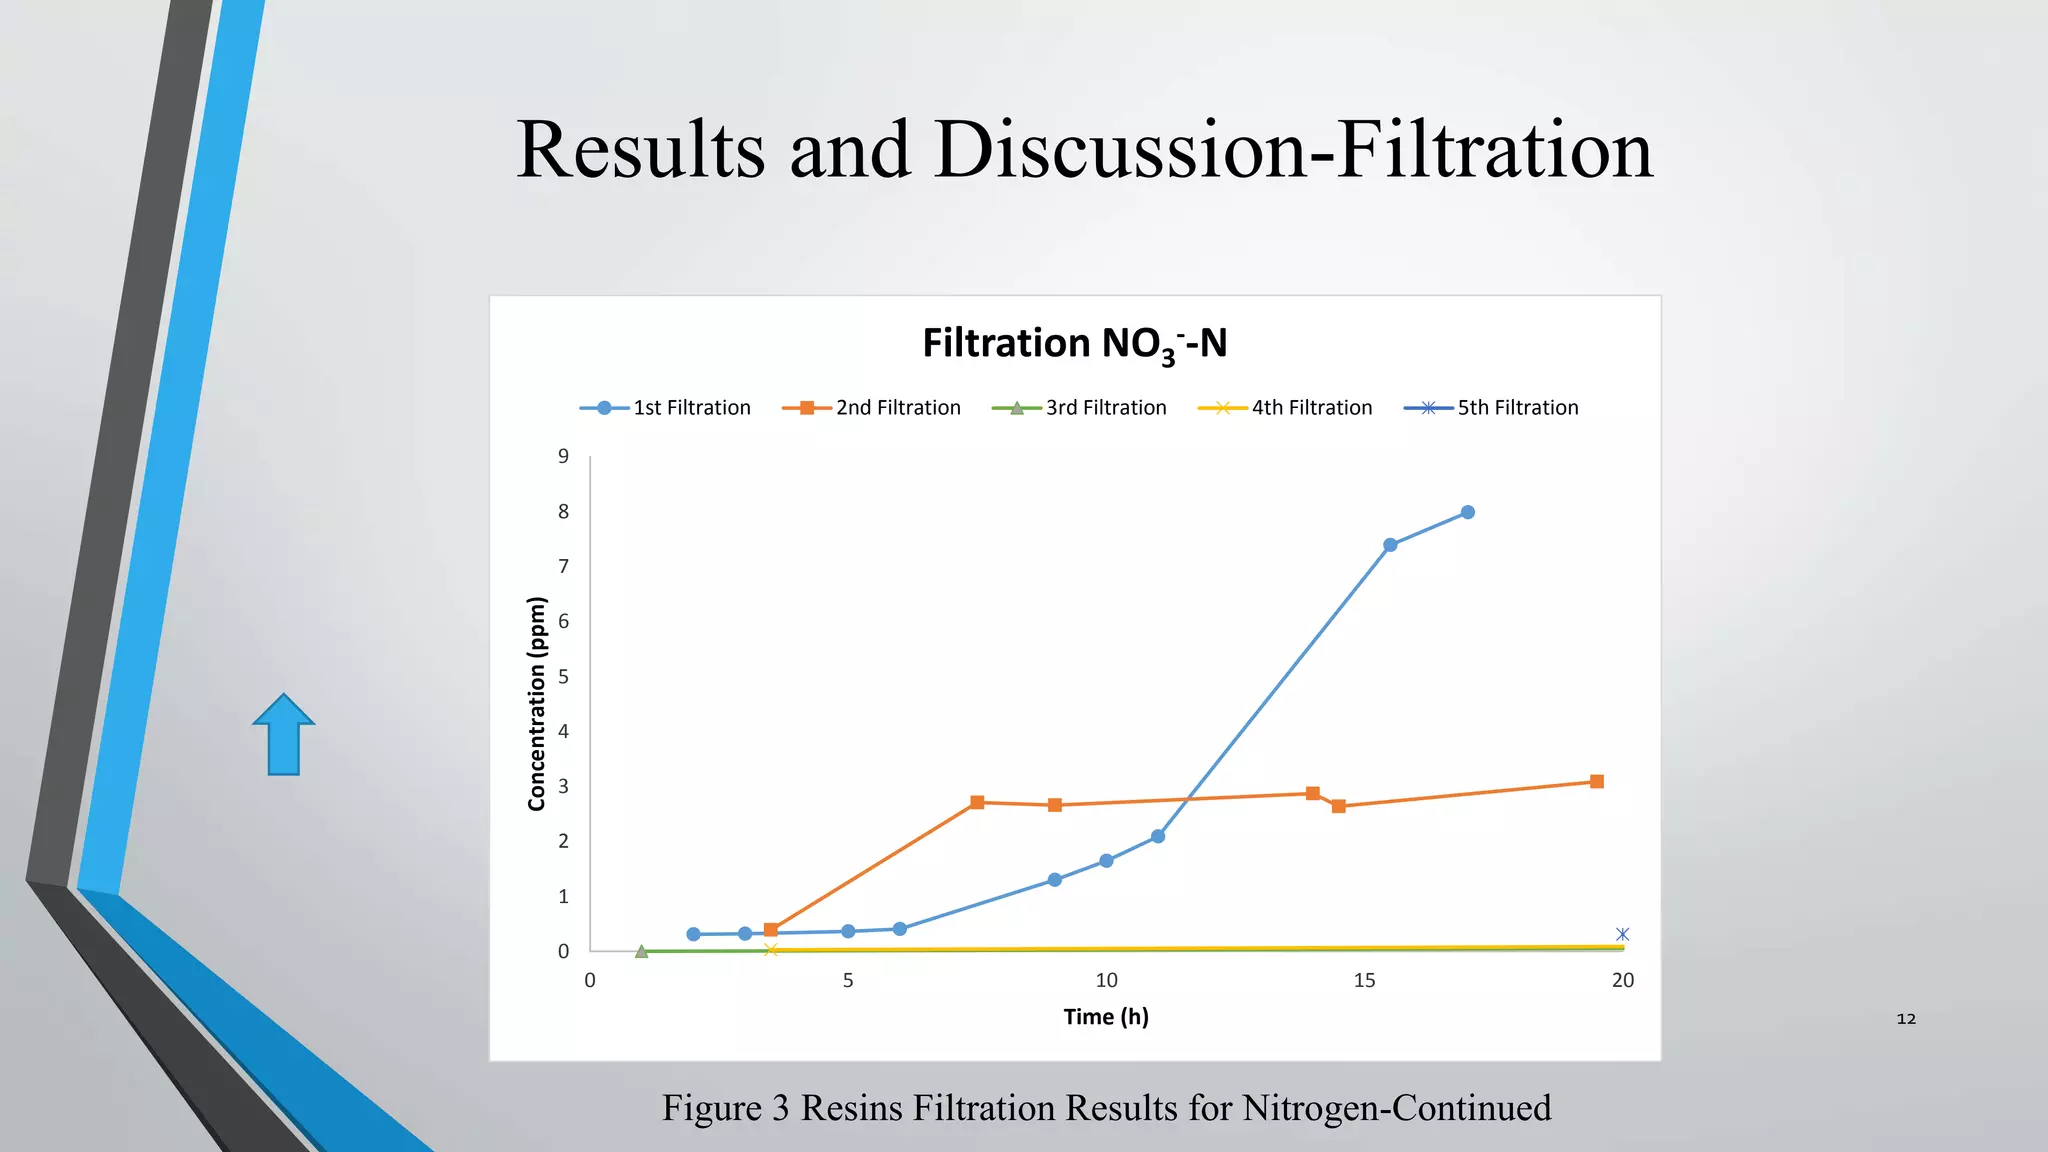
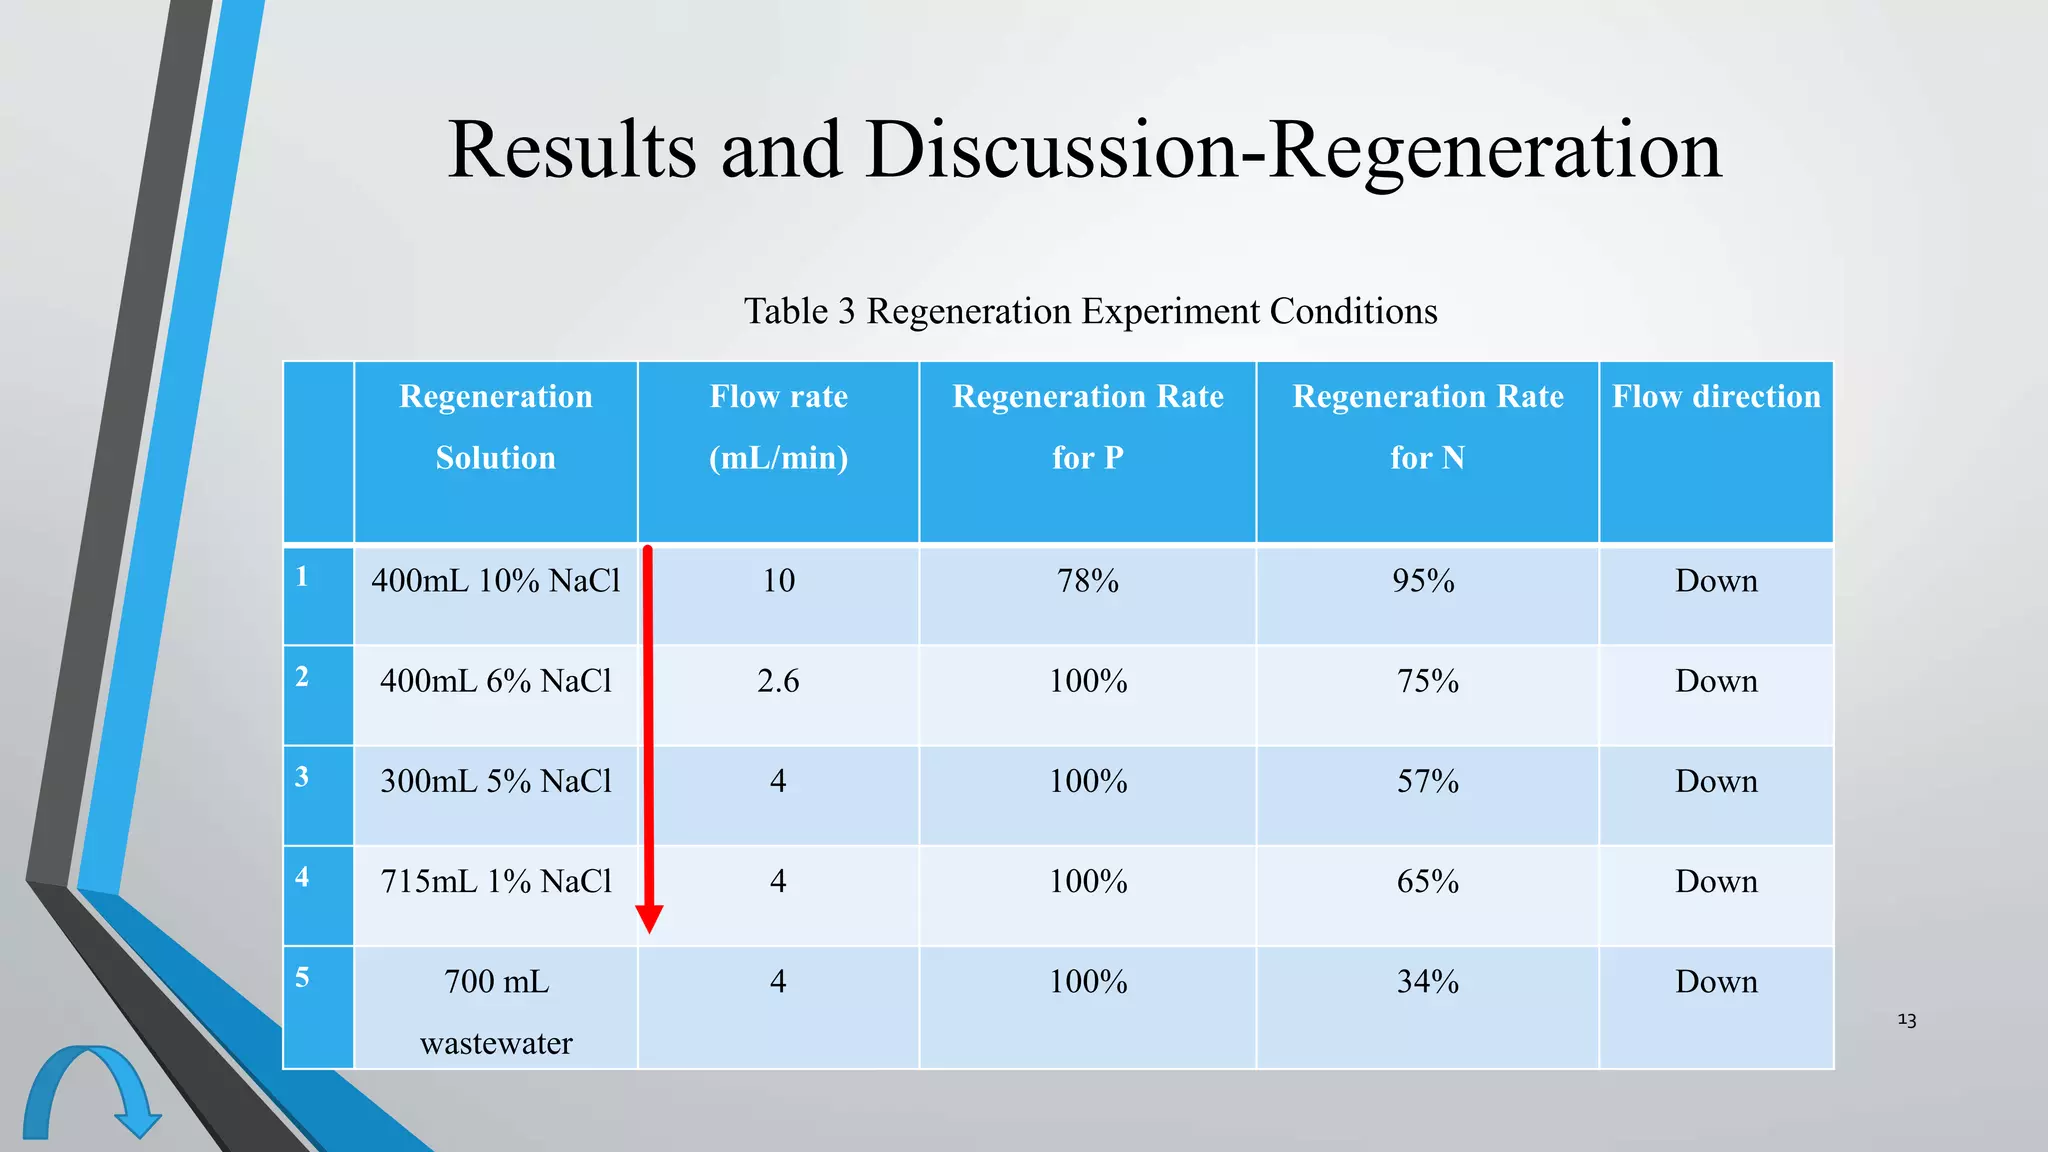
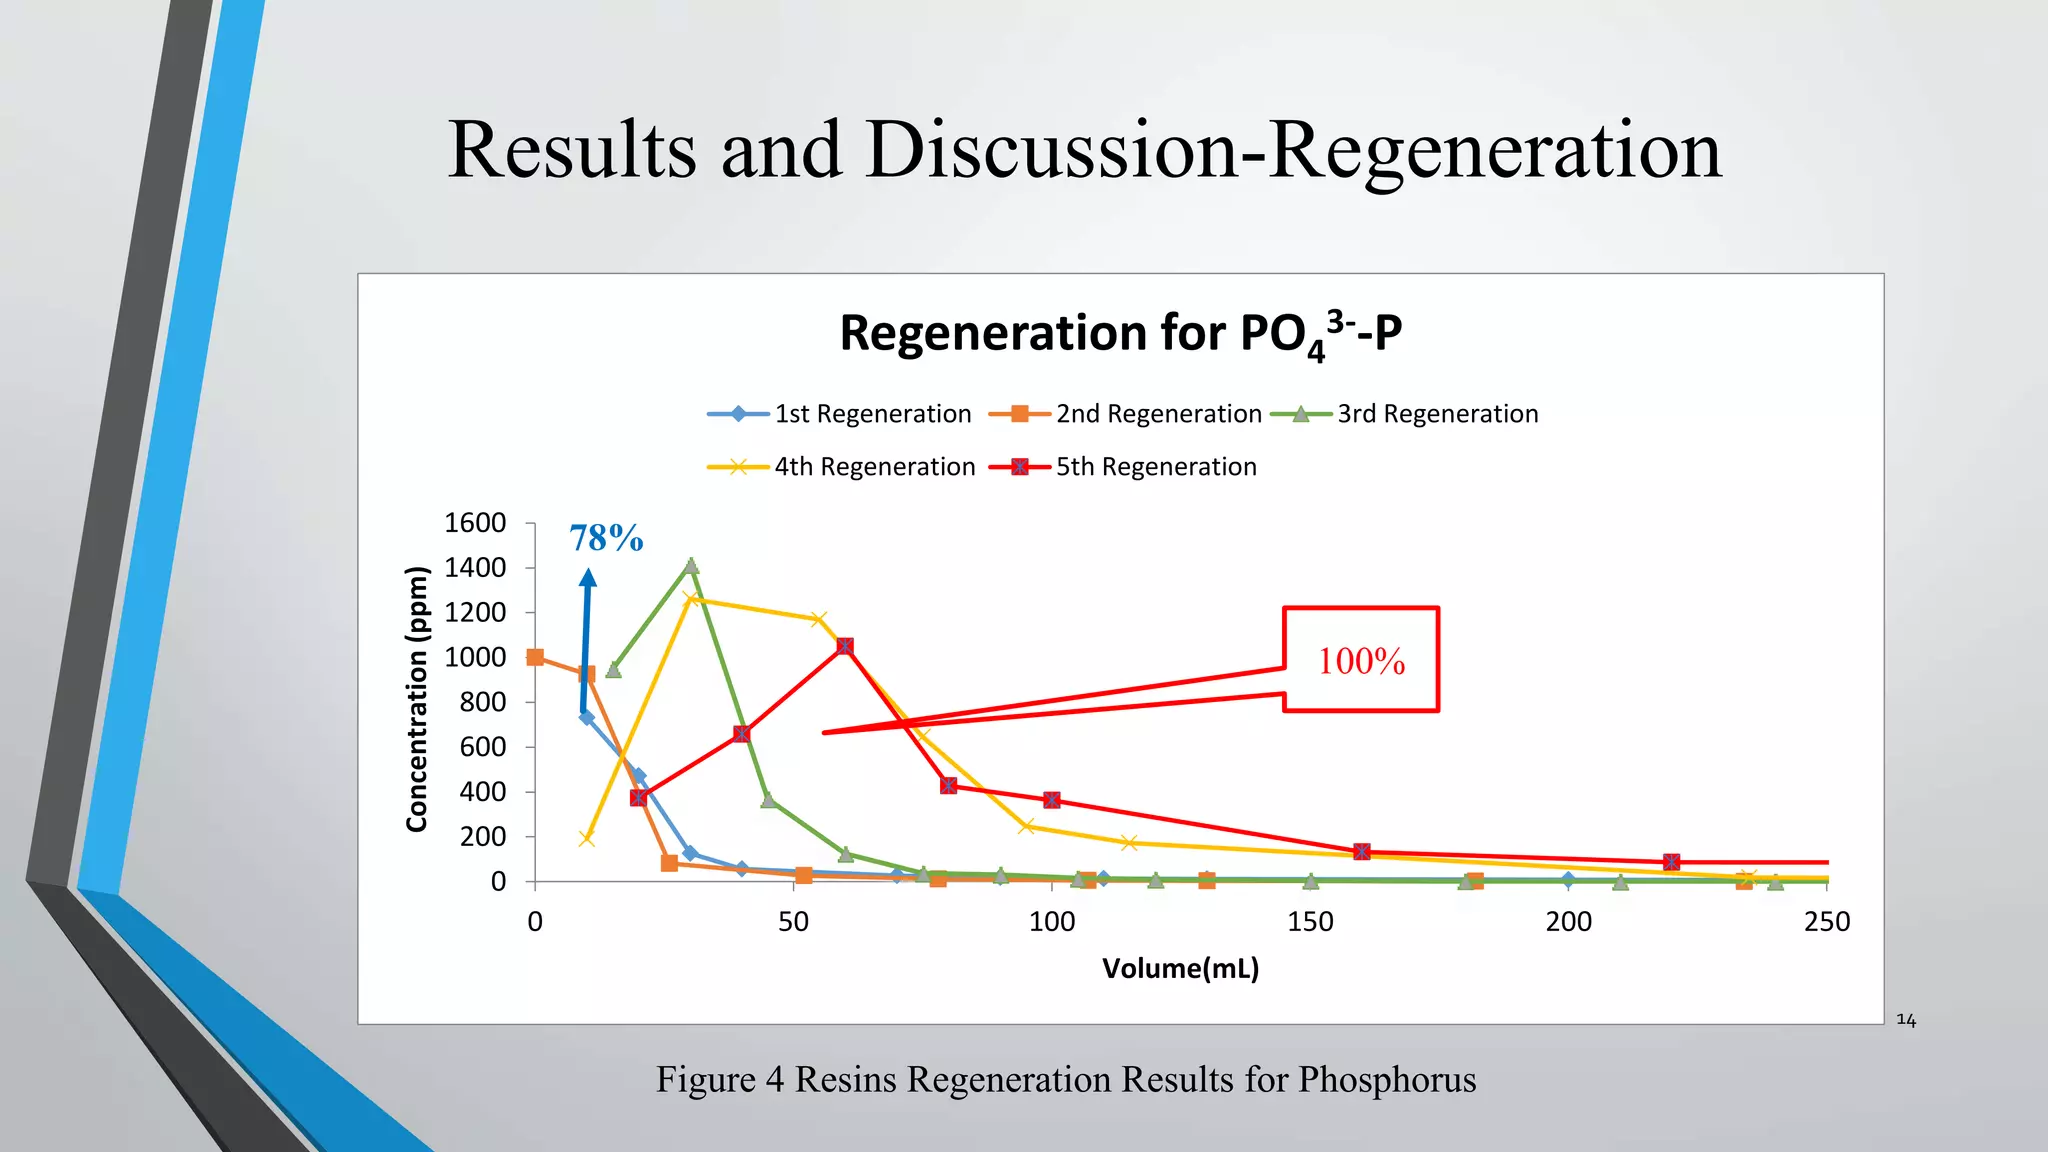
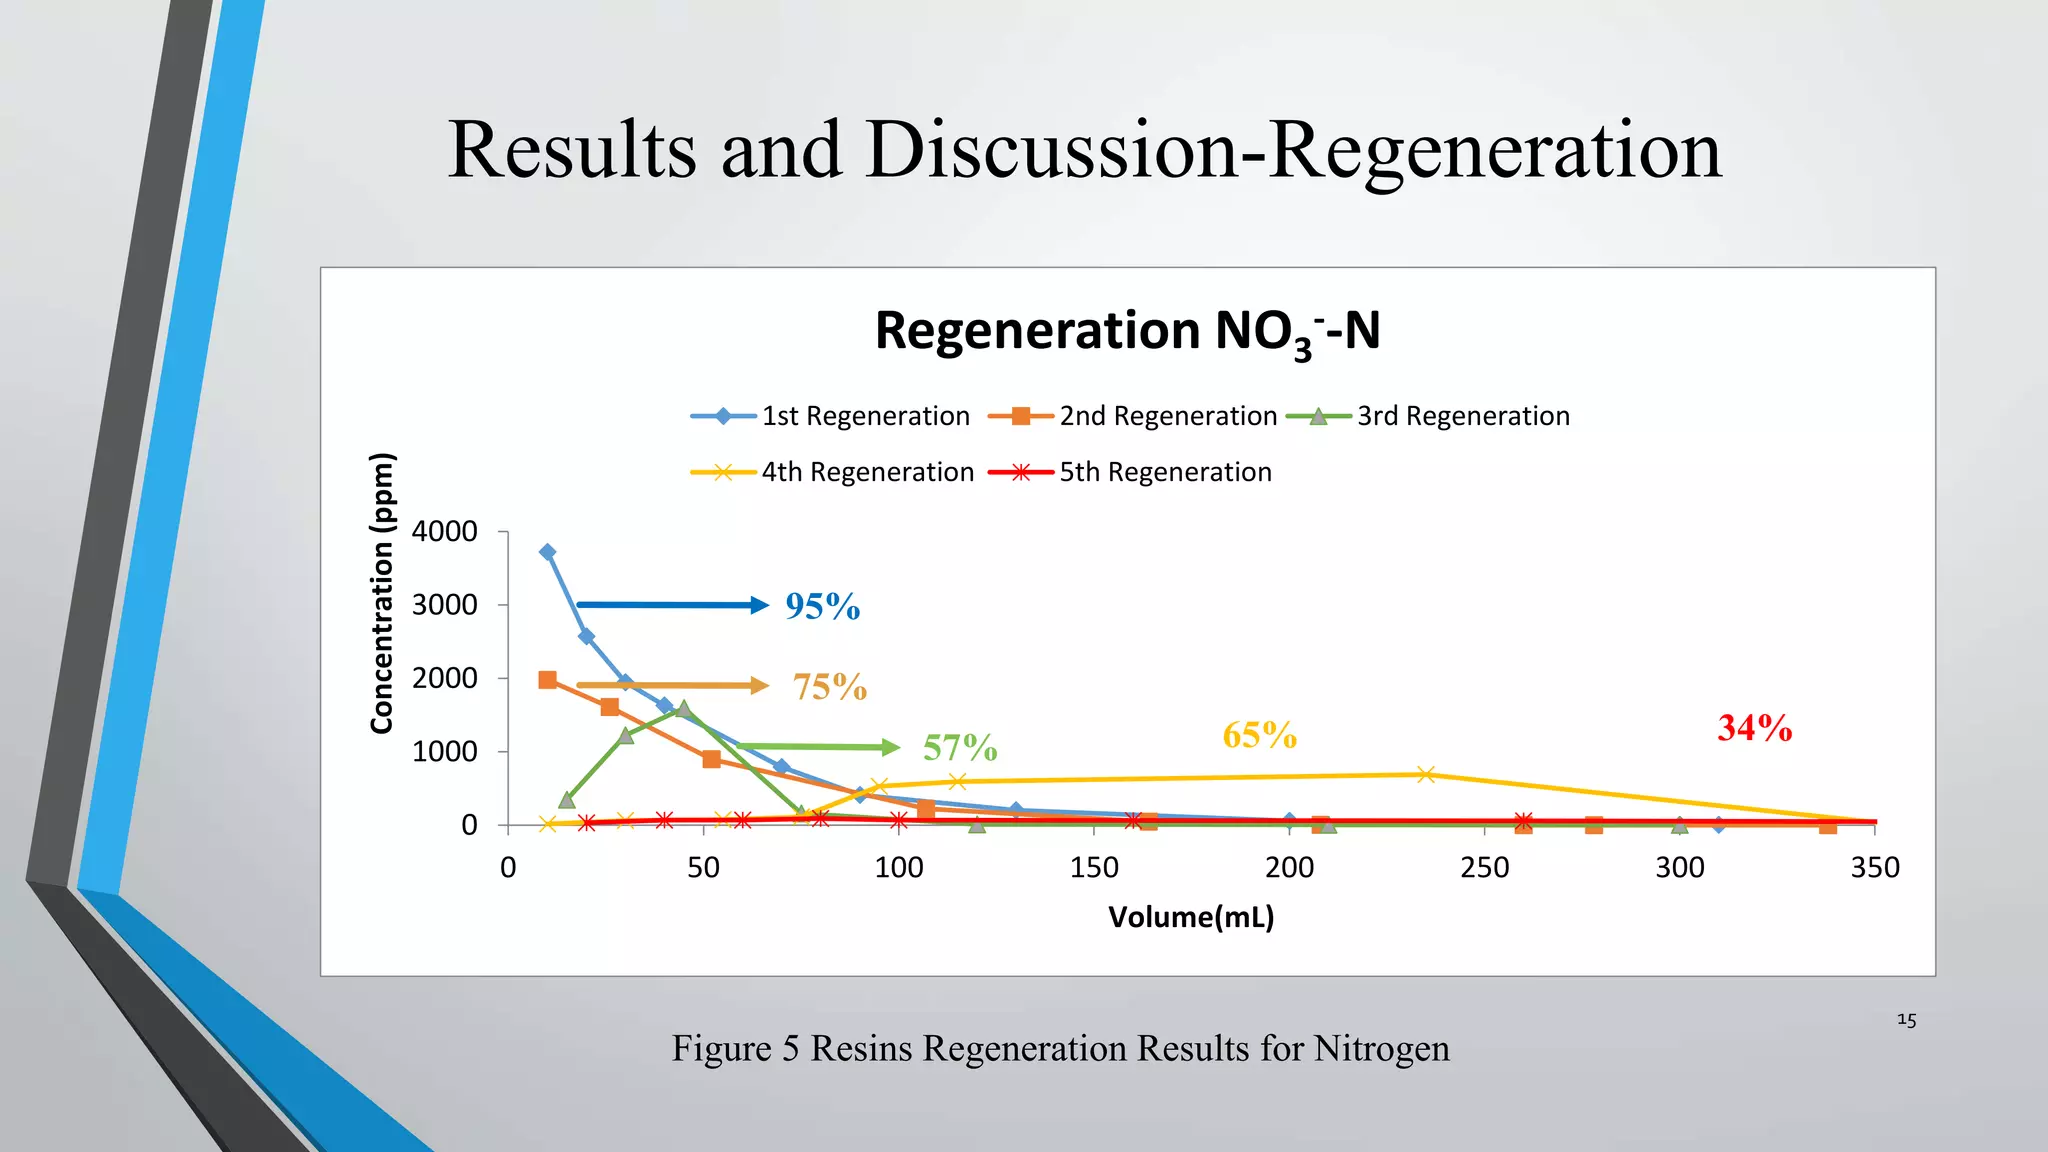
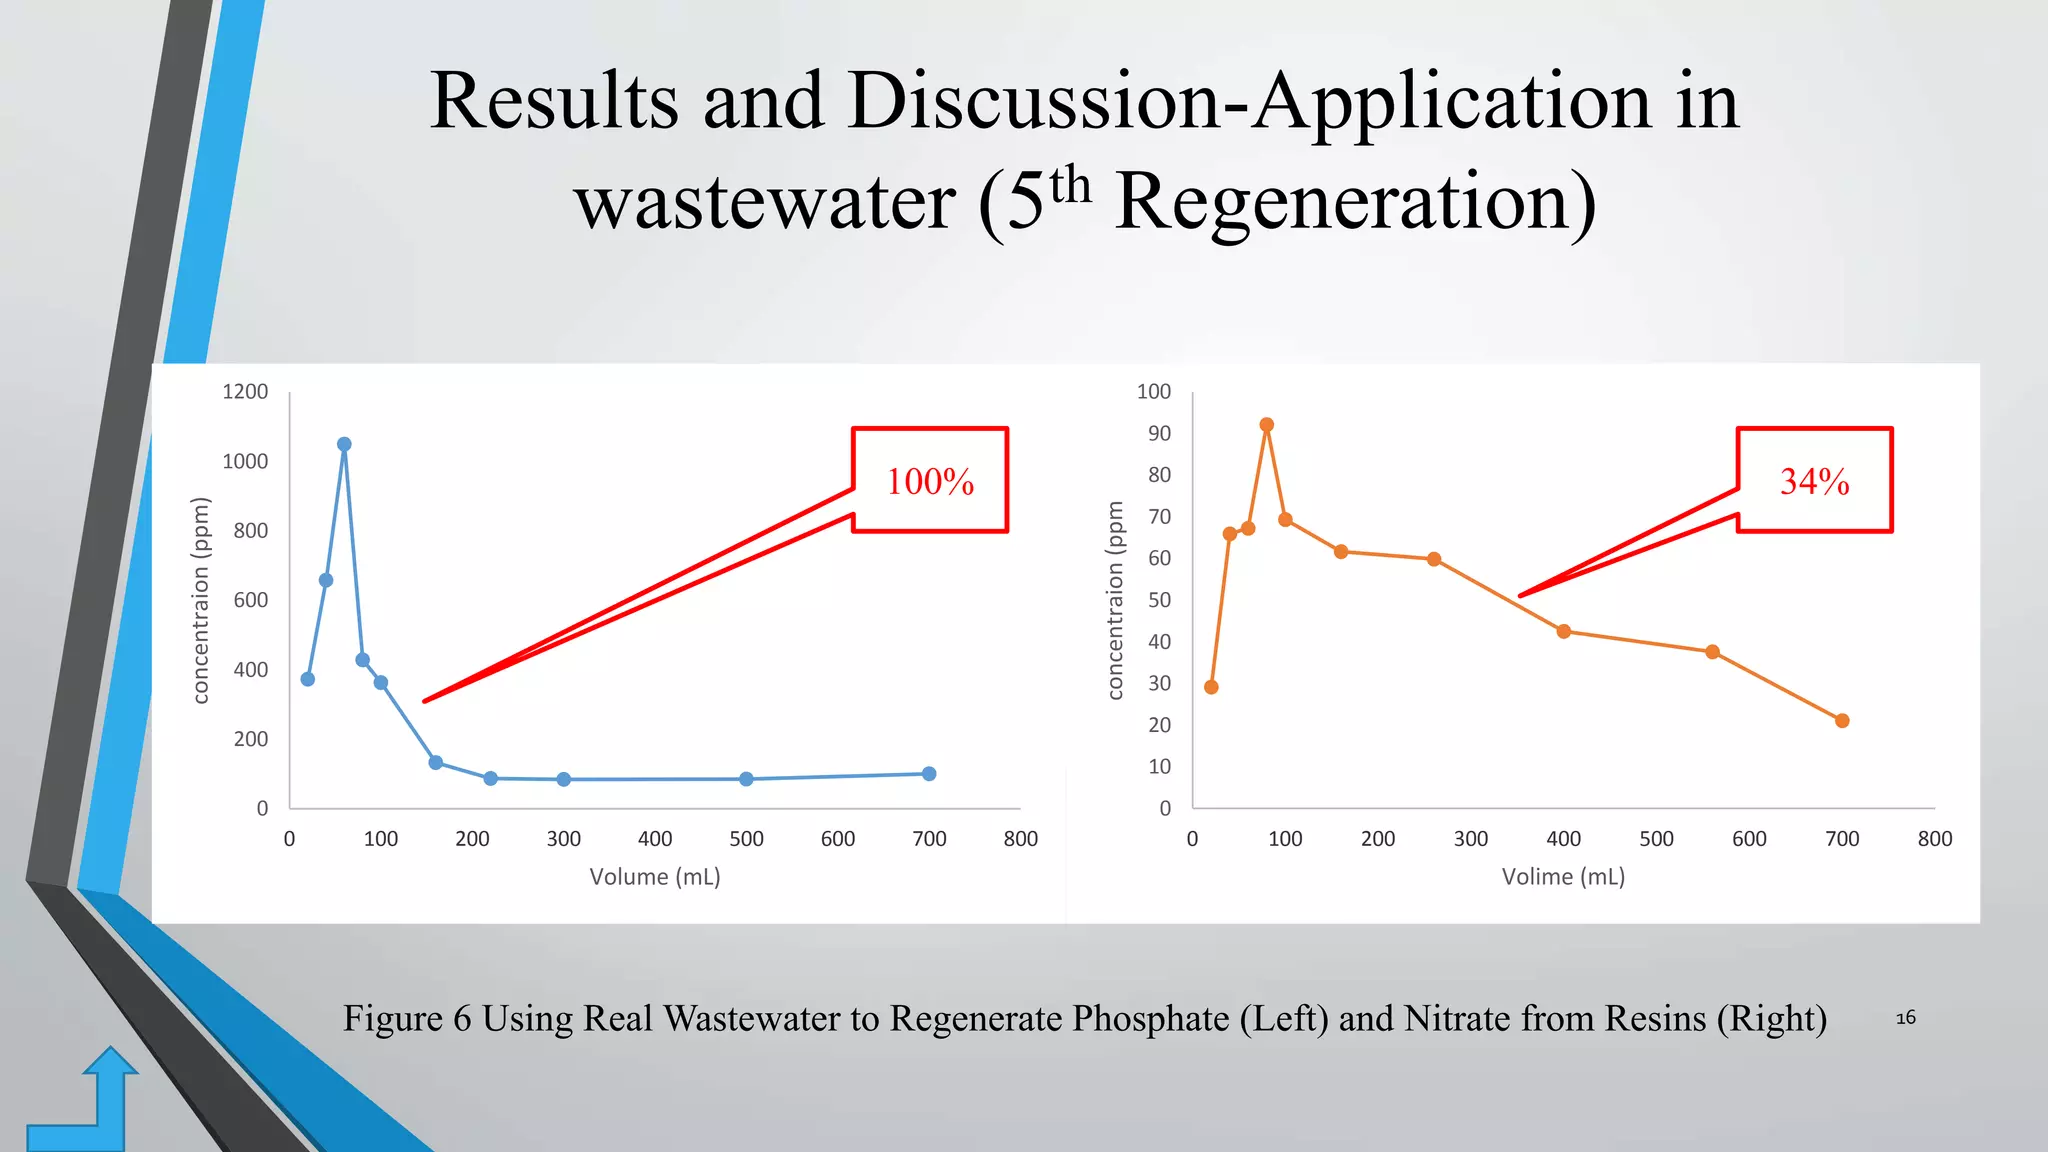
Removal and Regeneration of
Phosphate and Nitrate from
Wastewater Using Anion
Exchange Resins
Zi Ye
EN 800 Special Project
2014 Fall
Professor Meng
1
Outline
•Introduction
•Experiment Design
•Results and Discussion
•Conclusion
2
1 Introduction-Pollutants
Pollutants Applicants Environmental Impact
Phosphorus
(Phosphate-P)
Fertilizer; Water softening;
Metallurgical aspects (steel
production)
• Toxicosis (eutrophication)
• Marine toxicity(cause the
death of fish)
Nitrogen
(Nitrate-N)
Fertilizer; Nitrogen gas;
Nitrogen compounds
• Toxicosis (eutrophication)
• Human health effects(blue
baby syndrome)
• Marine toxicity(cause the
death of fish)
Table 1 Pollutants
3
Introduction-Continued
Methods Materials Advantage Disadvantage
Nancy, et al.
(2015)
Adsorption
Batch
Experiment
hydrated metal oxides,
anionic exchange media
Removal Rate Reached
86% (HFeO)
Multiple materials
were difficult to get
Jie, et al. (2015) Adsorption
Batch
Experiment
activated aluminum
oxide, lanthanum oxide
Achieved both removal
and recovery of
phosphate
High Operation
Temperature
Required (140-
800℃)
Sari Kilpimaa,
et al. (2015)
Adsorption
Batch
Experiment
carbon residue,
activated carbon
residue, commercial
activated carbon
Low Cost Low Removal
Efficiency
Table 2 Previous Research (on Phosphate and Nitrate Removal)
4
Introduction-This Research
• Anion Exchange Resins (AER)
Advantages
Disadvantages
• Remove and Regenerate
• Fast Reaction
• Reusable
• High Cost
Material:
Methods • Filtration Experiment
5
6
2 Experiment Design-Filtration and Regeneration
Start
Experiment
Setup
2nd
Filtration
5th
Filtration
4th
Filtration
3rd
Filtration
1st
Filtration
Prepare
Materials
5th
Regeneration
4th
Regeneration
3rd
Regeneration
2nd
Regeneration
1st
Regeneration
Data AnalysisEnd
Experiment Design-Filtration and Regeneration
Figure 1 Filtration and regeneration experiment set up
1
4
3
2
4
3
21
Up Flow
Down Flow
7
Table 3 Filtration Expriment Conditions
3 Results and Discussion-Filtration
8
Original
PO4
3-—P
(ppm)
Original
NO-
3
—N
(ppm)
Flow Rate
(ml/min)
Flow
direction
Total time
filtered
(hour)
1 4.895 45 4 Up 17
2 4.895 45 4 Up 19.5
3 3.161 4.516 4 Up 86
4 3.161 4.516 4 Up 130
5 3.642 4.210 4 Down 178
Retention Time=5min
Effluent Concentration Range from
Previous Research and NJDEP
Results and Discussion-Filtration
0
1
2
3
4
5
6
0 10 20 30 40 50 60 70 80 90 100 110 120 130 140 150 160 170 180
Concentration(ppm)
Time (h)
1st Filtration 2nd Filtration 3rd Filtration 4th Filtration 5th Filtration
Figure 2 Resins Filtration Results for Phosphorus
9
Results and Discussion-Filtration
0
1
2
0 5 10 15 20
Concentration(ppm)
Time (h)
Filtration PO4
3--P
1st Filtration 2nd Filtration 3rd Filtration 4th Filtration 5th Filtration
Figure 2 Resins Filtration Results for Phosphorus-continued
10
Results and Discussion-Filtration
0
1
2
3
4
5
6
7
8
0 10 20 30 40 50 60 70 80 90 100 110 120 130 140 150 160 170 180
Concentration(ppm)
Time (h)
1st Filtration 2nd Filtration 3rd Filtration 4th Filtration 5th Filtration
Figure 3 Resins Filtration Results for Nitrogen
11
Results and Discussion-Filtration
0
1
2
3
4
5
6
7
8
9
0 5 10 15 20
Concentration(ppm)
Time (h)
Filtration NO3
--N
1st Filtration 2nd Filtration 3rd Filtration 4th Filtration 5th Filtration
Figure 3 Resins Filtration Results for Nitrogen-Continued
12
Table 3 Regeneration Experiment Conditions
Regeneration
Solution
Flow rate
(mL/min)
Regeneration Rate
for P
Regeneration Rate
for N
Flow direction
1 400mL 10% NaCl 10 78% 95% Down
2 400mL 6% NaCl 2.6 100% 75% Down
3 300mL 5% NaCl 4 100% 57% Down
4 715mL 1% NaCl 4 100% 65% Down
5 700 mL
wastewater
4 100% 34% Down
Results and Discussion-Regeneration
13
Figure 4 Resins Regeneration Results for Phosphorus
0
200
400
600
800
1000
1200
1400
1600
0 50 100 150 200 250
Concentration(ppm)
Volume(mL)
Regeneration for PO4
3--P
1st Regeneration 2nd Regeneration 3rd Regeneration
4th Regeneration 5th Regeneration
Results and Discussion-Regeneration
14
78%
100%
0
1000
2000
3000
4000
0 50 100 150 200 250 300 350
Concentration(ppm)
Volume(mL)
Regeneration NO3
--N
1st Regeneration 2nd Regeneration 3rd Regeneration
4th Regeneration 5th Regeneration
Figure 5 Resins Regeneration Results for Nitrogen
Results and Discussion-Regeneration
15
95%
75%
57% 65% 34%
Figure 6 Using Real Wastewater to Regenerate Phosphate (Left) and Nitrate from Resins (Right)
0
200
400
600
800
1000
1200
0 100 200 300 400 500 600 700 800
concentraion(ppm)
Volume (mL)
0
10
20
30
40
50
60
70
80
90
100
0 100 200 300 400 500 600 700 800
concentraion(ppm
Volime (mL)
Results and Discussion-Application in
wastewater (5th Regeneration)
16
100% 34%
17
Anion Exchange Resins (AER) can remove
phosphate and nitrate with high efficiency, as
well as release them
AER reaction can
last up to 180 hours
in this experiment
The regeneration rate for
phosphate and nitrate
reached 78%~100%,
34%~95%, respectively
4 Conclusion
Thank you !
18

Project Presentation

  • 1.
    Removal and Regenerationof Phosphate and Nitrate from Wastewater Using Anion Exchange Resins Zi Ye EN 800 Special Project 2014 Fall Professor Meng 1
  • 2.
  • 3.
    1 Introduction-Pollutants Pollutants ApplicantsEnvironmental Impact Phosphorus (Phosphate-P) Fertilizer; Water softening; Metallurgical aspects (steel production) • Toxicosis (eutrophication) • Marine toxicity(cause the death of fish) Nitrogen (Nitrate-N) Fertilizer; Nitrogen gas; Nitrogen compounds • Toxicosis (eutrophication) • Human health effects(blue baby syndrome) • Marine toxicity(cause the death of fish) Table 1 Pollutants 3
  • 4.
    Introduction-Continued Methods Materials AdvantageDisadvantage Nancy, et al. (2015) Adsorption Batch Experiment hydrated metal oxides, anionic exchange media Removal Rate Reached 86% (HFeO) Multiple materials were difficult to get Jie, et al. (2015) Adsorption Batch Experiment activated aluminum oxide, lanthanum oxide Achieved both removal and recovery of phosphate High Operation Temperature Required (140- 800℃) Sari Kilpimaa, et al. (2015) Adsorption Batch Experiment carbon residue, activated carbon residue, commercial activated carbon Low Cost Low Removal Efficiency Table 2 Previous Research (on Phosphate and Nitrate Removal) 4
  • 5.
    Introduction-This Research • AnionExchange Resins (AER) Advantages Disadvantages • Remove and Regenerate • Fast Reaction • Reusable • High Cost Material: Methods • Filtration Experiment 5
  • 6.
    6 2 Experiment Design-Filtrationand Regeneration Start Experiment Setup 2nd Filtration 5th Filtration 4th Filtration 3rd Filtration 1st Filtration Prepare Materials 5th Regeneration 4th Regeneration 3rd Regeneration 2nd Regeneration 1st Regeneration Data AnalysisEnd
  • 7.
    Experiment Design-Filtration andRegeneration Figure 1 Filtration and regeneration experiment set up 1 4 3 2 4 3 21 Up Flow Down Flow 7
  • 8.
    Table 3 FiltrationExpriment Conditions 3 Results and Discussion-Filtration 8 Original PO4 3-—P (ppm) Original NO- 3 —N (ppm) Flow Rate (ml/min) Flow direction Total time filtered (hour) 1 4.895 45 4 Up 17 2 4.895 45 4 Up 19.5 3 3.161 4.516 4 Up 86 4 3.161 4.516 4 Up 130 5 3.642 4.210 4 Down 178 Retention Time=5min Effluent Concentration Range from Previous Research and NJDEP
  • 9.
    Results and Discussion-Filtration 0 1 2 3 4 5 6 010 20 30 40 50 60 70 80 90 100 110 120 130 140 150 160 170 180 Concentration(ppm) Time (h) 1st Filtration 2nd Filtration 3rd Filtration 4th Filtration 5th Filtration Figure 2 Resins Filtration Results for Phosphorus 9
  • 10.
    Results and Discussion-Filtration 0 1 2 05 10 15 20 Concentration(ppm) Time (h) Filtration PO4 3--P 1st Filtration 2nd Filtration 3rd Filtration 4th Filtration 5th Filtration Figure 2 Resins Filtration Results for Phosphorus-continued 10
  • 11.
    Results and Discussion-Filtration 0 1 2 3 4 5 6 7 8 010 20 30 40 50 60 70 80 90 100 110 120 130 140 150 160 170 180 Concentration(ppm) Time (h) 1st Filtration 2nd Filtration 3rd Filtration 4th Filtration 5th Filtration Figure 3 Resins Filtration Results for Nitrogen 11
  • 12.
    Results and Discussion-Filtration 0 1 2 3 4 5 6 7 8 9 05 10 15 20 Concentration(ppm) Time (h) Filtration NO3 --N 1st Filtration 2nd Filtration 3rd Filtration 4th Filtration 5th Filtration Figure 3 Resins Filtration Results for Nitrogen-Continued 12
  • 13.
    Table 3 RegenerationExperiment Conditions Regeneration Solution Flow rate (mL/min) Regeneration Rate for P Regeneration Rate for N Flow direction 1 400mL 10% NaCl 10 78% 95% Down 2 400mL 6% NaCl 2.6 100% 75% Down 3 300mL 5% NaCl 4 100% 57% Down 4 715mL 1% NaCl 4 100% 65% Down 5 700 mL wastewater 4 100% 34% Down Results and Discussion-Regeneration 13
  • 14.
    Figure 4 ResinsRegeneration Results for Phosphorus 0 200 400 600 800 1000 1200 1400 1600 0 50 100 150 200 250 Concentration(ppm) Volume(mL) Regeneration for PO4 3--P 1st Regeneration 2nd Regeneration 3rd Regeneration 4th Regeneration 5th Regeneration Results and Discussion-Regeneration 14 78% 100%
  • 15.
    0 1000 2000 3000 4000 0 50 100150 200 250 300 350 Concentration(ppm) Volume(mL) Regeneration NO3 --N 1st Regeneration 2nd Regeneration 3rd Regeneration 4th Regeneration 5th Regeneration Figure 5 Resins Regeneration Results for Nitrogen Results and Discussion-Regeneration 15 95% 75% 57% 65% 34%
  • 16.
    Figure 6 UsingReal Wastewater to Regenerate Phosphate (Left) and Nitrate from Resins (Right) 0 200 400 600 800 1000 1200 0 100 200 300 400 500 600 700 800 concentraion(ppm) Volume (mL) 0 10 20 30 40 50 60 70 80 90 100 0 100 200 300 400 500 600 700 800 concentraion(ppm Volime (mL) Results and Discussion-Application in wastewater (5th Regeneration) 16 100% 34%
  • 17.
    17 Anion Exchange Resins(AER) can remove phosphate and nitrate with high efficiency, as well as release them AER reaction can last up to 180 hours in this experiment The regeneration rate for phosphate and nitrate reached 78%~100%, 34%~95%, respectively 4 Conclusion
  • 18.