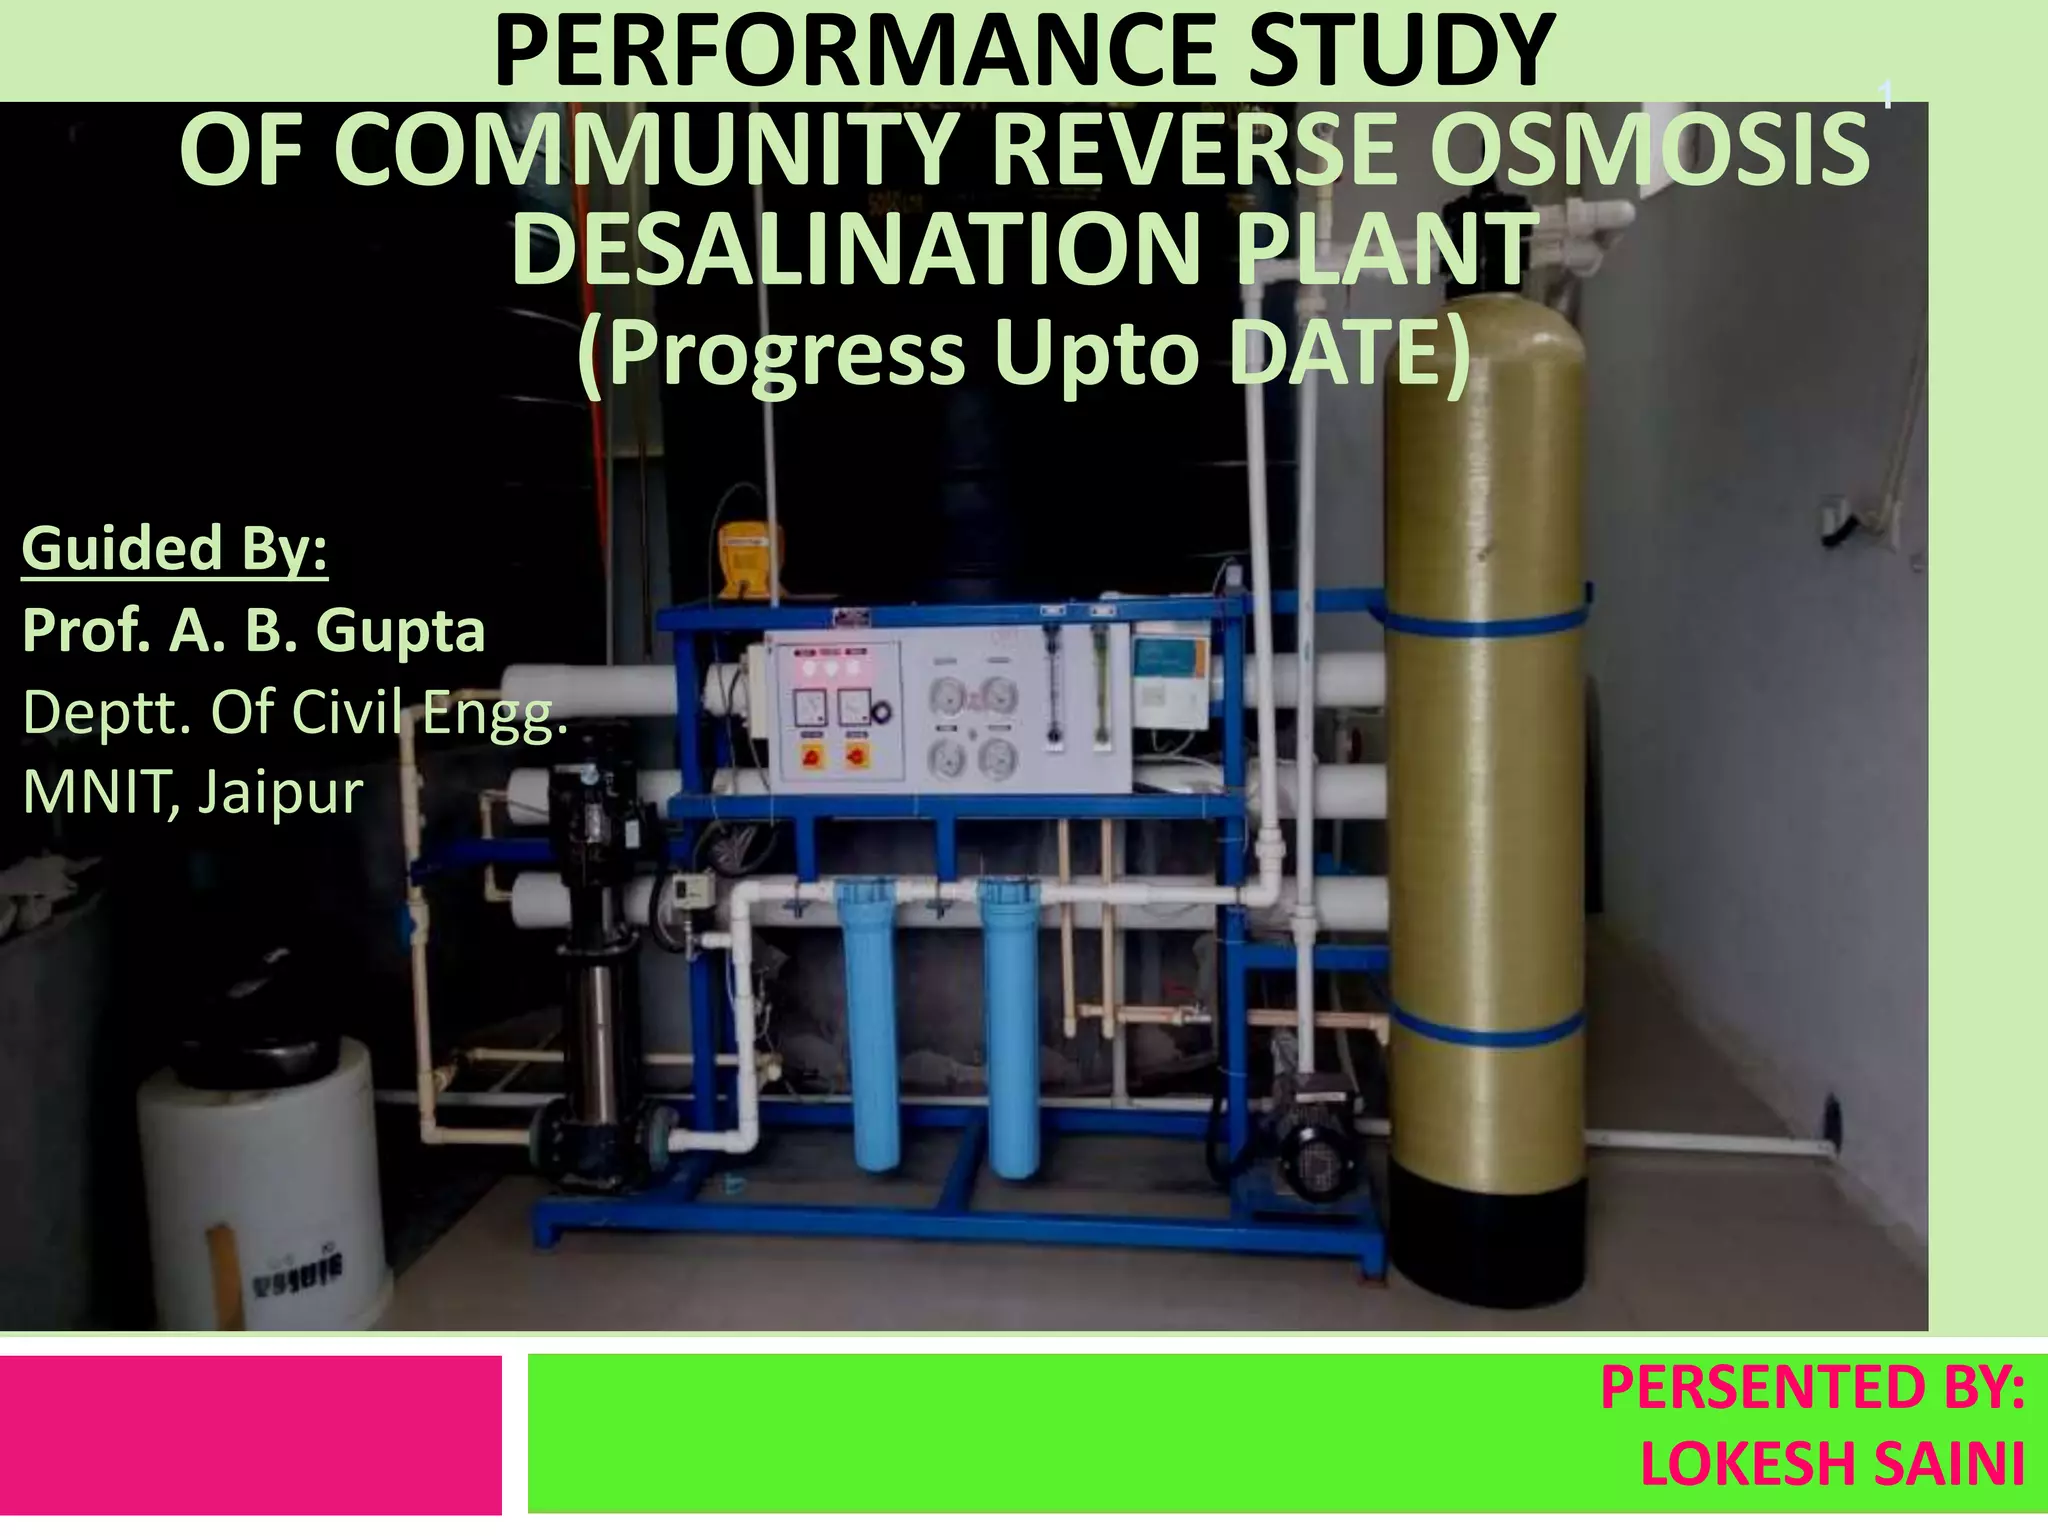
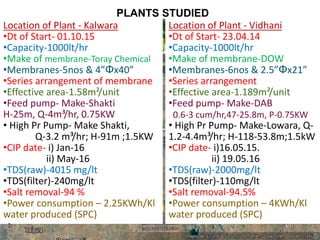
This document summarizes the performance of two community reverse osmosis desalination plants in Vidhani and Kalwara. The plants have capacities of 1000 liters/hour and use membrane technologies from DOW and Toray Chemical. Key findings include:
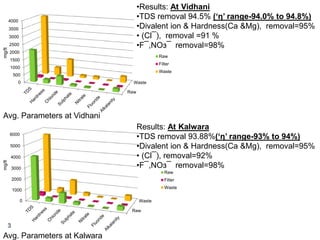
- The plants achieve average salt (TDS) removals of 94.5% and 93.88% respectively.
- Major ions like calcium, magnesium, chloride and fluoride are removed at over 90%.
- Power consumption averages 4 kWh/kl and 2.25 kWh/kl produced respectively.
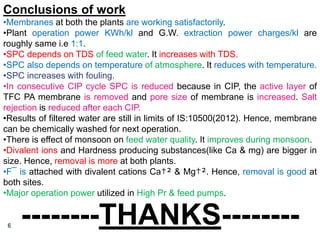
- Membrane performance and water quality remain within standards after multiple cleanings.