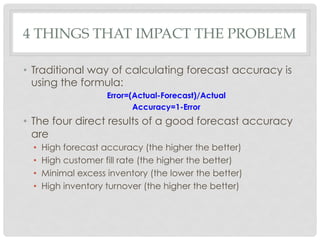
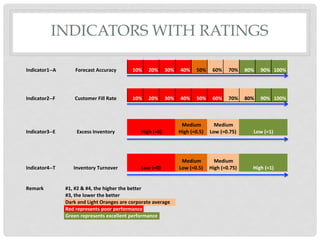
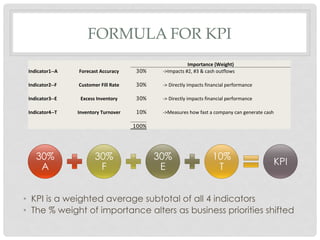
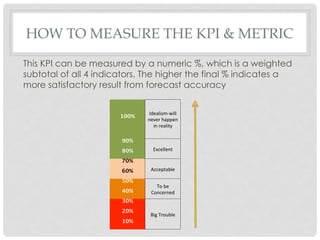
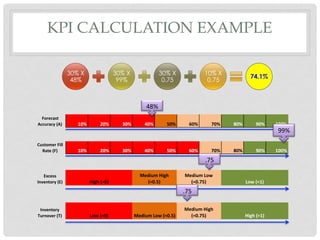
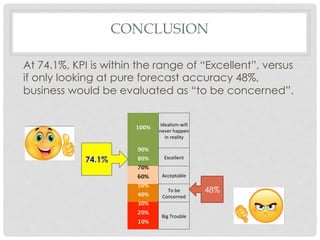
B Y Q I M I A O H U
DESIGNING KPI FOR
FORECAST ACCURACY
PROBLEM
•  Sometimes upper management will decide to solely use
planners’ forecast accuracy at lagN (forecast as of N months
ago; N usually depends on production lead time) as indicator
to evaluate a planner’s performance.
•  However, there are many other factors impacting accuracy.
For example, warehouse capacity, customer credit hold, shift
of retailers’ open to buy $ from future or past months, out of
stock, or even catastrophic events (i.e. Hurricane Harvey in
2017)…etc.
•  Often time, single lag of accuracy does not provide all the
business insights, thus is only fragmented in terms of diagnosing
a business’ overall well being.
4 THINGS THAT IMPACT THE PROBLEM
•  Traditional way of calculating forecast accuracy is
using the formula:
Error=(Actual-Forecast)/Actual
Accuracy=1-Error
•  The four direct results of a good forecast accuracy
are
•  High forecast accuracy (the higher the better)
•  High customer fill rate (the higher the better)
•  Minimal excess inventory (the lower the better)
•  High inventory turnover (the higher the better)
INDICATORS WITH RATINGS
Indicator1--A Forecast	Accuracy 10% 20% 30% 40% 50% 60% 70% 80% 90% 100%
Indicator2--F Customer	Fill	Rate 10% 20% 30% 40% 50% 60% 70% 80% 90% 100%
Indicator3--E Excess	Inventory
Indicator4--T Inventory	Turnover
Remark #1,	#2	&	#4,	the	higher	the	better
#3,	the	lower	the	better
Dark	and	Light	Oranges	are	corporate	average
Red	represents	poor	performance
Green	represents	excellent	performance
High	(=0)
Medium	
High	(=0.5)
Medium	
Low	(=0.75)
Medium	
Low	(=0.5)
Medium	
High	(=0.75)Low	(=0)
Low	(=1)
High	(=1)
FORMULA FOR KPI
Importance	(Weight)	
Indicator1--A	 Forecast	Accuracy	 30% ->Impacts	#2,	#3	&	cash	outflows	
Indicator2--F	 Customer	Fill	Rate	 30% ->	Directly	impacts	financial	performance	
Indicator3--E	 Excess	Inventory	 30% ->	Directly	impacts	financial	performance	
Indicator4--T	 Inventory	Turnover	 10% ->Measures	how	fast	a	company	can	generate	cash	
100%
30%
A
30%
F
30%
E
10%
T
KPI
•  KPI is a weighted average subtotal of all 4 indicators
•  The % weight of importance alters as business priorities shifted
HOW TO MEASURE THE KPI & METRIC
This KPI can be measured by a numeric %, which is a weighted
subtotal of all 4 indicators. The higher the final % indicates a
more satisfactory result from forecast accuracy
100%
Idealism-will	
never	happen	
in	reality	
90%
Excellent	80%
70%
Acceptable	60%
50%
To	be	
Concerned	40%
30%
Big	Trouble	
20%
10%
KPI CALCULATION EXAMPLE
30% X
48%
30% X
99%
30% X
0.75
10% X
0.75
74.1%
Forecast	
Accuracy	(A) 10% 20% 30% 40% 50% 60% 70% 80% 90% 100%
Customer	Fill	
Rate	(F) 10% 20% 30% 40% 50% 60% 70% 80% 90% 100%
Excess	
Inventory	(E)
Inventory	
Turnover	(T)
High	(=0)
Medium	High	
(=0.5)
Medium	Low	
(=0.75) Low	(=1)
Low	(=0) Medium	Low	(=0.5)
Medium	High	
(=0.75) High	(=1)
48%
	
99%	
	
.75	
	
.75
CONCLUSION
At 74.1%, KPI is within the range of “Excellent”, versus
if only looking at pure forecast accuracy 48%,
business would be evaluated as “to be concerned”.
100%
Idealism-will	
never	happen	
in	reality	
90%
Excellent	80%
70%
Acceptable	60%
50%
To	be	
Concerned	40%
30%
Big	Trouble	
20%
10%
74.1%
48%

Project KPI

  • 1.
    B Y QI M I A O H U DESIGNING KPI FOR FORECAST ACCURACY
  • 2.
    PROBLEM •  Sometimes uppermanagement will decide to solely use planners’ forecast accuracy at lagN (forecast as of N months ago; N usually depends on production lead time) as indicator to evaluate a planner’s performance. •  However, there are many other factors impacting accuracy. For example, warehouse capacity, customer credit hold, shift of retailers’ open to buy $ from future or past months, out of stock, or even catastrophic events (i.e. Hurricane Harvey in 2017)…etc. •  Often time, single lag of accuracy does not provide all the business insights, thus is only fragmented in terms of diagnosing a business’ overall well being.
  • 3.
    4 THINGS THATIMPACT THE PROBLEM •  Traditional way of calculating forecast accuracy is using the formula: Error=(Actual-Forecast)/Actual Accuracy=1-Error •  The four direct results of a good forecast accuracy are •  High forecast accuracy (the higher the better) •  High customer fill rate (the higher the better) •  Minimal excess inventory (the lower the better) •  High inventory turnover (the higher the better)
  • 4.
    INDICATORS WITH RATINGS Indicator1--AForecast Accuracy 10% 20% 30% 40% 50% 60% 70% 80% 90% 100% Indicator2--F Customer Fill Rate 10% 20% 30% 40% 50% 60% 70% 80% 90% 100% Indicator3--E Excess Inventory Indicator4--T Inventory Turnover Remark #1, #2 & #4, the higher the better #3, the lower the better Dark and Light Oranges are corporate average Red represents poor performance Green represents excellent performance High (=0) Medium High (=0.5) Medium Low (=0.75) Medium Low (=0.5) Medium High (=0.75)Low (=0) Low (=1) High (=1)
  • 5.
    FORMULA FOR KPI Importance (Weight) Indicator1--A Forecast Accuracy 30% ->Impacts #2, #3 & cash outflows Indicator2--F Customer Fill Rate 30% -> Directly impacts financial performance Indicator3--E Excess Inventory 30% -> Directly impacts financial performance Indicator4--T Inventory Turnover 10% ->Measures how fast a company can generate cash 100% 30% A 30% F 30% E 10% T KPI •  KPI is a weighted average subtotal of all 4 indicators •  The % weight of importance alters as business priorities shifted
  • 6.
    HOW TO MEASURETHE KPI & METRIC This KPI can be measured by a numeric %, which is a weighted subtotal of all 4 indicators. The higher the final % indicates a more satisfactory result from forecast accuracy 100% Idealism-will never happen in reality 90% Excellent 80% 70% Acceptable 60% 50% To be Concerned 40% 30% Big Trouble 20% 10%
  • 7.
    KPI CALCULATION EXAMPLE 30%X 48% 30% X 99% 30% X 0.75 10% X 0.75 74.1% Forecast Accuracy (A) 10% 20% 30% 40% 50% 60% 70% 80% 90% 100% Customer Fill Rate (F) 10% 20% 30% 40% 50% 60% 70% 80% 90% 100% Excess Inventory (E) Inventory Turnover (T) High (=0) Medium High (=0.5) Medium Low (=0.75) Low (=1) Low (=0) Medium Low (=0.5) Medium High (=0.75) High (=1) 48% 99% .75 .75
  • 8.
    CONCLUSION At 74.1%, KPIis within the range of “Excellent”, versus if only looking at pure forecast accuracy 48%, business would be evaluated as “to be concerned”. 100% Idealism-will never happen in reality 90% Excellent 80% 70% Acceptable 60% 50% To be Concerned 40% 30% Big Trouble 20% 10% 74.1% 48%