Downloaded 32 times
![Paul A Blackett
NPAG Clinical Engineering Conference 2011
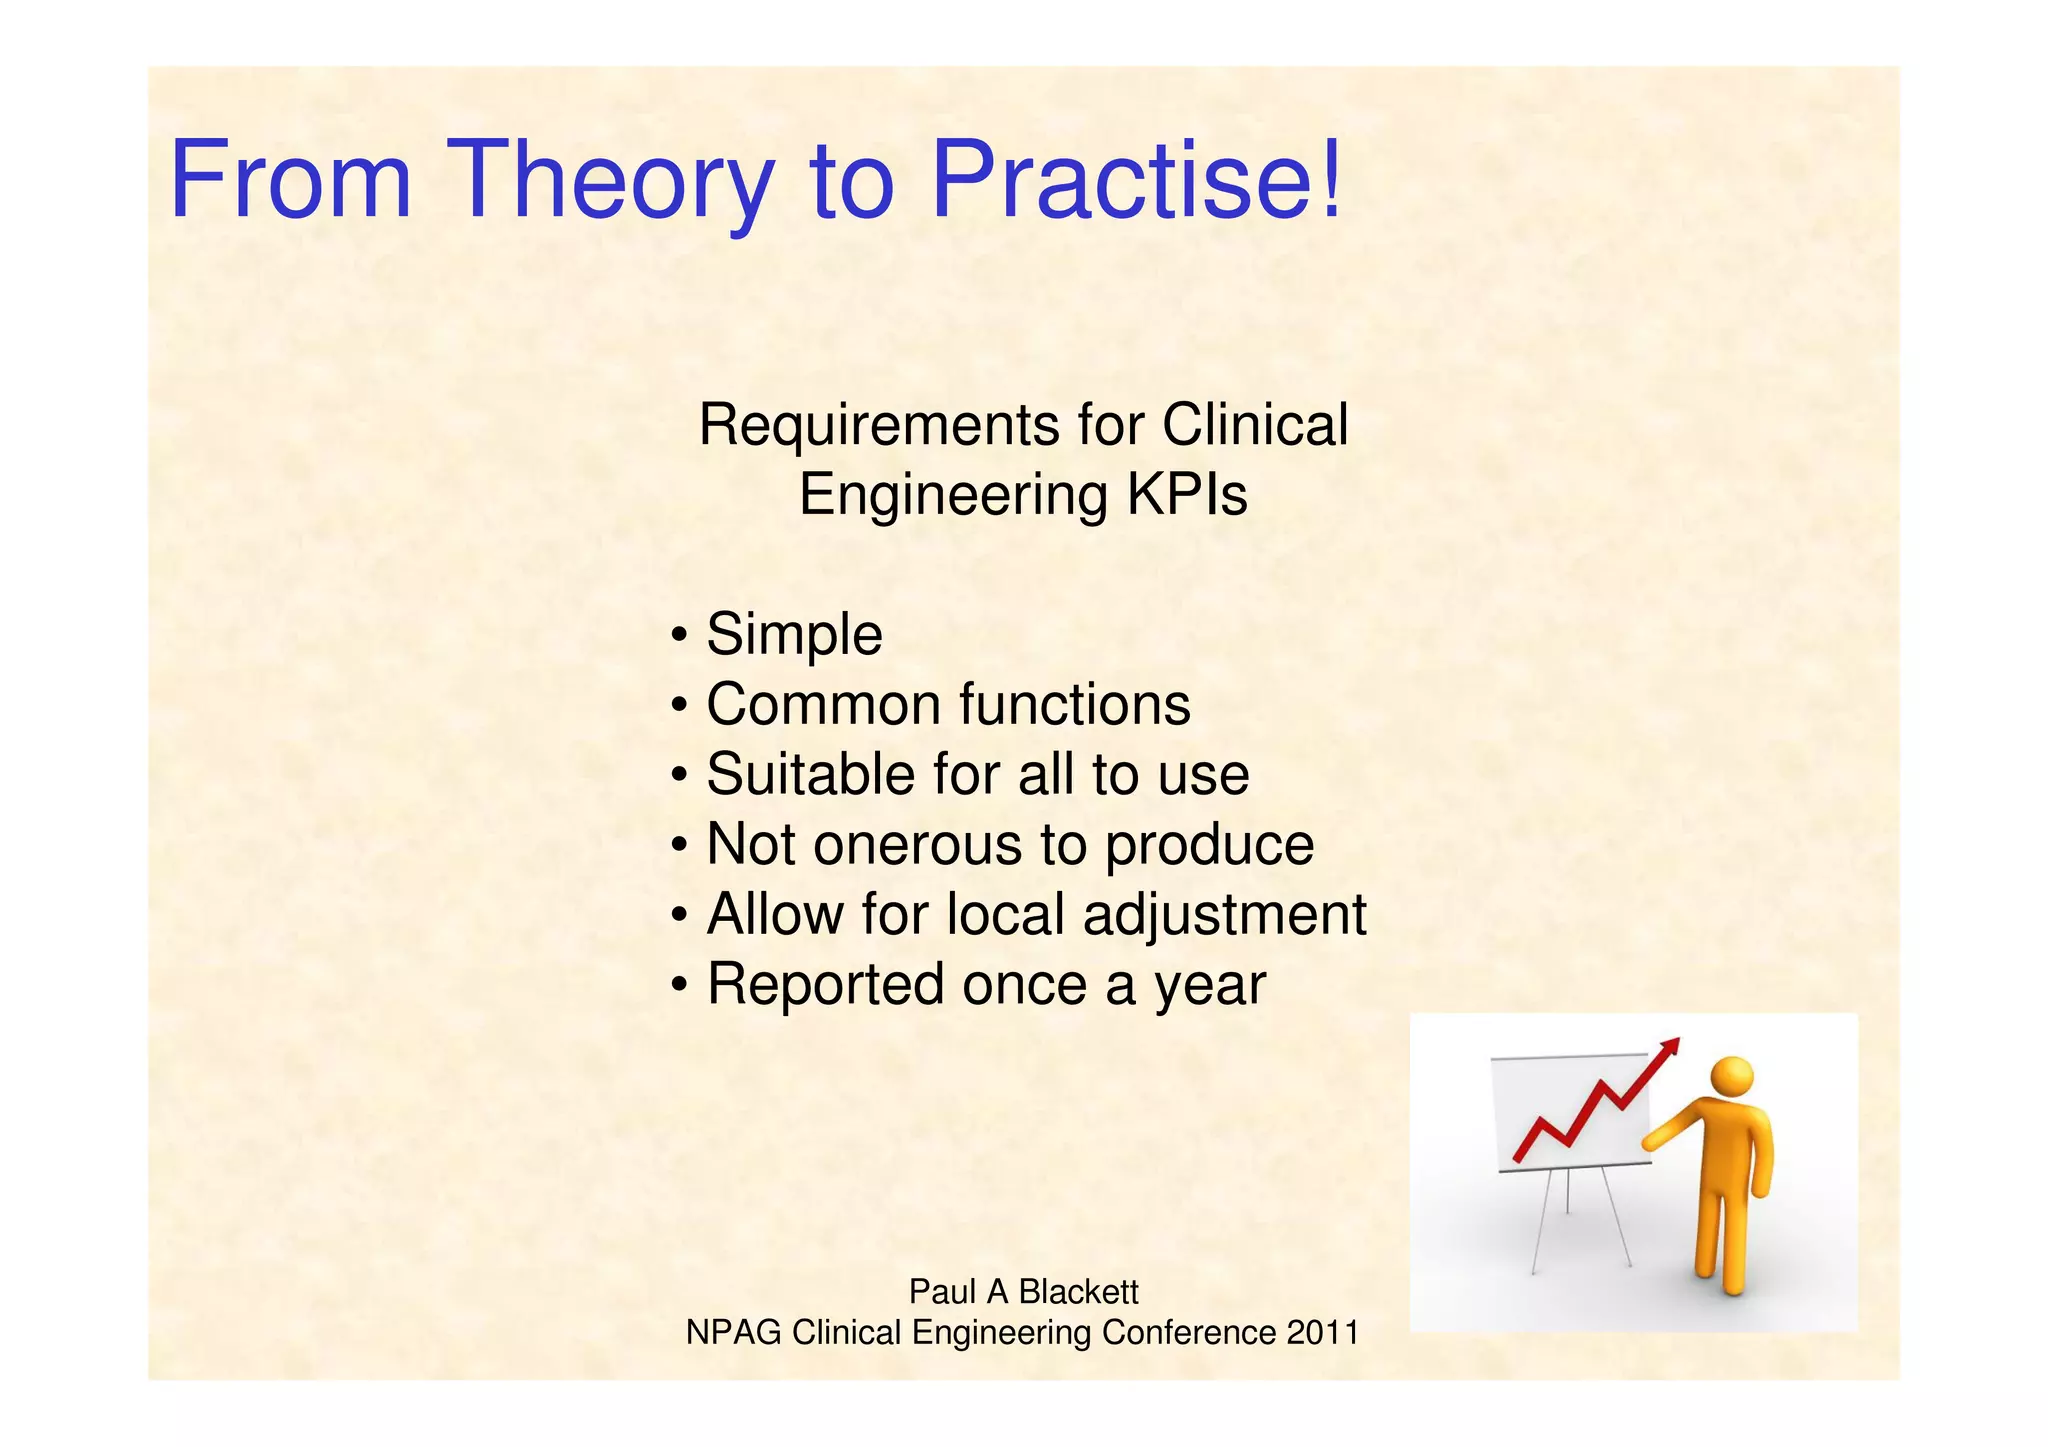
What are Key Performance
Indicators?
A specific measure of some
aspect of an organisation's
performance.
“A quantitative tool (for example rate, ratio, index,
percentage) that provides an indication of an
organisations performance in relation to a specified
process or outcome.” [1]
“
”](https://image.slidesharecdn.com/keyperformanceindicators-130908084200-/75/Key-Performance-Indicators-a-spy-in-the-camp-or-a-useful-tool-3-2048.jpg)


![Paul A Blackett
NPAG Clinical Engineering Conference 2011
A few examples….. [2]](https://image.slidesharecdn.com/keyperformanceindicators-130908084200-/75/Key-Performance-Indicators-a-spy-in-the-camp-or-a-useful-tool-7-2048.jpg)
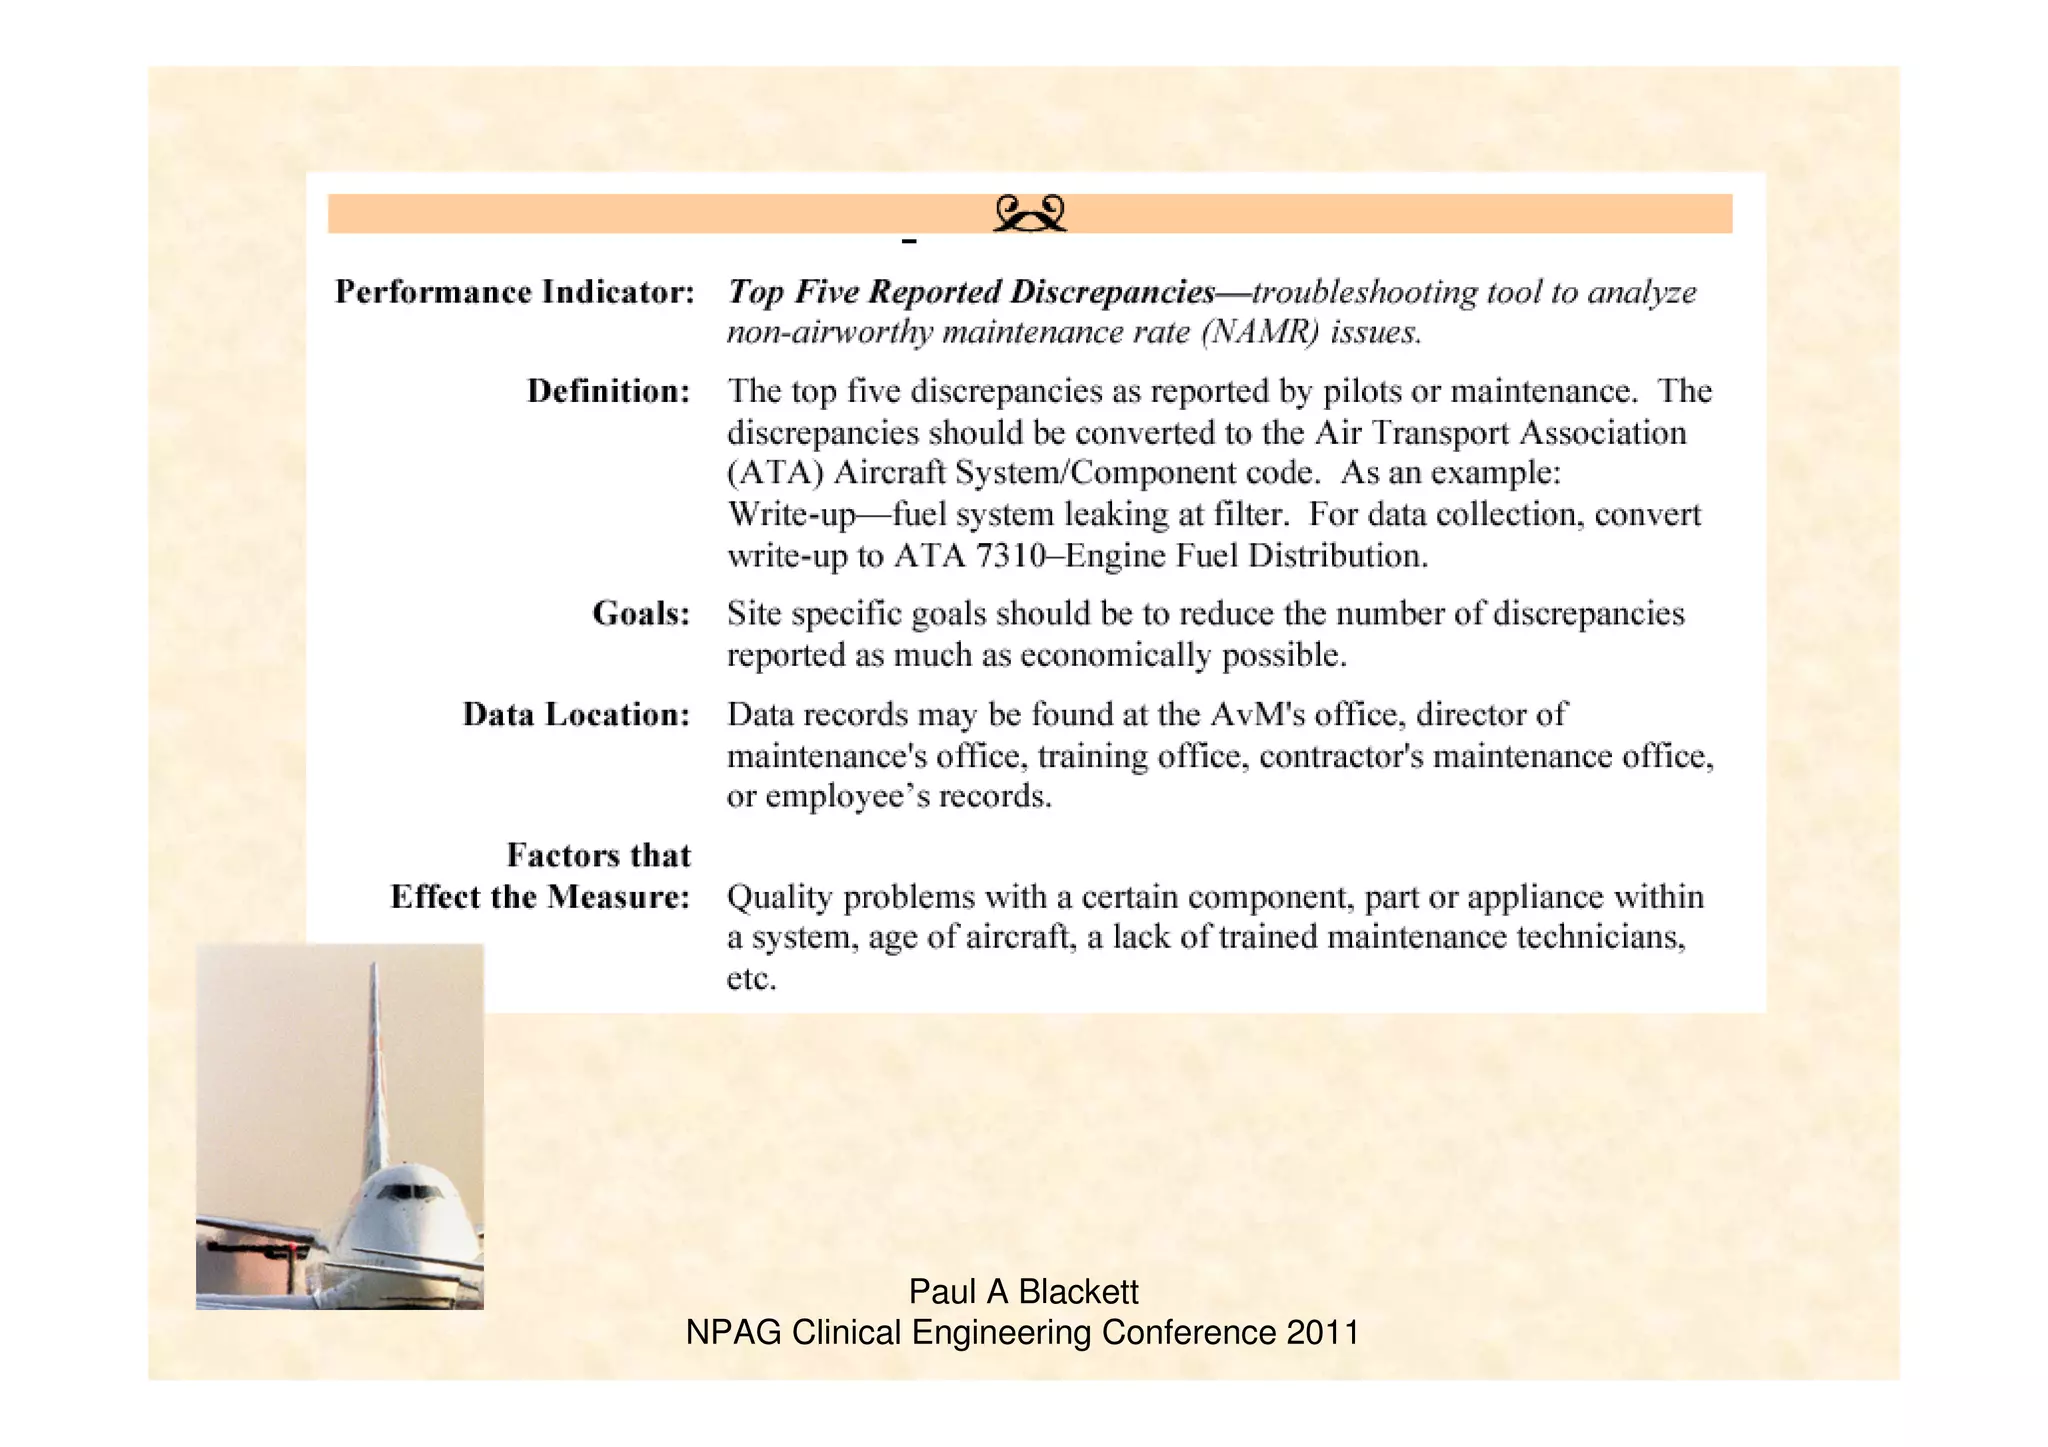

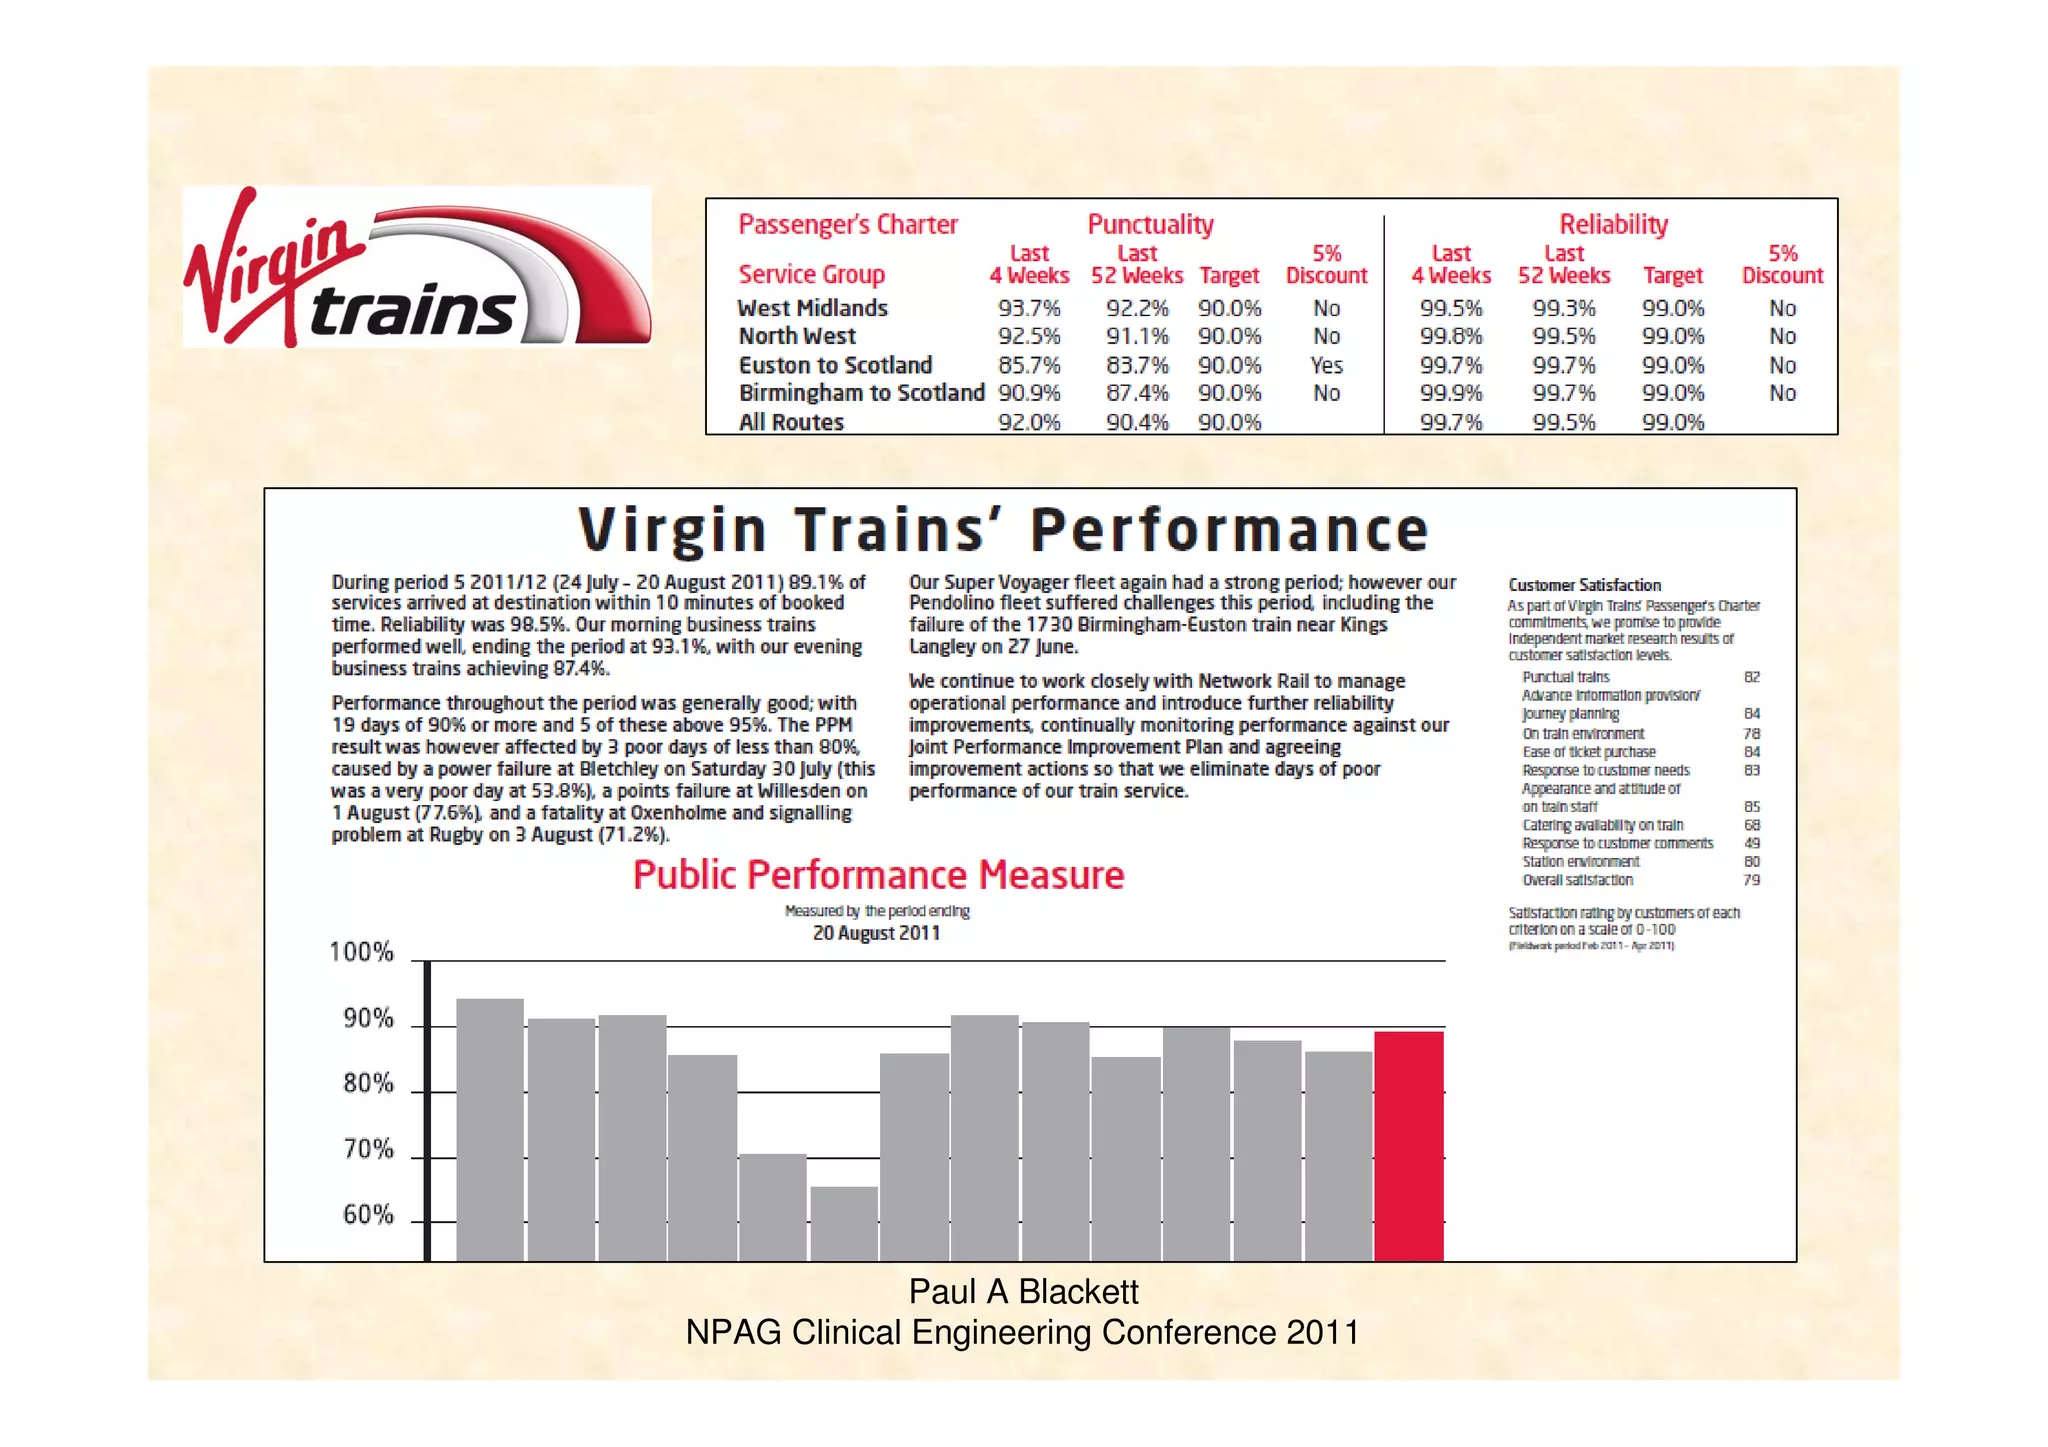
![Paul A Blackett
NPAG Clinical Engineering Conference 2011
Signals Passed at Danger [3]](https://image.slidesharecdn.com/keyperformanceindicators-130908084200-/75/Key-Performance-Indicators-a-spy-in-the-camp-or-a-useful-tool-14-2048.jpg)
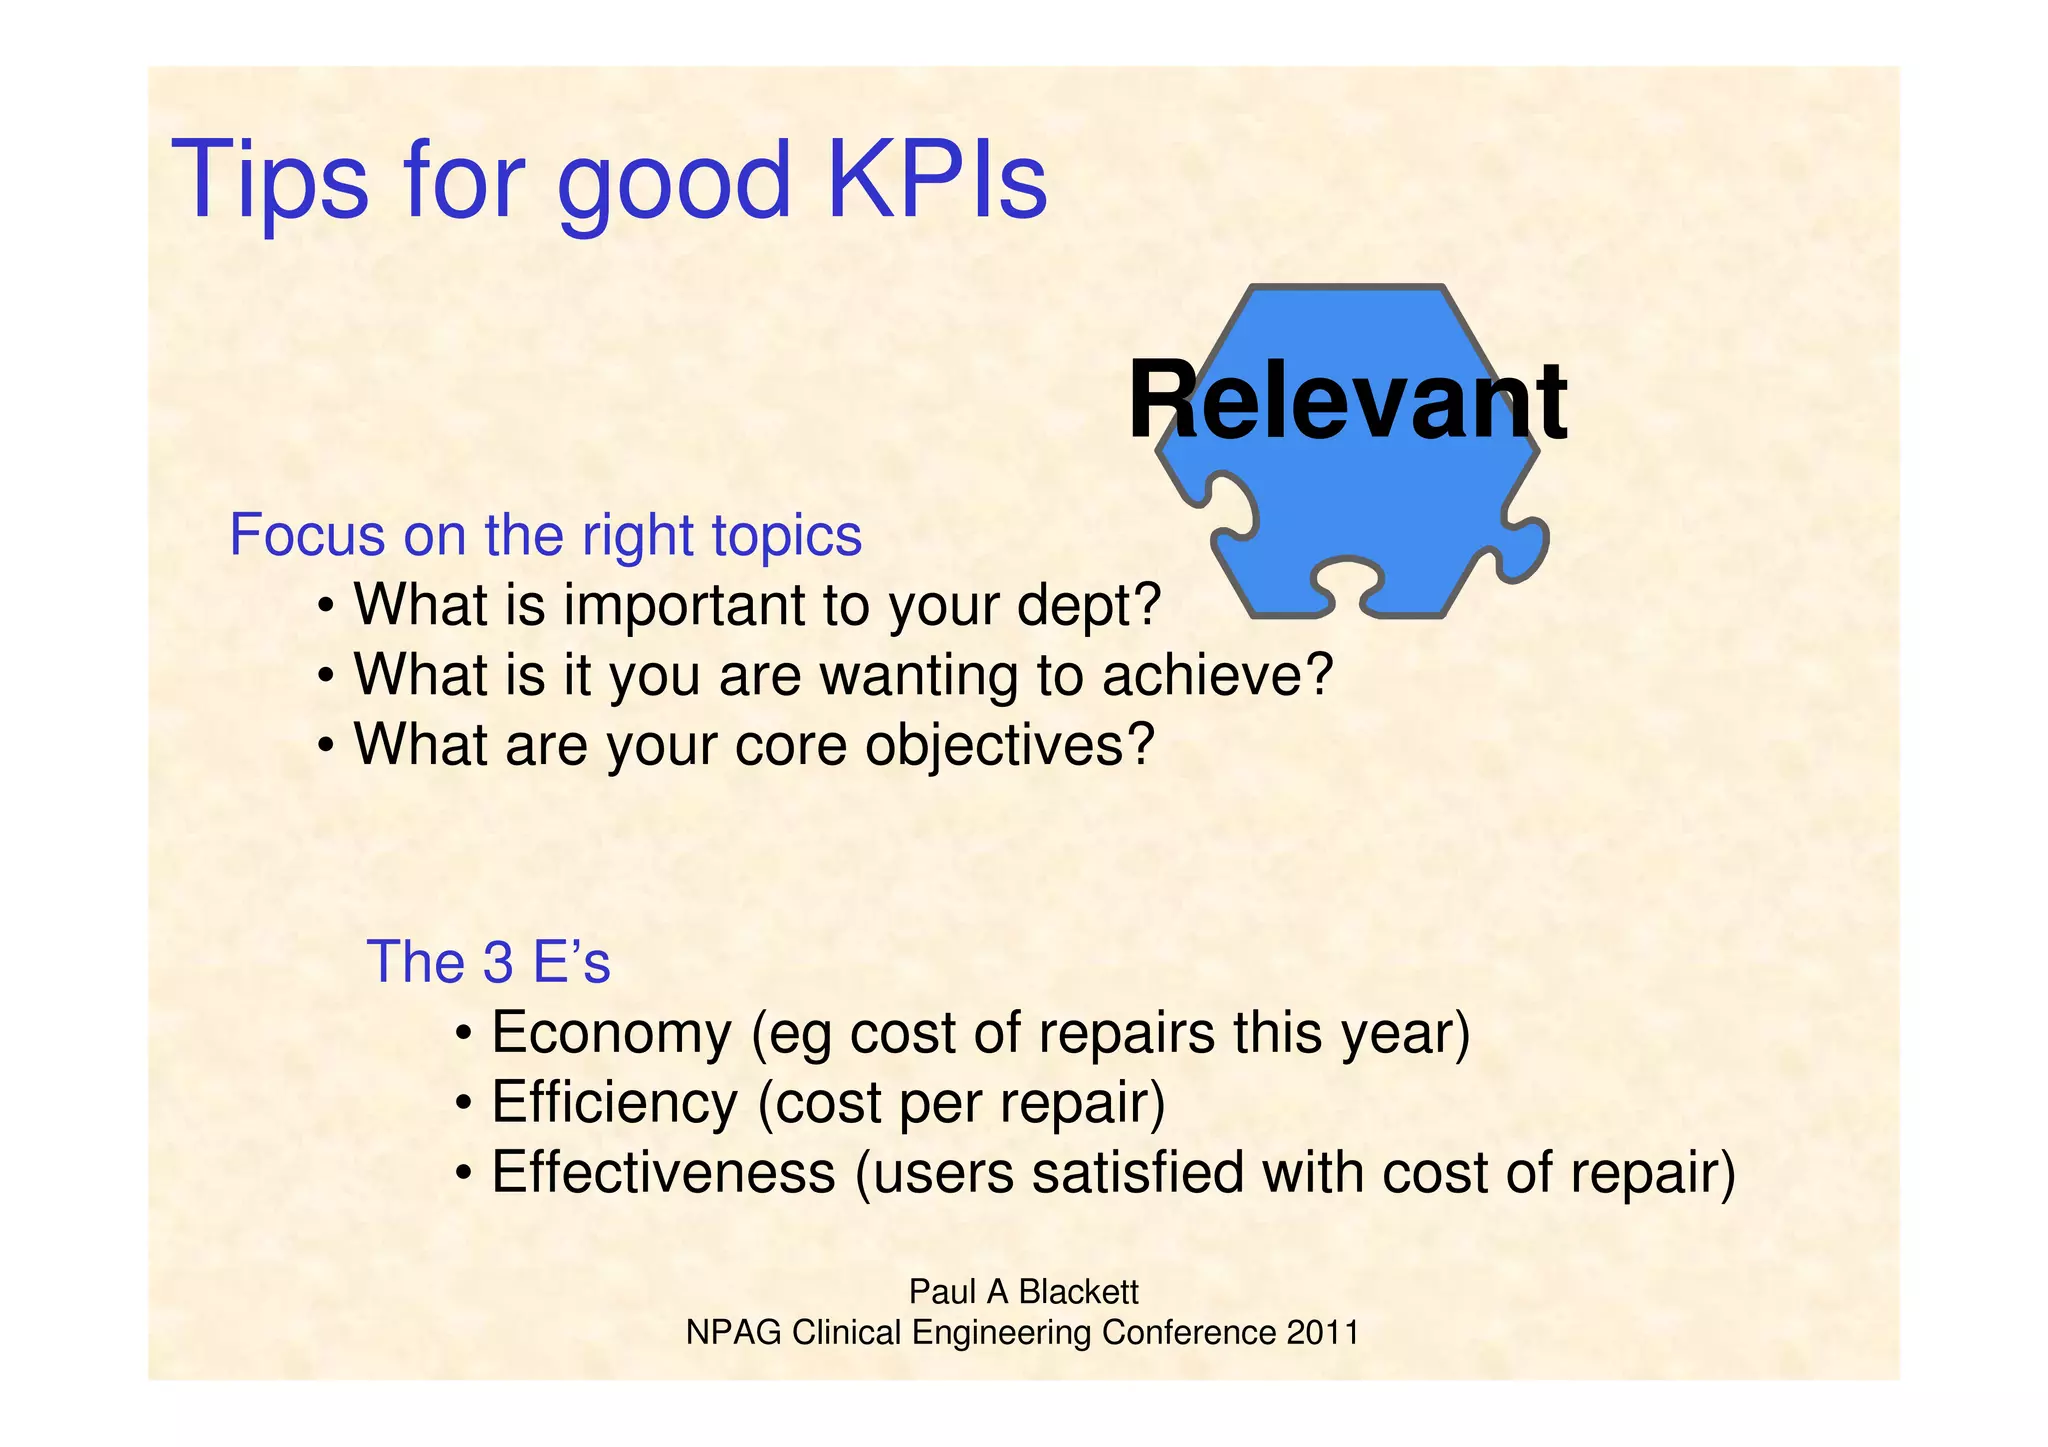
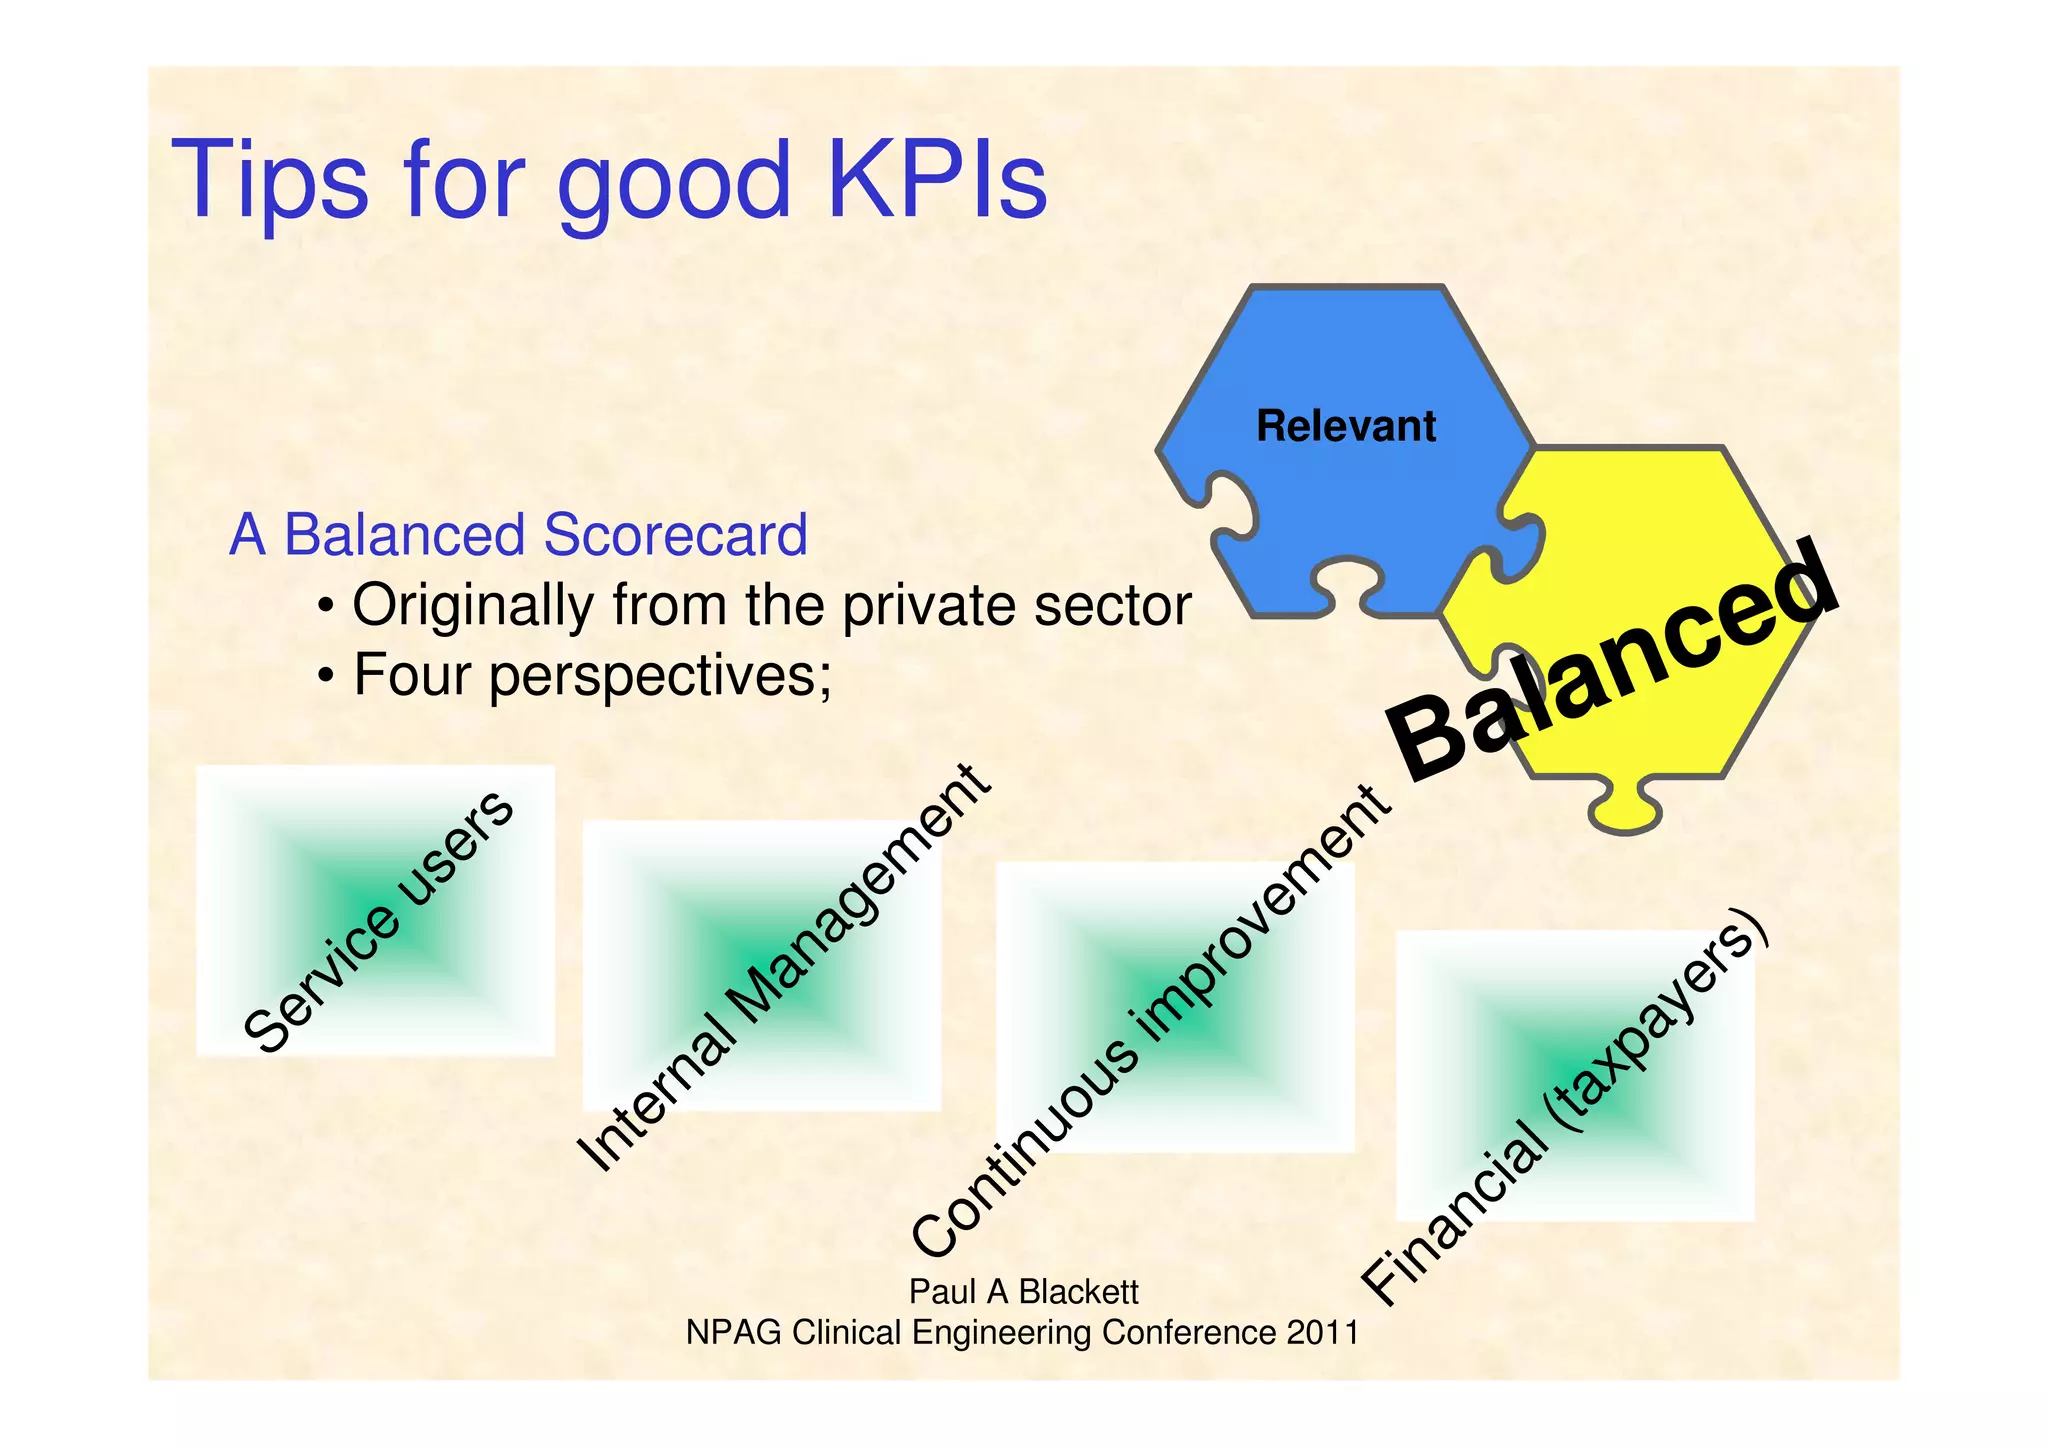
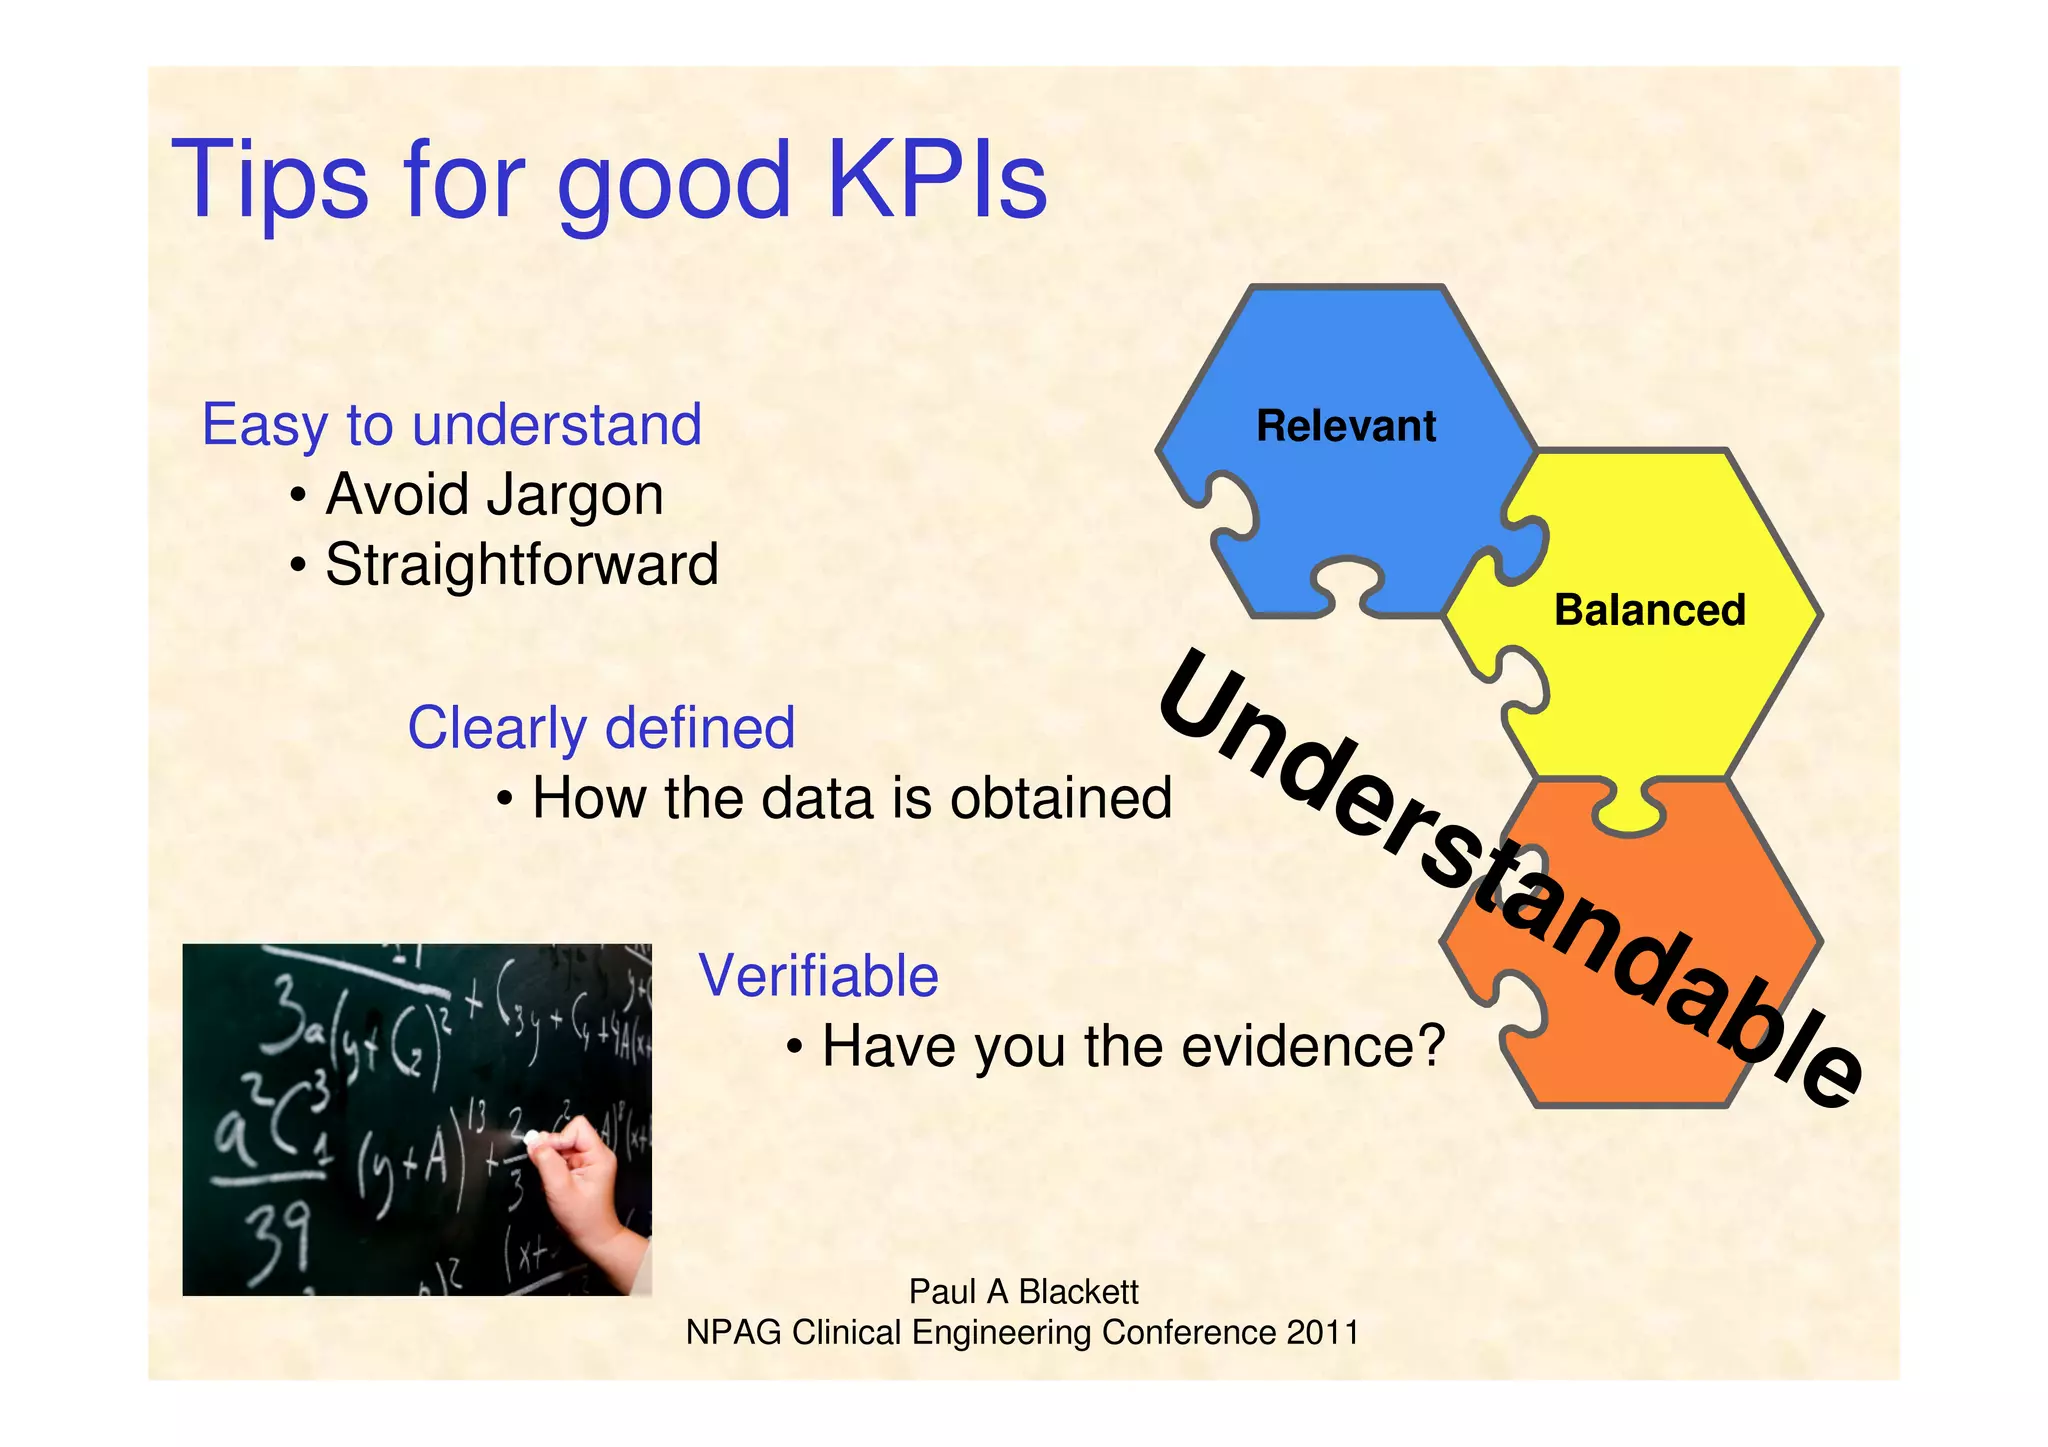
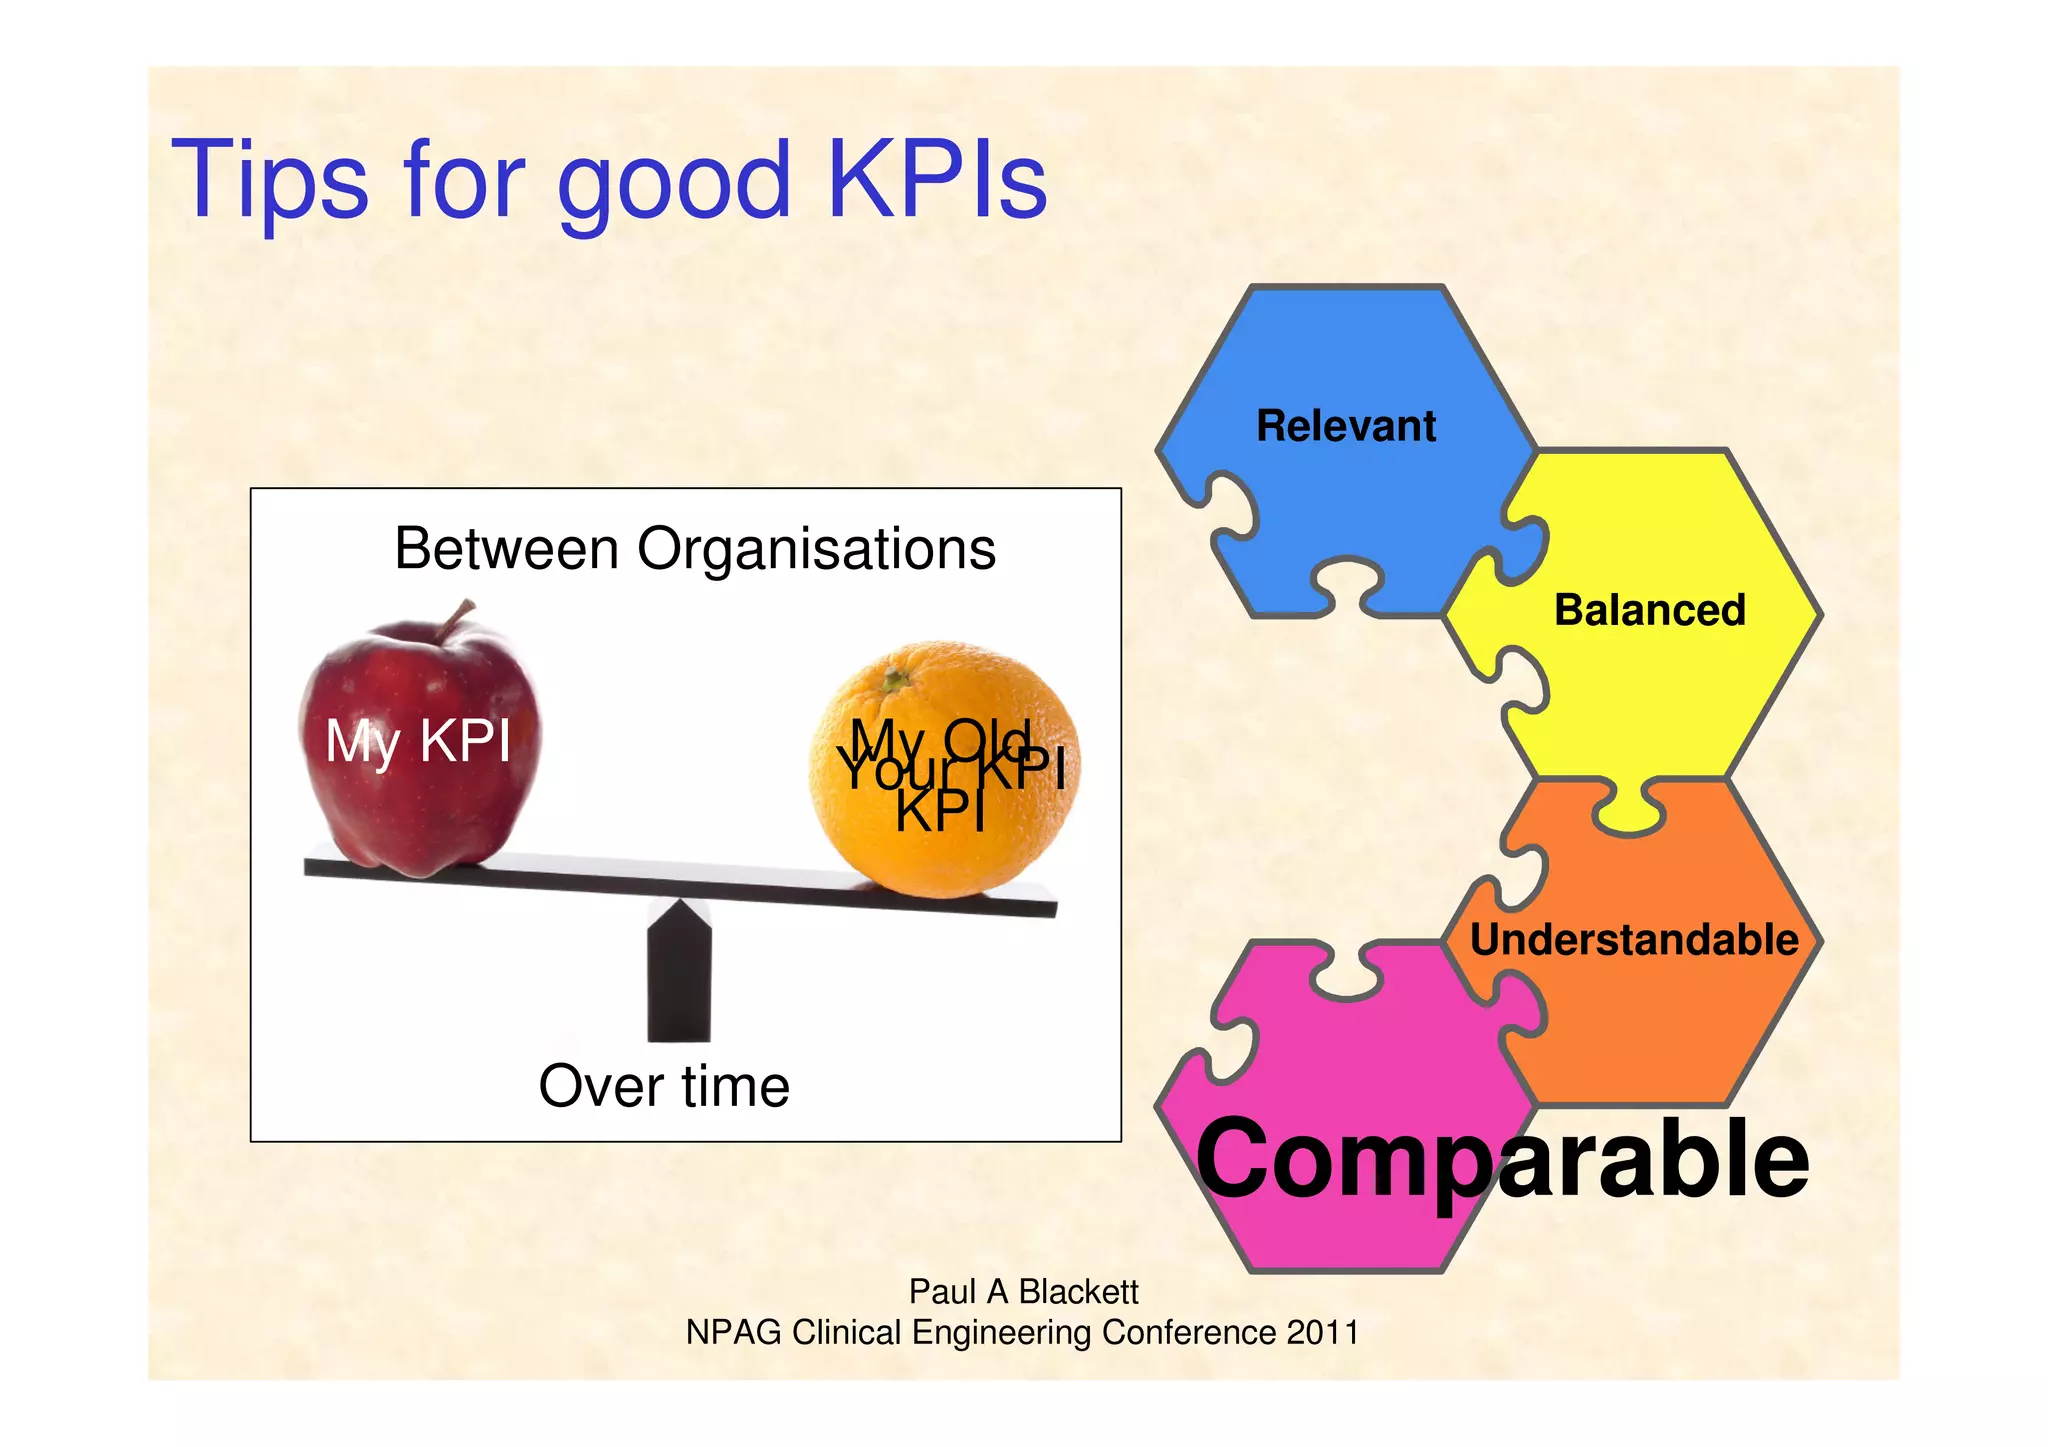
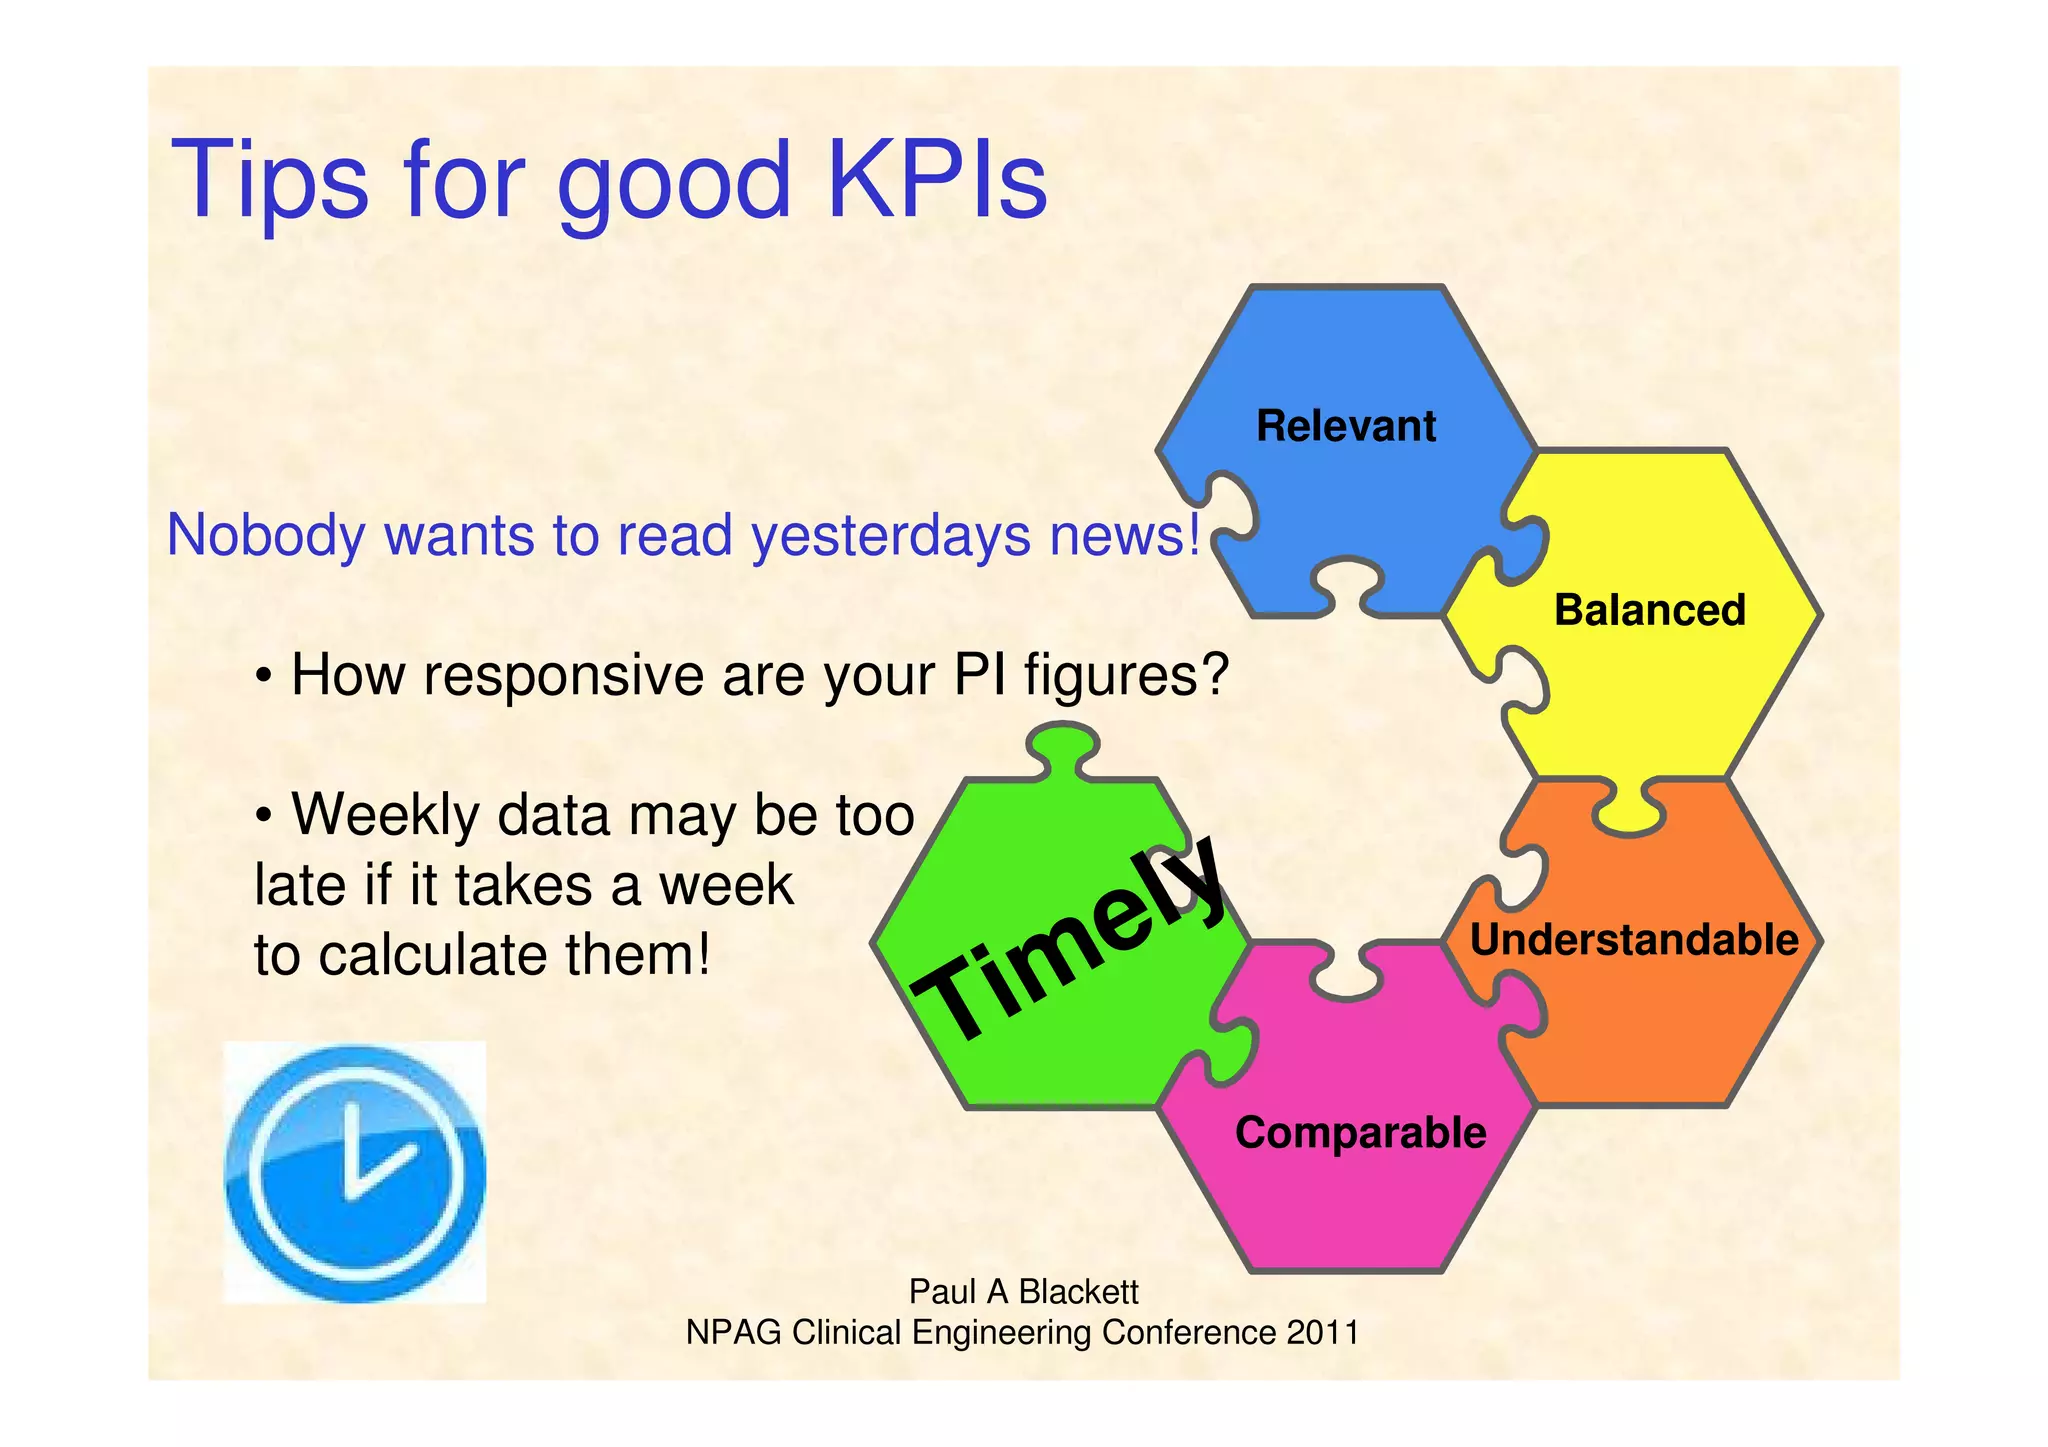
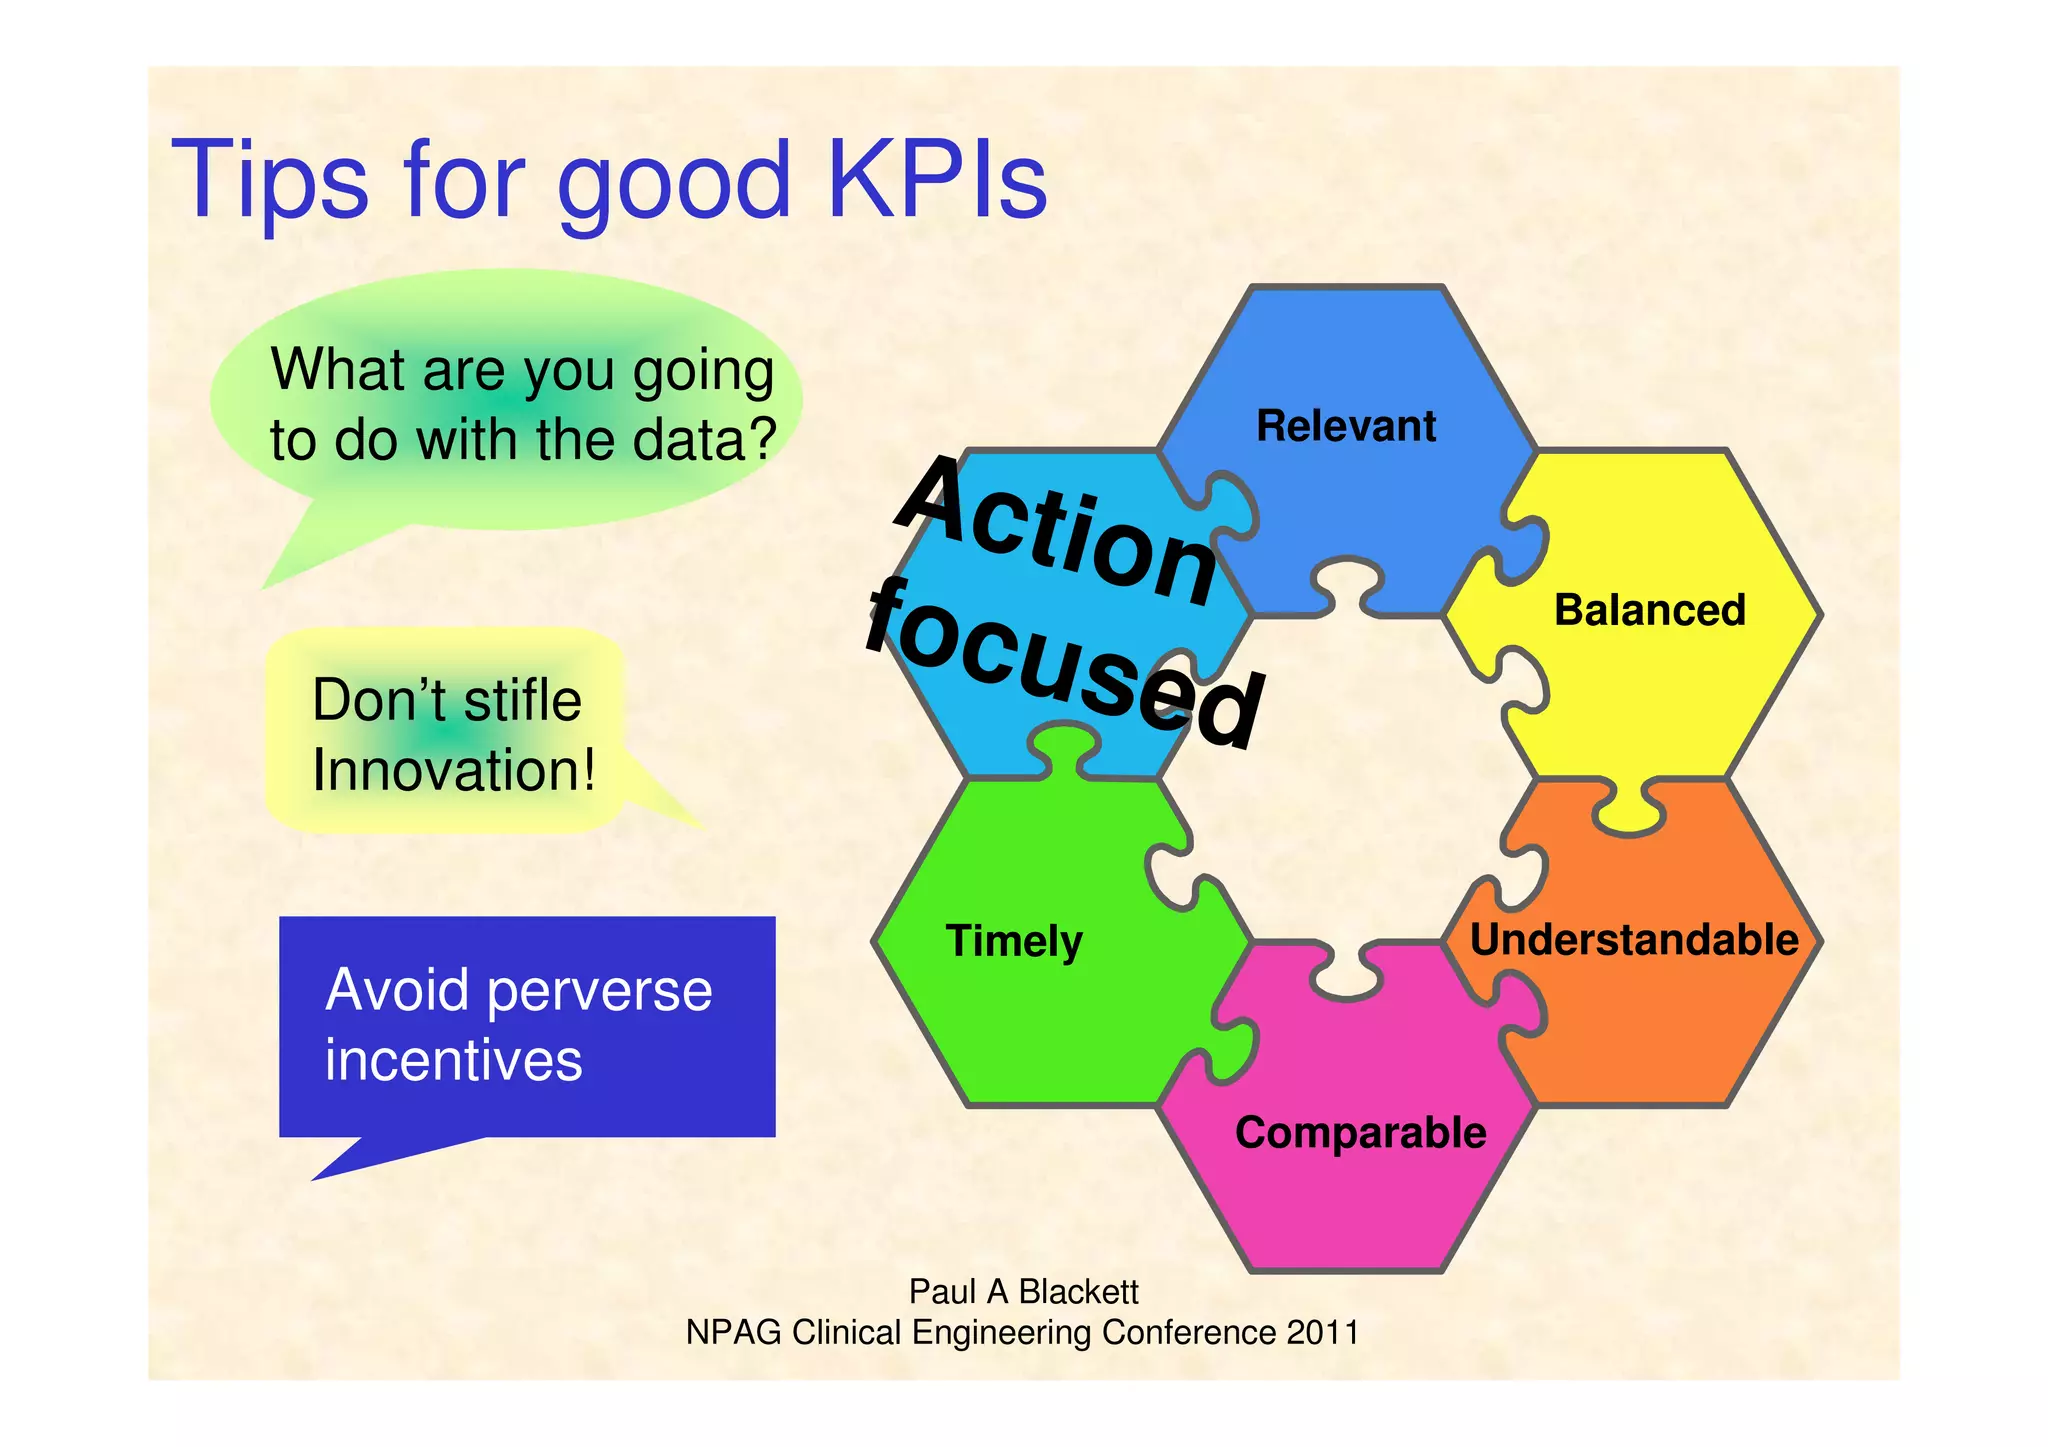
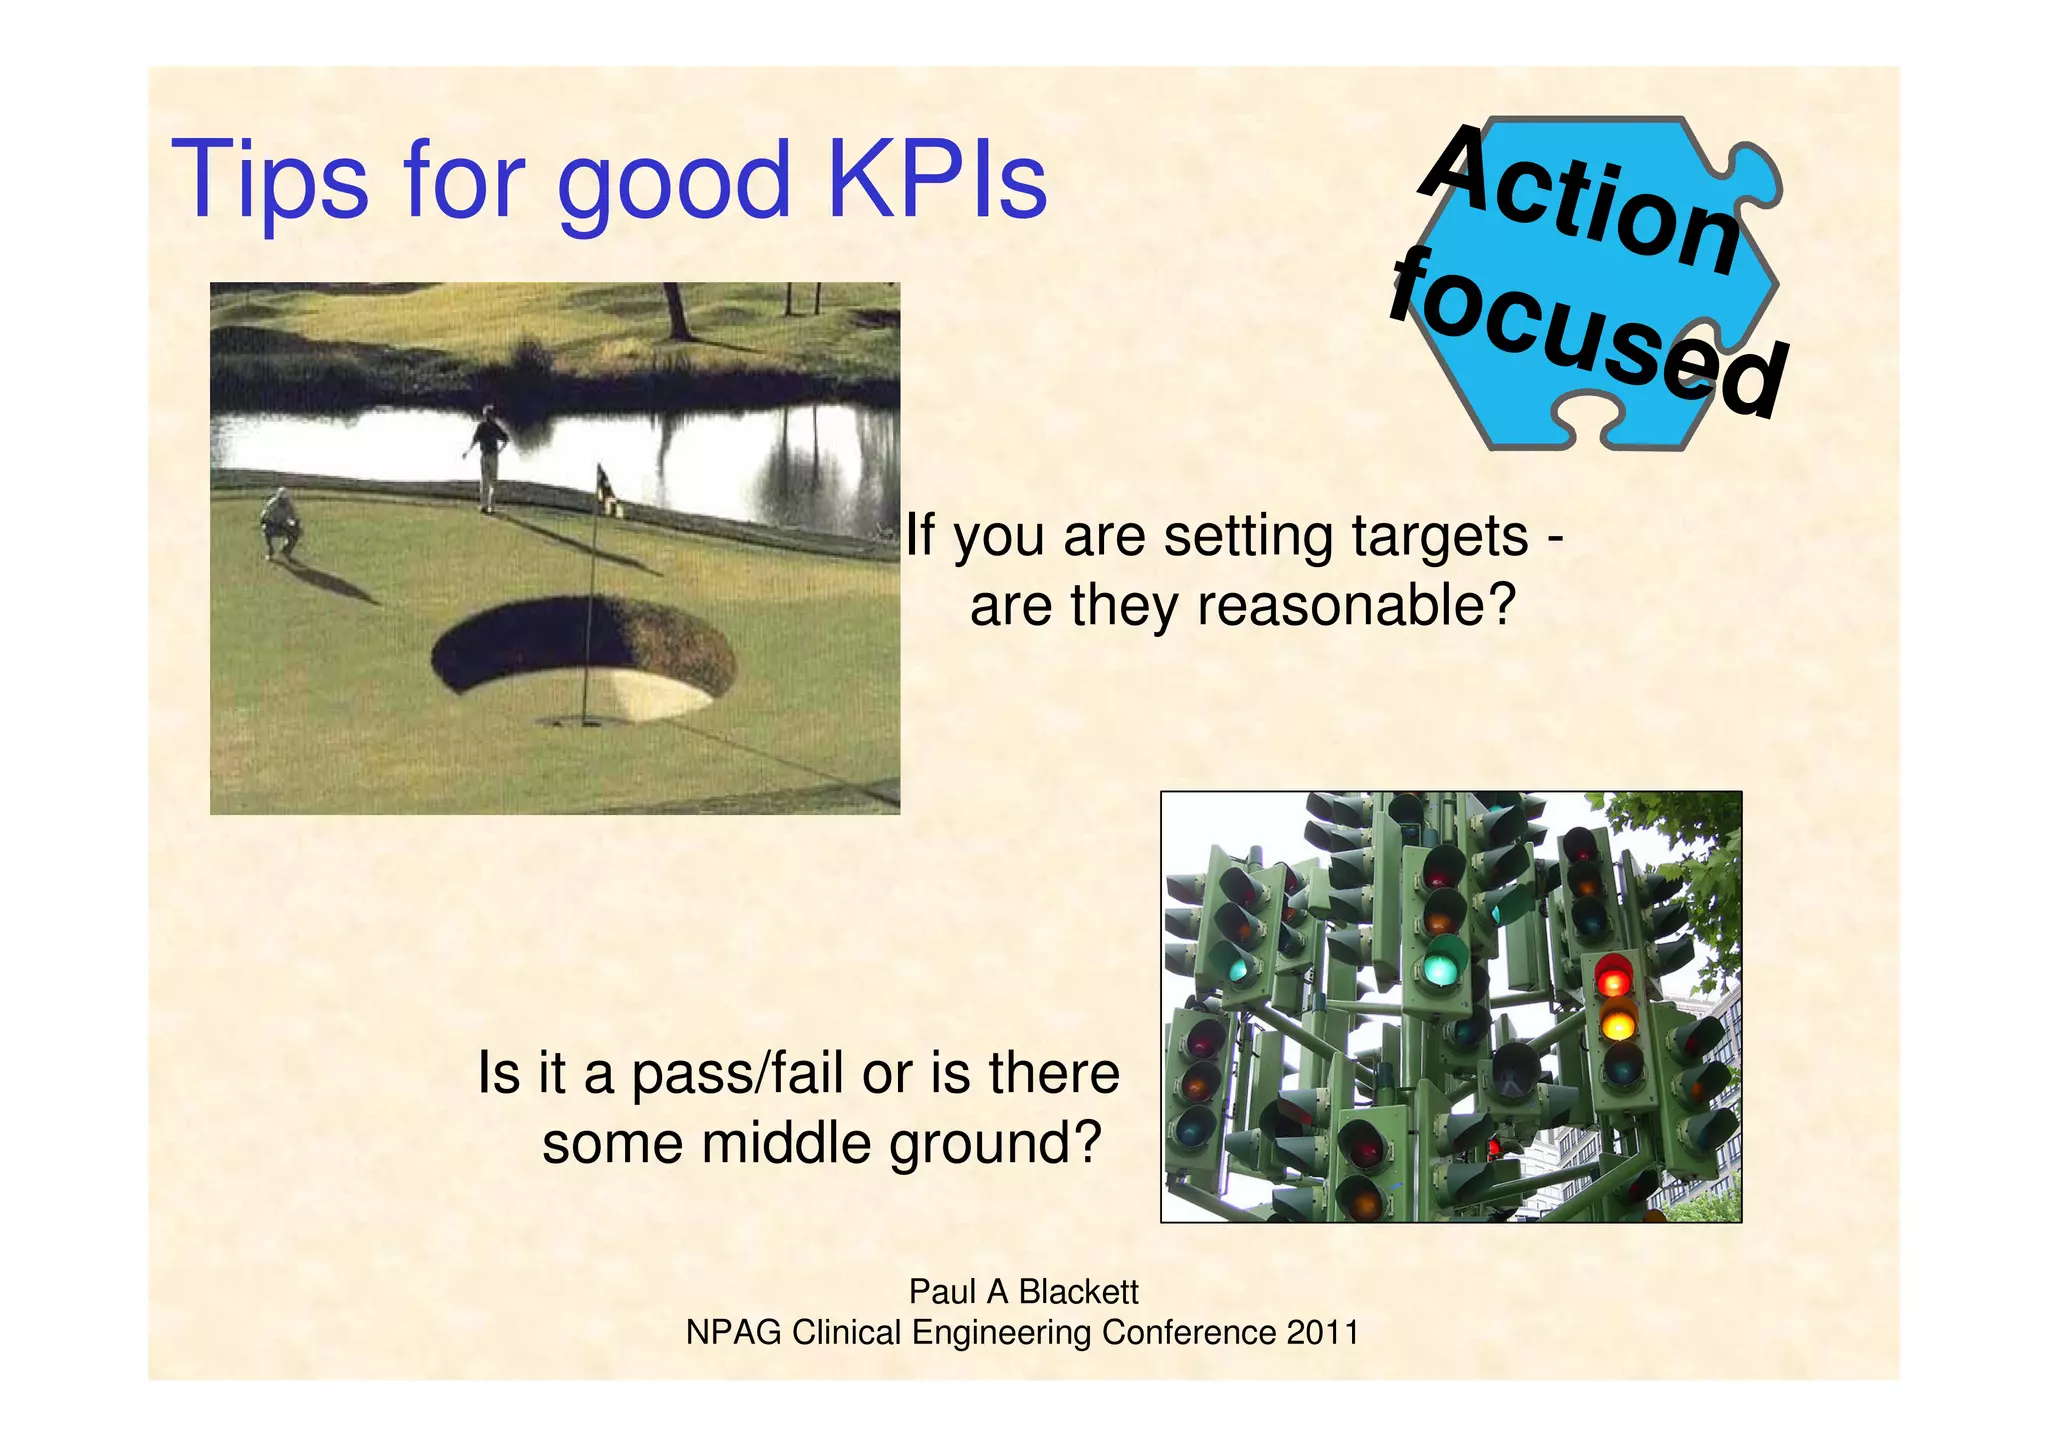
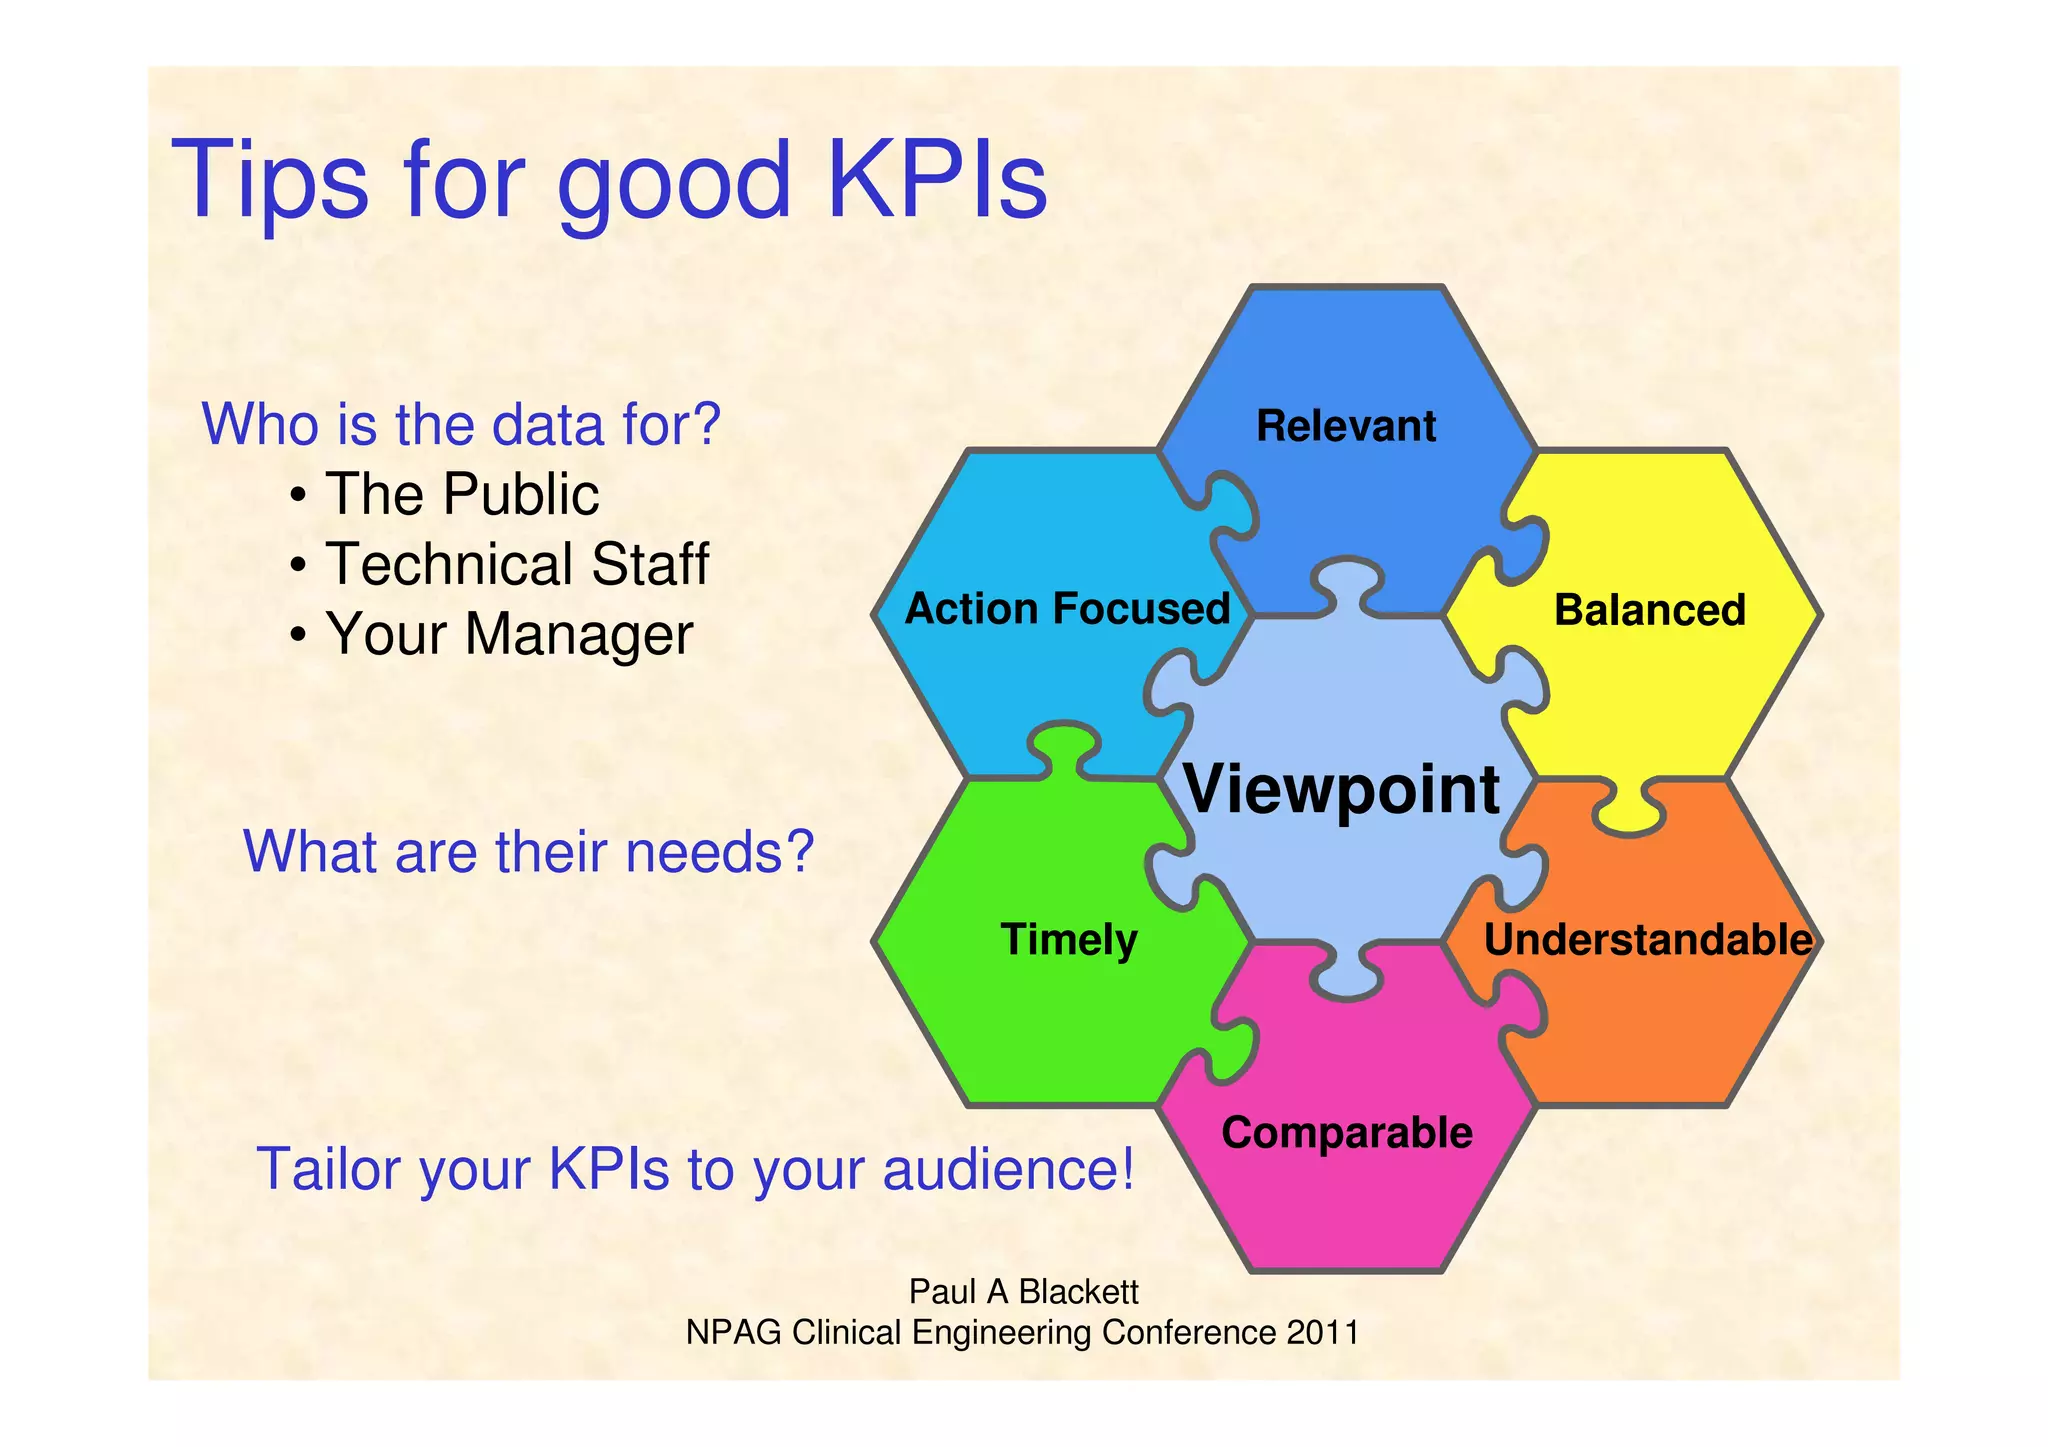
![Paul A Blackett
NPAG Clinical Engineering Conference 2011
Tips for good KPIs
[4]](https://image.slidesharecdn.com/keyperformanceindicators-130908084200-/75/Key-Performance-Indicators-a-spy-in-the-camp-or-a-useful-tool-16-2048.jpg)

![Paul A Blackett
NPAG Clinical Engineering Conference 2011
[1] http://www.jcaho.org/pms/core+measures/appendixd.pdf
[2] https://www.directives.doe.gov/directives/archive-directives/440.2b-
EGuide-1a2/at_download/file
[3] http://www.rail-reg.gov.uk/upload/pdf/370.pdf
[4] http://www.audit-
commission.gov.uk/SiteCollectionDocuments/AuditCommissionReports/
NationalStudies/archive_mptarget.pdf
[5]
http://www.hfmmagazine.com/hfmmagazine_app/jsp/articledisplay.jsp?dc
rpath=HFMMAGAZINE/Article/data/02FEB2010/1002HFM_FEA_Biomedi
cal&domain=HFMMAGAZINE
Product and Quality Performance Indicators for Services in Engineering.
Peter Smithson IPEM Scope. Vol 11#3 Sept 2002
Benchmarking – The new ‘Soldering Iron’ for Effective Equipment
Support. Paul Robbins. IPEM Scope. Vol 11#3 Sept 2002
References…](https://image.slidesharecdn.com/keyperformanceindicators-130908084200-/75/Key-Performance-Indicators-a-spy-in-the-camp-or-a-useful-tool-36-2048.jpg)

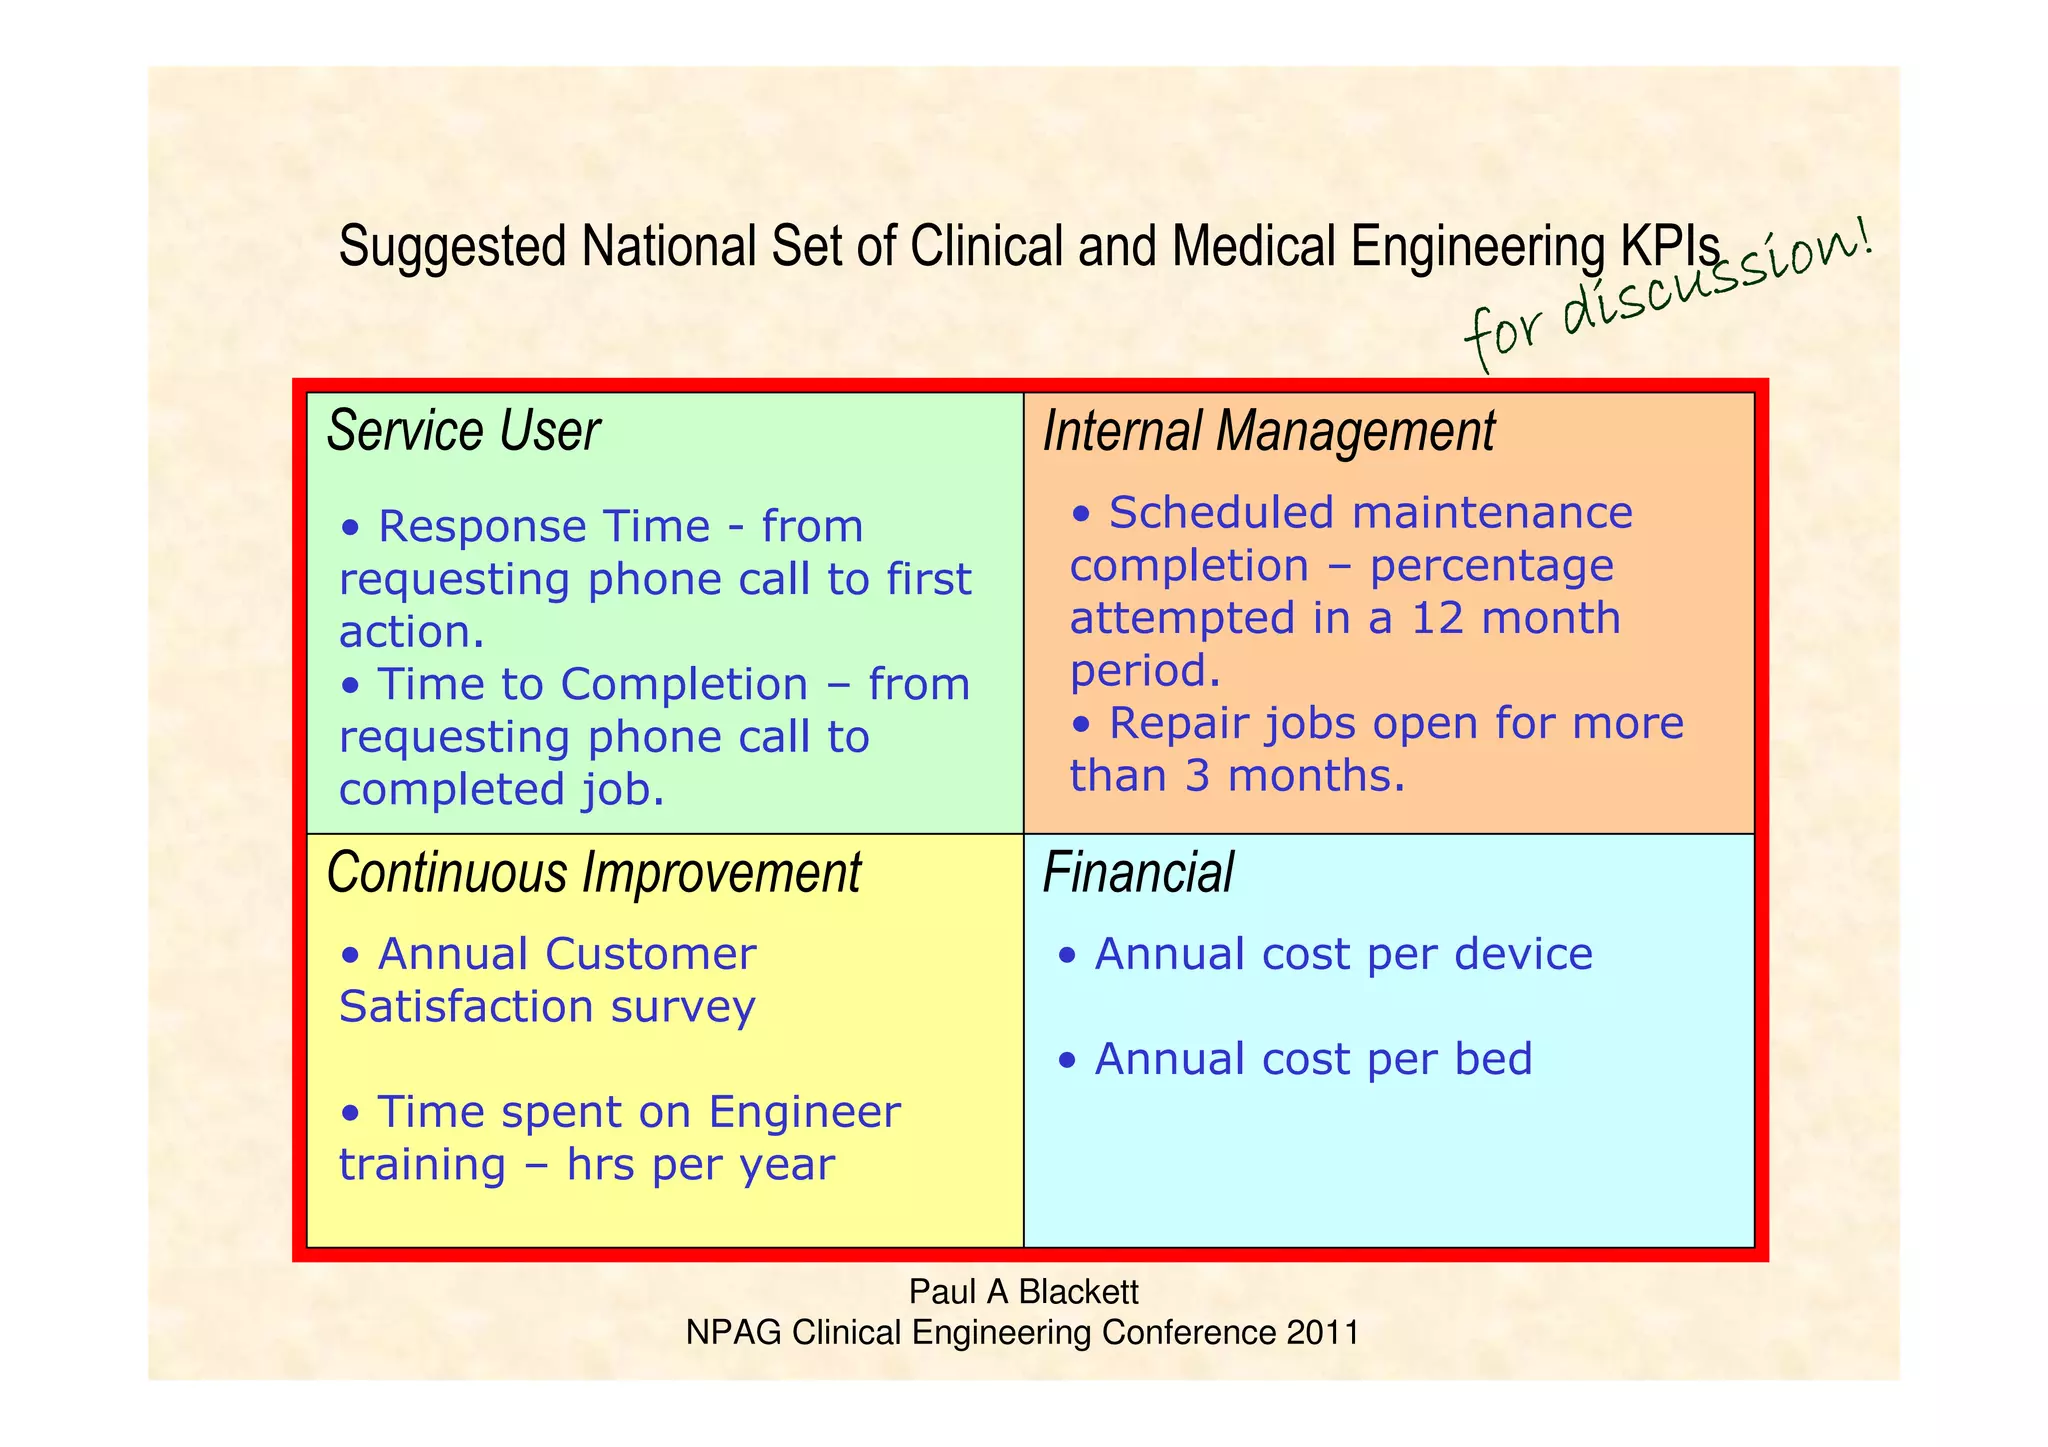
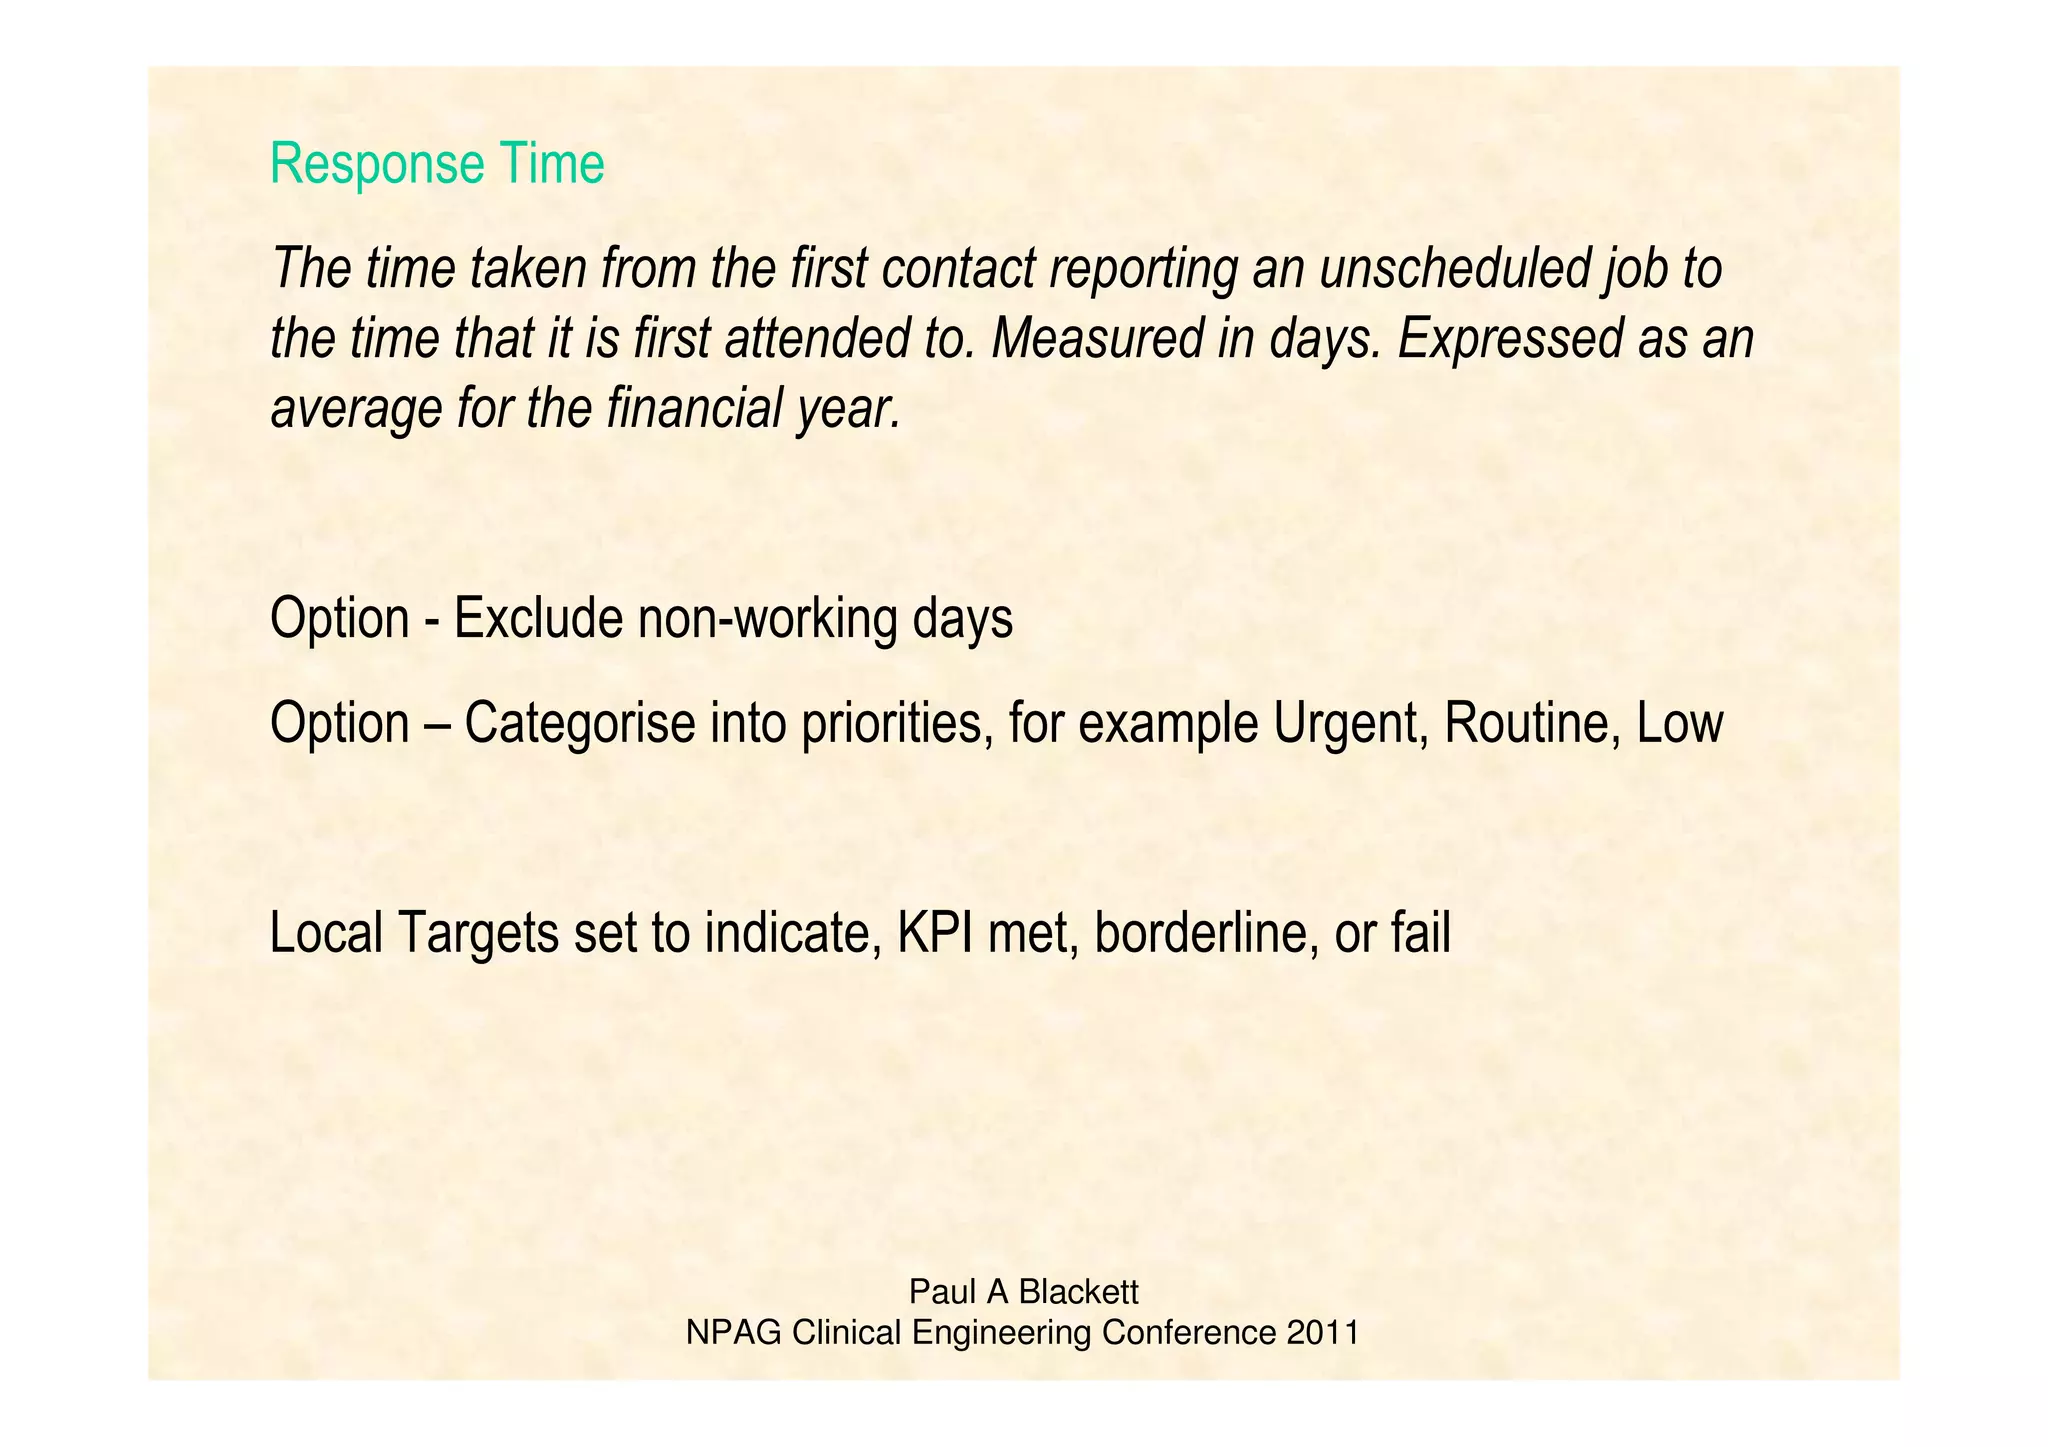
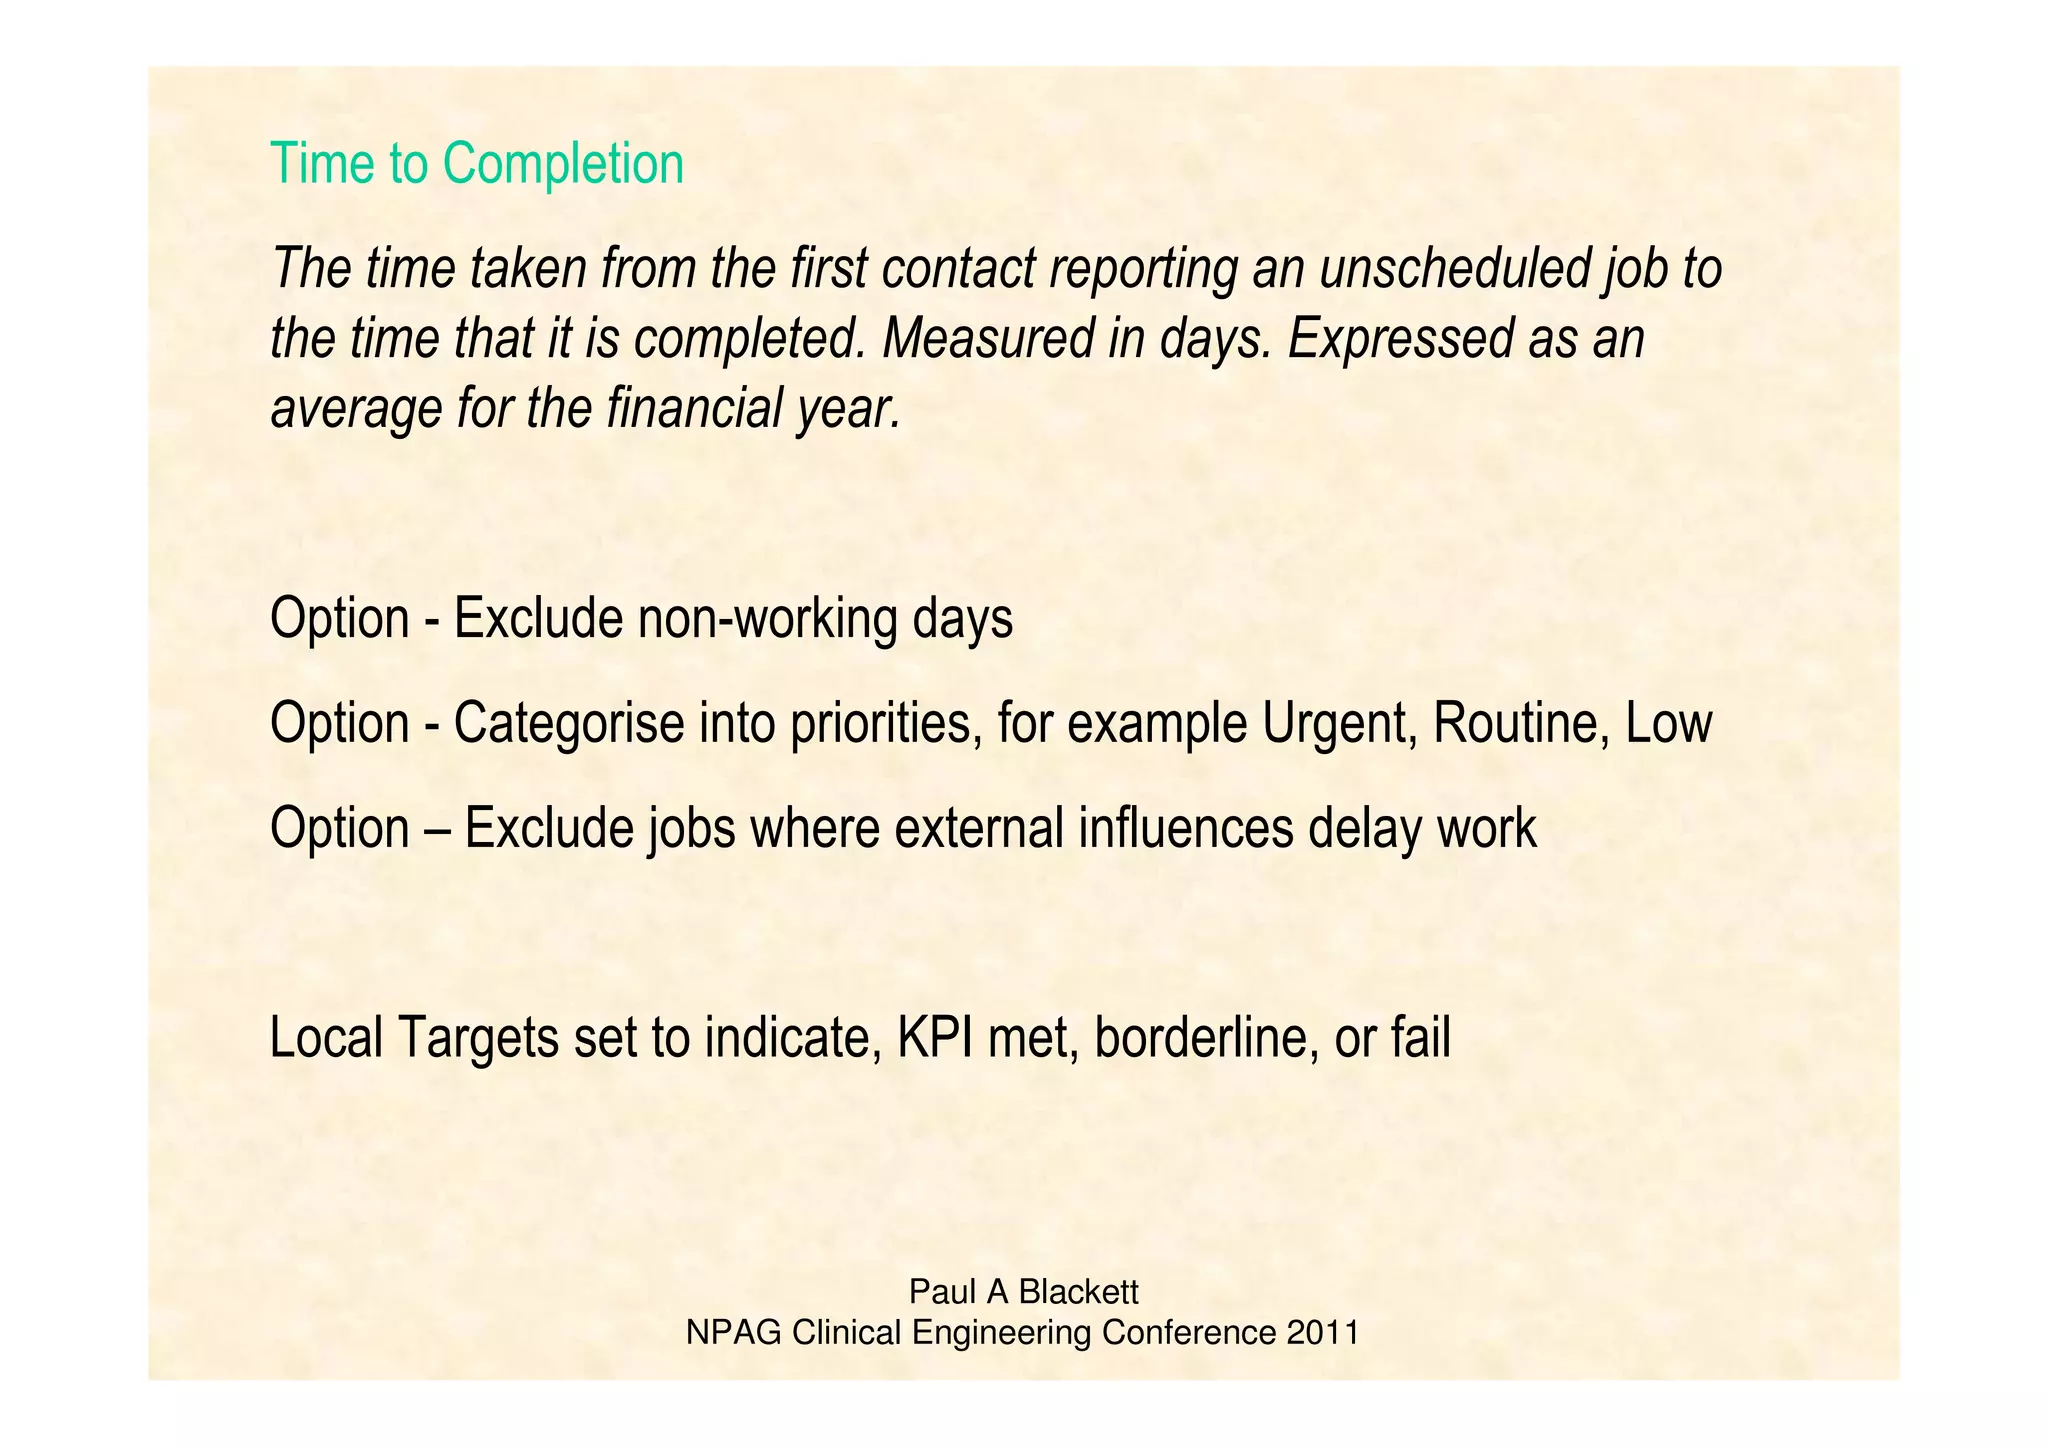
The document discusses the importance of Key Performance Indicators (KPIs) in clinical engineering, emphasizing their role as a measure of organizational performance. It provides practical tips for developing effective KPIs, which include being relevant, understandable, timely, and action-focused. Additionally, the document suggests a national set of KPIs for clinical and medical engineering to enhance service delivery and efficiency.


![[Whitepaper] Key Performance Indicator (KPI) Strategies: Part 2](https://cdn.slidesharecdn.com/ss_thumbnails/4006-200321162404-thumbnail.jpg?width=640&height=640&fit=bounds)


