This literature review examines project controls and their importance in project management. It discusses the key bodies of knowledge and nature of project control, highlighting planning, scheduling, cost control, change management, and performance measurement. Existing project control processes are outlined along with multi-dimensional and 4D/5D visualization approaches. The review establishes the background and context for the research into improving project controls in the UK construction industry.


![76
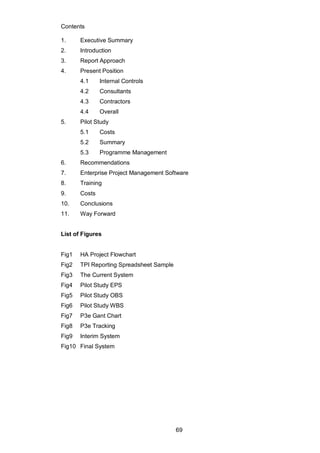
Fig2: TPI Reporting Spreadsheet Sample
Source: Company C TPI reporting Excel Spreadsheet
Uniformity has been achieved in recent times within the TPI sheets;
however data is from a myriad of packages and inputted manually with no
set access rights.
4.2 Consultants
The role of the consultant, in the early stages, is to act on behalf of
Company C in the surveying, design, economics and „in confidence‟ works.
In general, consultants also have available MSP, however the general
consensus, even within some consultants, is that it is not used effectively
for progress monitoring and some of the consultants interviewed seemed to
have little knowledge of progress monitoring in this regard, however, other
consultants are very capable at progress monitoring, but due to „budgetary
constraints‟ they limit the monitoring.
Once there is a contractor allocated to the project, the role of the consultant
shifts to that of employer‟s agent; there is occasionally a change of
consultant at this stage, depending on CFADS group requirements. The
employer‟s agent is in a position to monitor the contractor as well as other
duties; there is, however, little confidence that this is done effectively on a
KEY PROJECT EVENTS
Points
Past
Achieved
inYear
Baseline
inYear
Achieved
inYear
Forecast
Future
Forecast
ACHIEVED
(MM/YY)
F/CAST
(MM/YY)
HA Commissioned/Project Commencement 1 Jun-03
Strategic Assessment Complete (LGC 0) 1
Consultant Selected and Briefed 1
Public Consultation options selected 1
Value Management Completed 1
Reports and Estimates Approved 1
Business Case Approved (OGC1) 1
Procurement Strategy Confirmed (OGC2) 1 Sep-03
Public Consultation Start 2
ECI Tenders Invited 1 01/07/03 Single
Tender Assessment Completed 1
Preferred Route Selected 3
DfT / Ministerial Approval 2
Preferred Route Announcement 2
Value Engineering Completed 4
Investment Decision Confirmed (OGC3) 2 Sep-03
ECI Contract Awarded 3 Aug-03
Preliminary Designs & Consultations completed 3
Reports and Estimates Approved 3
Stage 3 Assessment Report approved 3
Draft Orders and ES Published (OGC 3A) 5
End of Objection Period 3
PI Notice Issued 3
Public Inquiry Start 4
Post Inquiry Risk Assessment Completed 2
Imspector's Report Received 2
Secretary of State's Decision Announced 2
Orders Made 2
End of High Court Challenge Period 2
Works Price Reviewed/Confirmed (OGC3B) 2
Works Commitment Approval 2
Notices to Treat and Enter Served 1
Land Entry Secures 1
Start of Works 1 Oct-03
Road Opened 26 Dec-04
Business Confirms Readiness for Service (OGC4) 1 Spring-05
Handed into Maintenance 1
Noise Appeals Completed 1
First Pt 1 Claims Notice Published 1
Maintenance Certificate Issued 1
Benefits Evaluation Review Complete (OGC5) 0
Financially Closed 0
PROGRESS 100 0 0 0 0 0
AGREED
TARGET
FORECAST
Start of Year (Achieved in preceeding Year)
Current Position
End of Year (March)
TOTAL N/A N/A
IN-YEAR BUDGET CONTROL (excluding Land)
In-Year Budget (Fixed for Year) - [C]
Last Month's FYF - [D]
This Month's FYF - [E]
In-Month Variance - [E-D]
Variance to Budget - [C-E]
TOTAL PROJECT EXPENDITURE (excluding Land)
Historical Spend (post Apr 01/TPI entry)
In- Year Spend
Future Years Spend
TOTAL
30.500
26.863
28.862
1.999
53.020
AMOUNT £m
18.617
5.541
28.862
1.638
AMOUNT £m](https://image.slidesharecdn.com/112675-150805074221-lva1-app6891/85/Project-highlights-88-320.jpg)