Download as PDF, PPTX


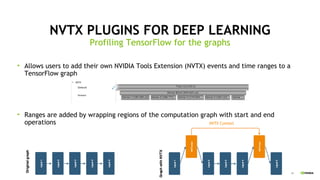
![26
loss = model(input_ids, segment_ids, input_mask, start_positions, end_positions)
...
if args.fp16:
optimizer.backward(loss)
else:
loss.backward()
if (step + 1) % args.gradient_accumulation_steps == 0:
if args.fp16:
# modify learning rate with special warm up BERT uses
# if args.fp16 is False, BertAdam is used and handles this automatically
lr_this_step = args.learning_rate * warmup_linear.get_lr(global_step, args.warmup_proportion)
for param_group in optimizer.param_groups:
param_group['lr'] = lr_this_step
optimizer.step()
optimizer.zero_grad()
global_step += 1
Foward
Backward
NVTX TAGGING](https://image.slidesharecdn.com/profilingdlnetwork-190909051959/85/Profiling-deep-learning-network-using-NVIDIA-nsight-systems-26-320.jpg)
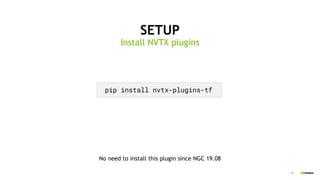
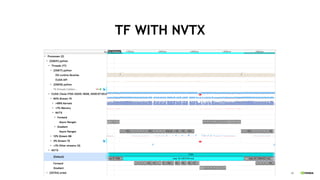
![27
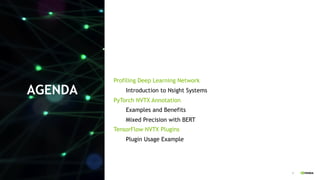
nvtx.range_push("Batch " + str(step))
nvtx.range_push("Forward pass")
loss = model(input_ids, segment_ids, input_mask, start_positions, end_positions)
nvtx.range_pop()
...
nvtx.range_push("Backward pass")
if args.fp16:
optimizer.backward(loss)
else:
loss.backward()
if (step + 1) % args.gradient_accumulation_steps == 0:
if args.fp16:
# modify learning rate with special warm up BERT uses
# if args.fp16 is False, BertAdam is used and handles this automatically
lr_this_step = args.learning_rate * warmup_linear.get_lr(global_step, args.warmup_proportion)
for param_group in optimizer.param_groups:
param_group['lr'] = lr_this_step
optimizer.step()
optimizer.zero_grad()
global_step += 1
nvtx.range_pop()
nvtx.range_pop()
Foward
Backward
NVTX TAGGING](https://image.slidesharecdn.com/profilingdlnetwork-190909051959/85/Profiling-deep-learning-network-using-NVIDIA-nsight-systems-27-320.jpg)

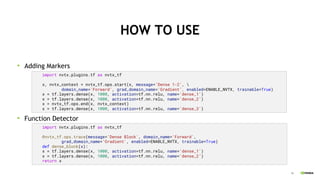
![37
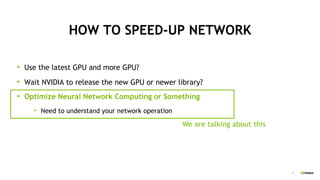
WORKING WITH SESSION/TF.ESTIMATOR
from nvtx.plugins.tf.estimator import NVTXHook
nvtx_callback = NVTXHook(skip_n_steps=1, name='Train’)
training_hooks=[]
training_hooks.append(nvtx_callback)
with tf.train.MonitoredSession(hooks=[nvtx_callback]) as sess:
tf.estimator.Estimator(hooks=training_hooks, ...)](https://image.slidesharecdn.com/profilingdlnetwork-190909051959/85/Profiling-deep-learning-network-using-NVIDIA-nsight-systems-37-320.jpg)
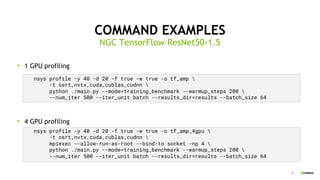
![38
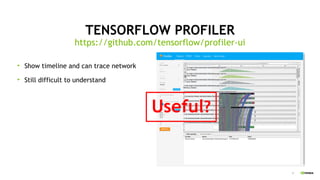
PROFIING MPI PROCESS
To profile everything, putting the data into one file
To profile everything, putting the data into each node into a separated file
nsys [nsys options] mpirun [mpi options]
mpirun [mpi options] nsys profile [nsys options]](https://image.slidesharecdn.com/profilingdlnetwork-190909051959/85/Profiling-deep-learning-network-using-NVIDIA-nsight-systems-38-320.jpg)


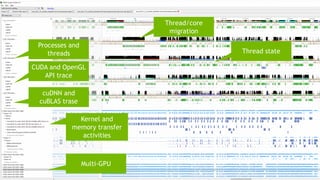
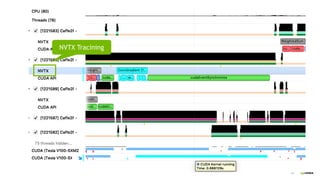
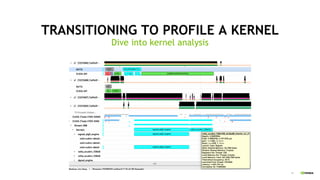
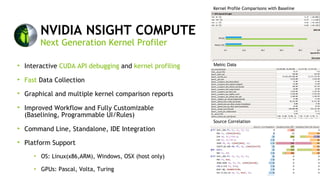
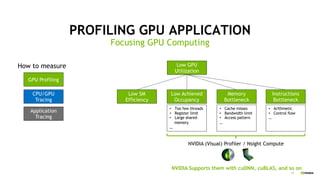
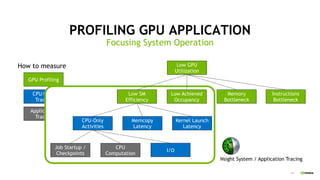
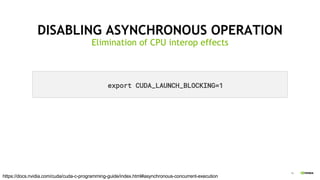
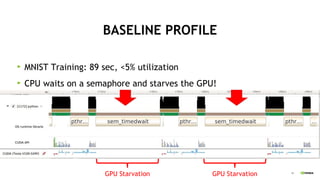
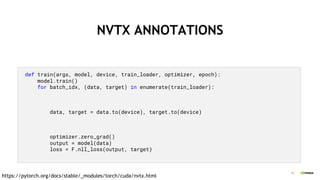
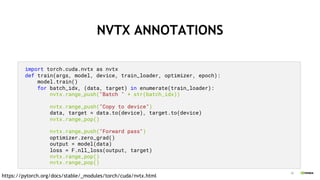
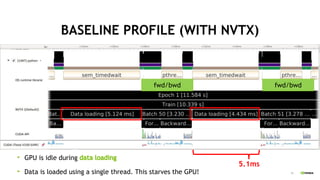
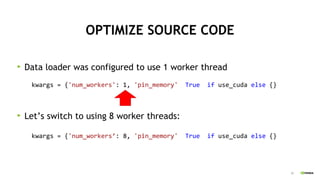
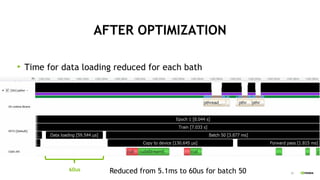
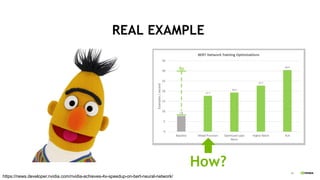
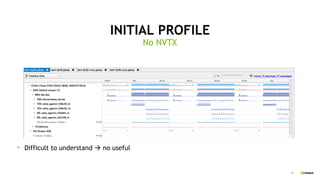
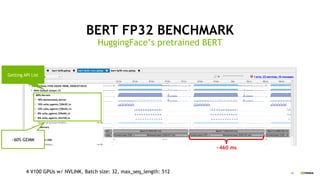
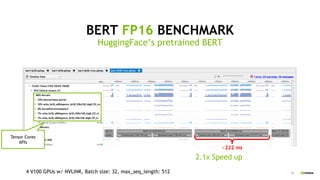
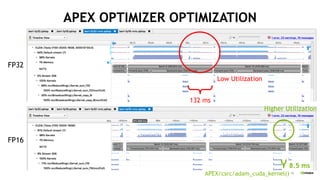
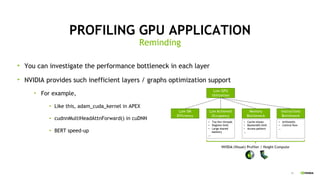
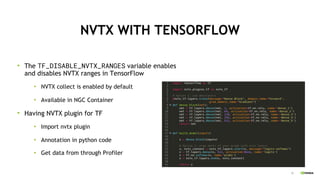
Jack Han presented on profiling deep learning networks using NVIDIA tools. He discussed annotating PyTorch models with NVTX to identify bottlenecks, optimizing data loading in PyTorch, and achieving a 4x speedup on BERT by using mixed precision and Tensor Cores. He also covered profiling TensorFlow graphs with NVTX plugins and command examples for profiling multi-GPU applications with Nsight Systems.