Download as KEY, PPTX


![“Did [Previous PM] send you his
spreadsheet of [5 trillion un-
prioritized] feature requests?”
- VP Product Management](https://image.slidesharecdn.com/prioritization301-120610222508-phpapp01/85/Prioritization-301-Advanced-Roadmapping-Class-Bruce-McCarthy-4-320.jpg)
![“We need this to close
[big deal] this quarter!”
- Key Sales Person](https://image.slidesharecdn.com/prioritization301-120610222508-phpapp01/85/Prioritization-301-Advanced-Roadmapping-Class-Bruce-McCarthy-5-320.jpg)
![“37% of our Support calls are about
[oldest, hairiest part of the code].
Can’t we fix it?”
- Support Manager](https://image.slidesharecdn.com/prioritization301-120610222508-phpapp01/85/Prioritization-301-Advanced-Roadmapping-Class-Bruce-McCarthy-6-320.jpg)
![“[Shiny tech thing] will make
[your top priority] much easier!”
- Tech Lead](https://image.slidesharecdn.com/prioritization301-120610222508-phpapp01/85/Prioritization-301-Advanced-Roadmapping-Class-Bruce-McCarthy-7-320.jpg)
![“[Previously irrelevant competitor]
just shipped [shiny feature]. How are
we going to leapfrog them?”
- VP Marketing](https://image.slidesharecdn.com/prioritization301-120610222508-phpapp01/85/Prioritization-301-Advanced-Roadmapping-Class-Bruce-McCarthy-8-320.jpg)
![“We gotta drop everything and work
on [meaningless buzzword]. It’s
gonna be huge!”
- VP Sales](https://image.slidesharecdn.com/prioritization301-120610222508-phpapp01/85/Prioritization-301-Advanced-Roadmapping-Class-Bruce-McCarthy-9-320.jpg)
![“If you don’t support [obscure
platform] I can’t buy your stuff.”
- Key Customer CTO](https://image.slidesharecdn.com/prioritization301-120610222508-phpapp01/85/Prioritization-301-Advanced-Roadmapping-Class-Bruce-McCarthy-10-320.jpg)
![“Why would anybody schedule [easy
feature] before [hard feature]? Who
approved that [expletive] idea?”
- CEO](https://image.slidesharecdn.com/prioritization301-120610222508-phpapp01/85/Prioritization-301-Advanced-Roadmapping-Class-Bruce-McCarthy-11-320.jpg)
![“What’s your business case for [CEO’s
pet project]? When do we make
money?”
- CFO](https://image.slidesharecdn.com/prioritization301-120610222508-phpapp01/85/Prioritization-301-Advanced-Roadmapping-Class-Bruce-McCarthy-12-320.jpg)
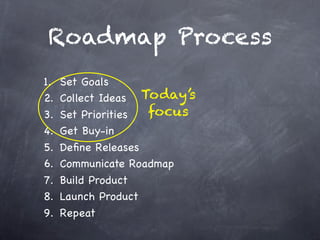

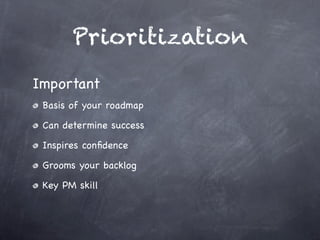
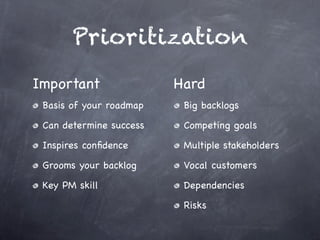

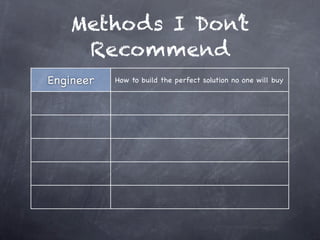
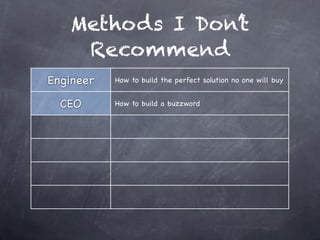
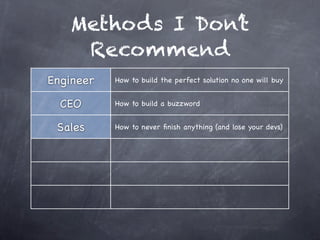
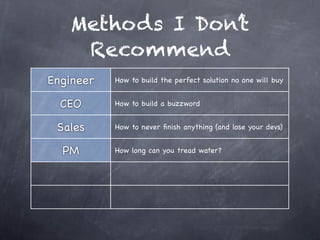
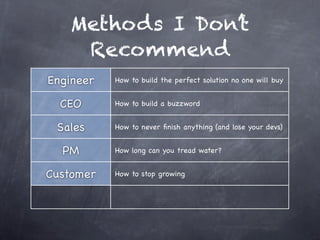
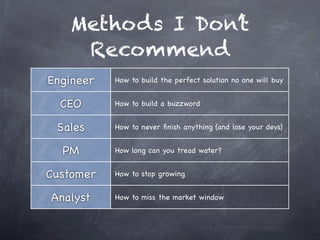


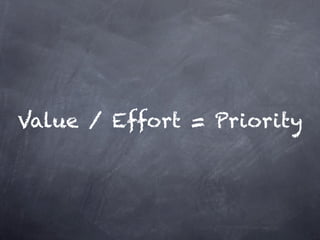
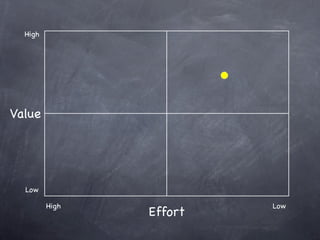
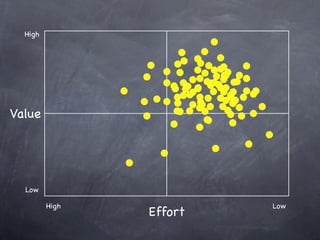
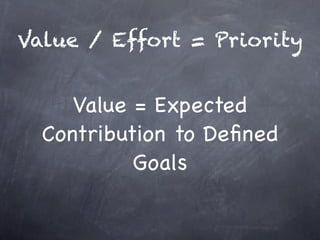


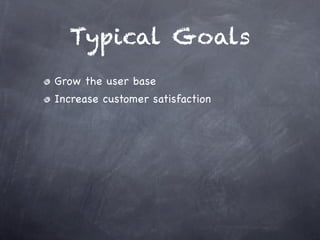
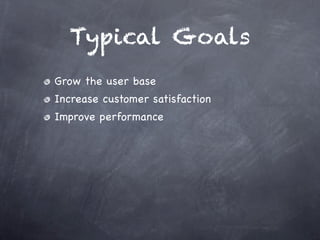
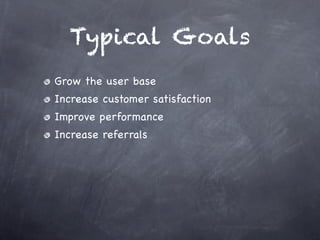
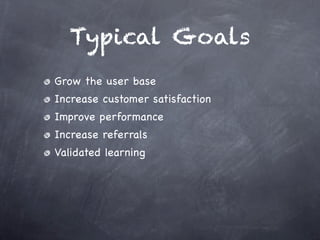
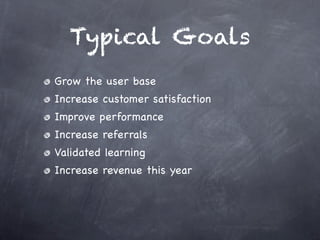
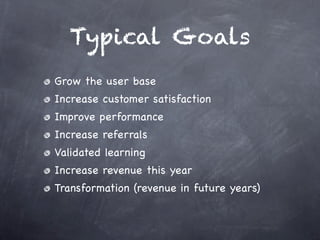
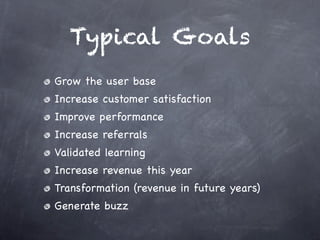
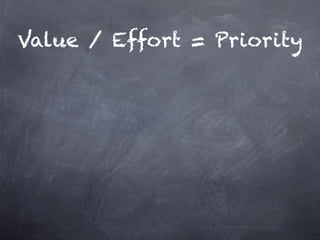
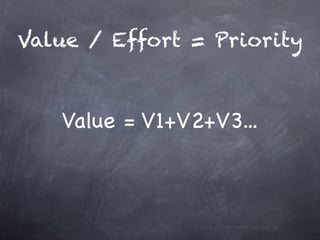

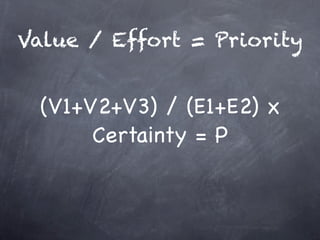

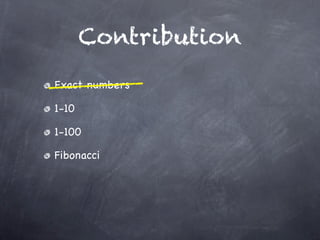
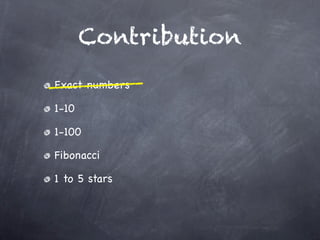
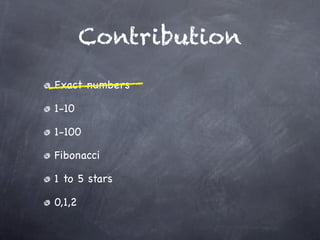
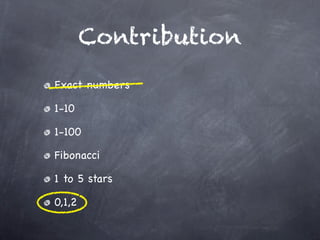

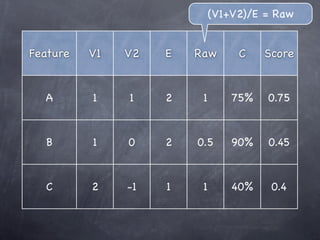
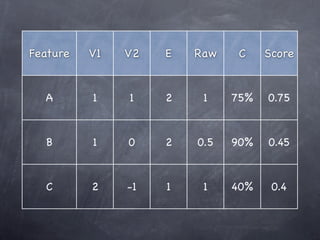
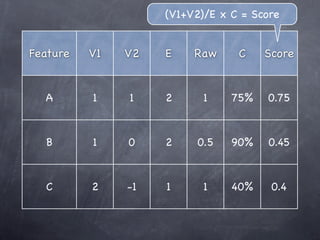


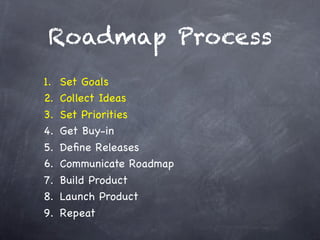
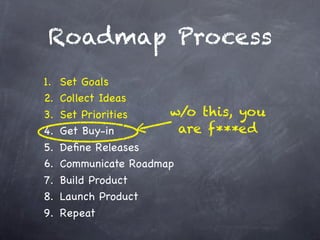


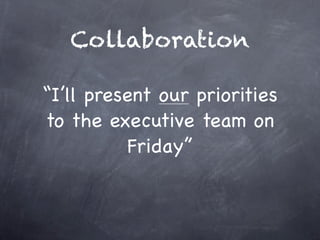
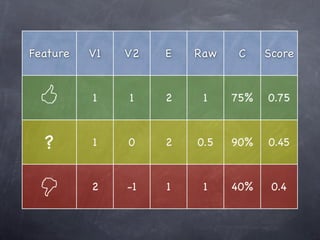


The document outlines the importance of prioritization within product management and presents a structured roadmap process for setting goals, collecting ideas, prioritizing, and communicating to ensure successful product launches. It emphasizes the need for collaboration with stakeholders and provides methods and frameworks for evaluating the value and effort of features. Bruce McCarthy from ReqQs shares insights to help product managers navigate competing demands and manage their backlogs effectively.


