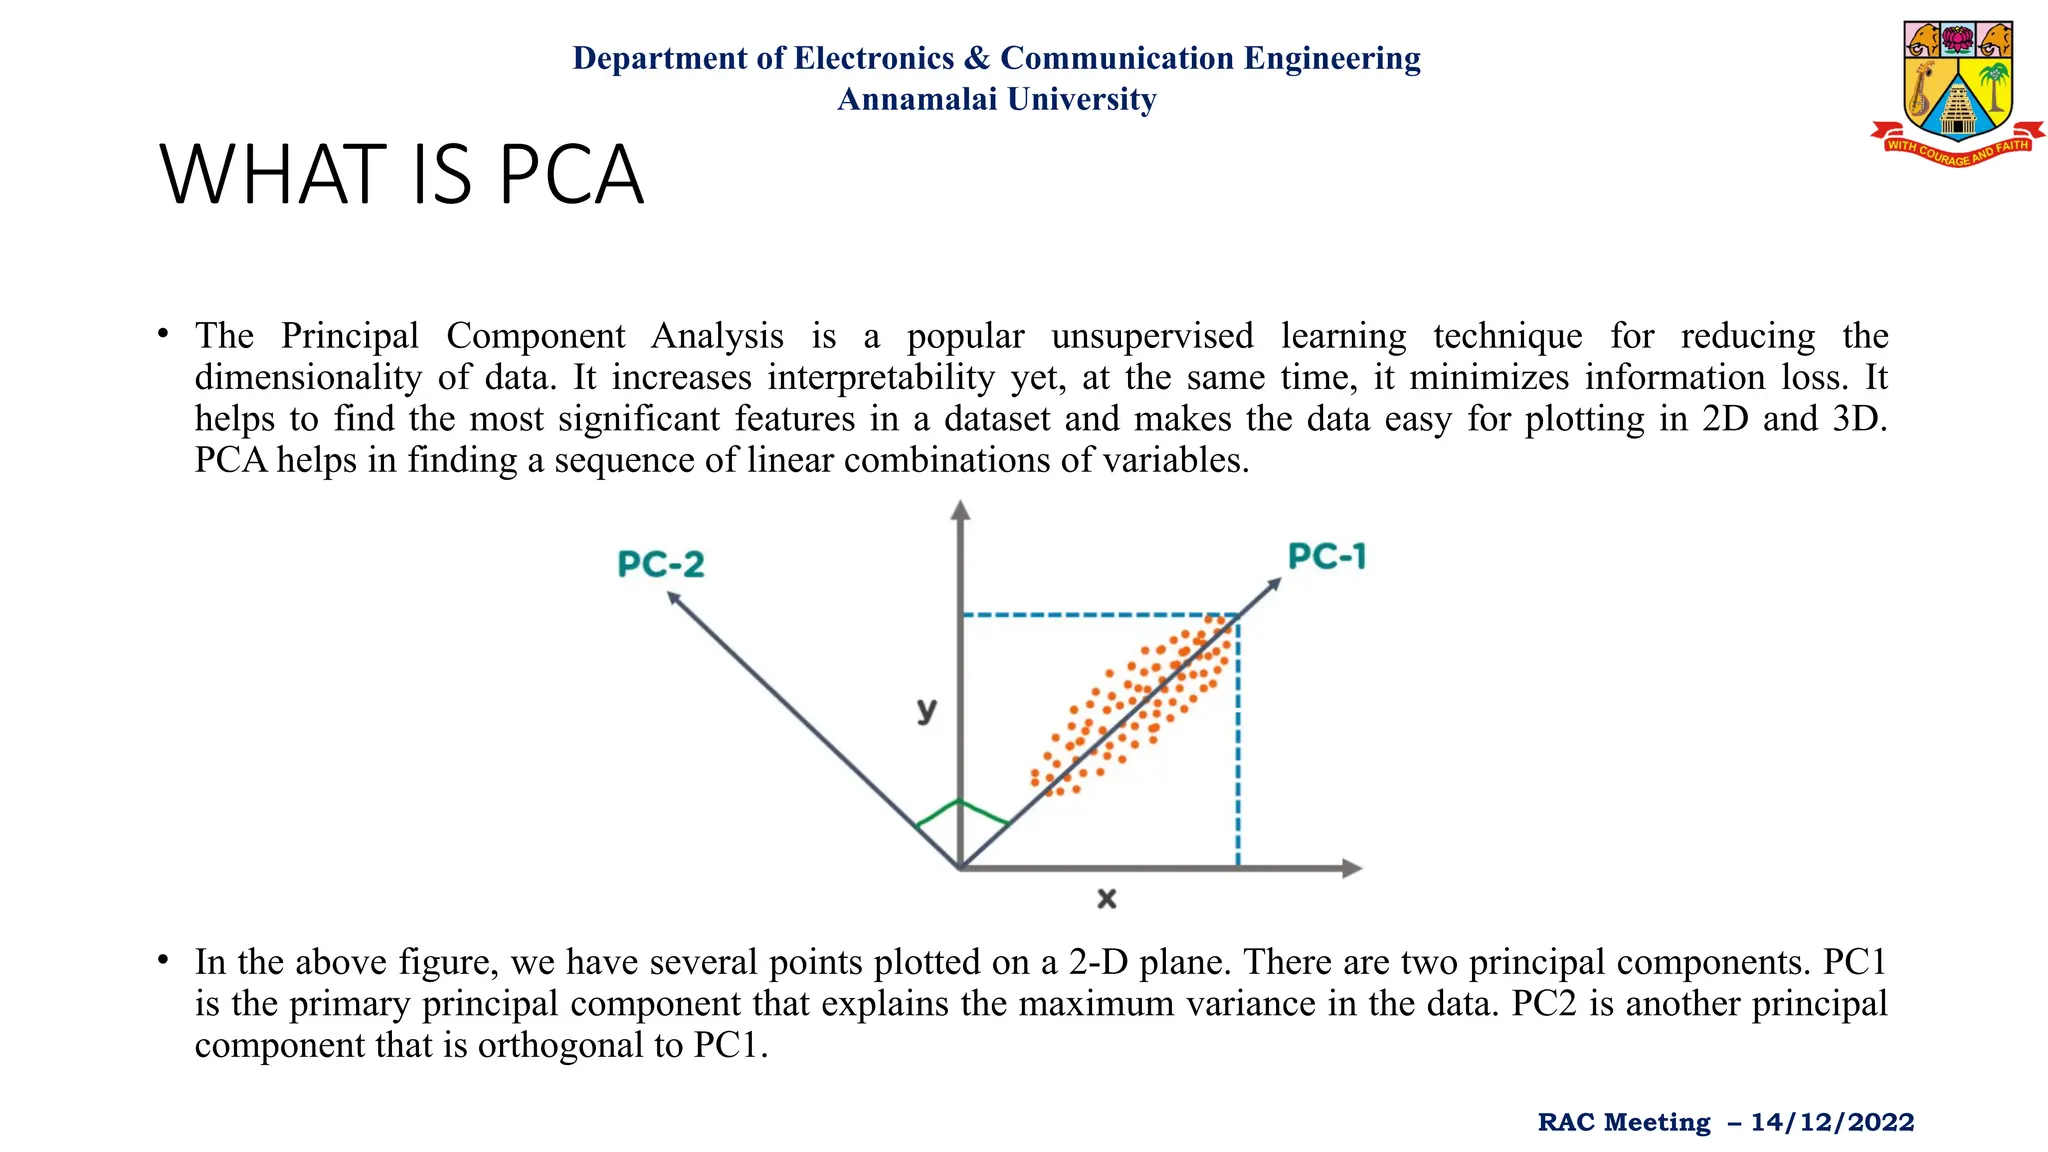
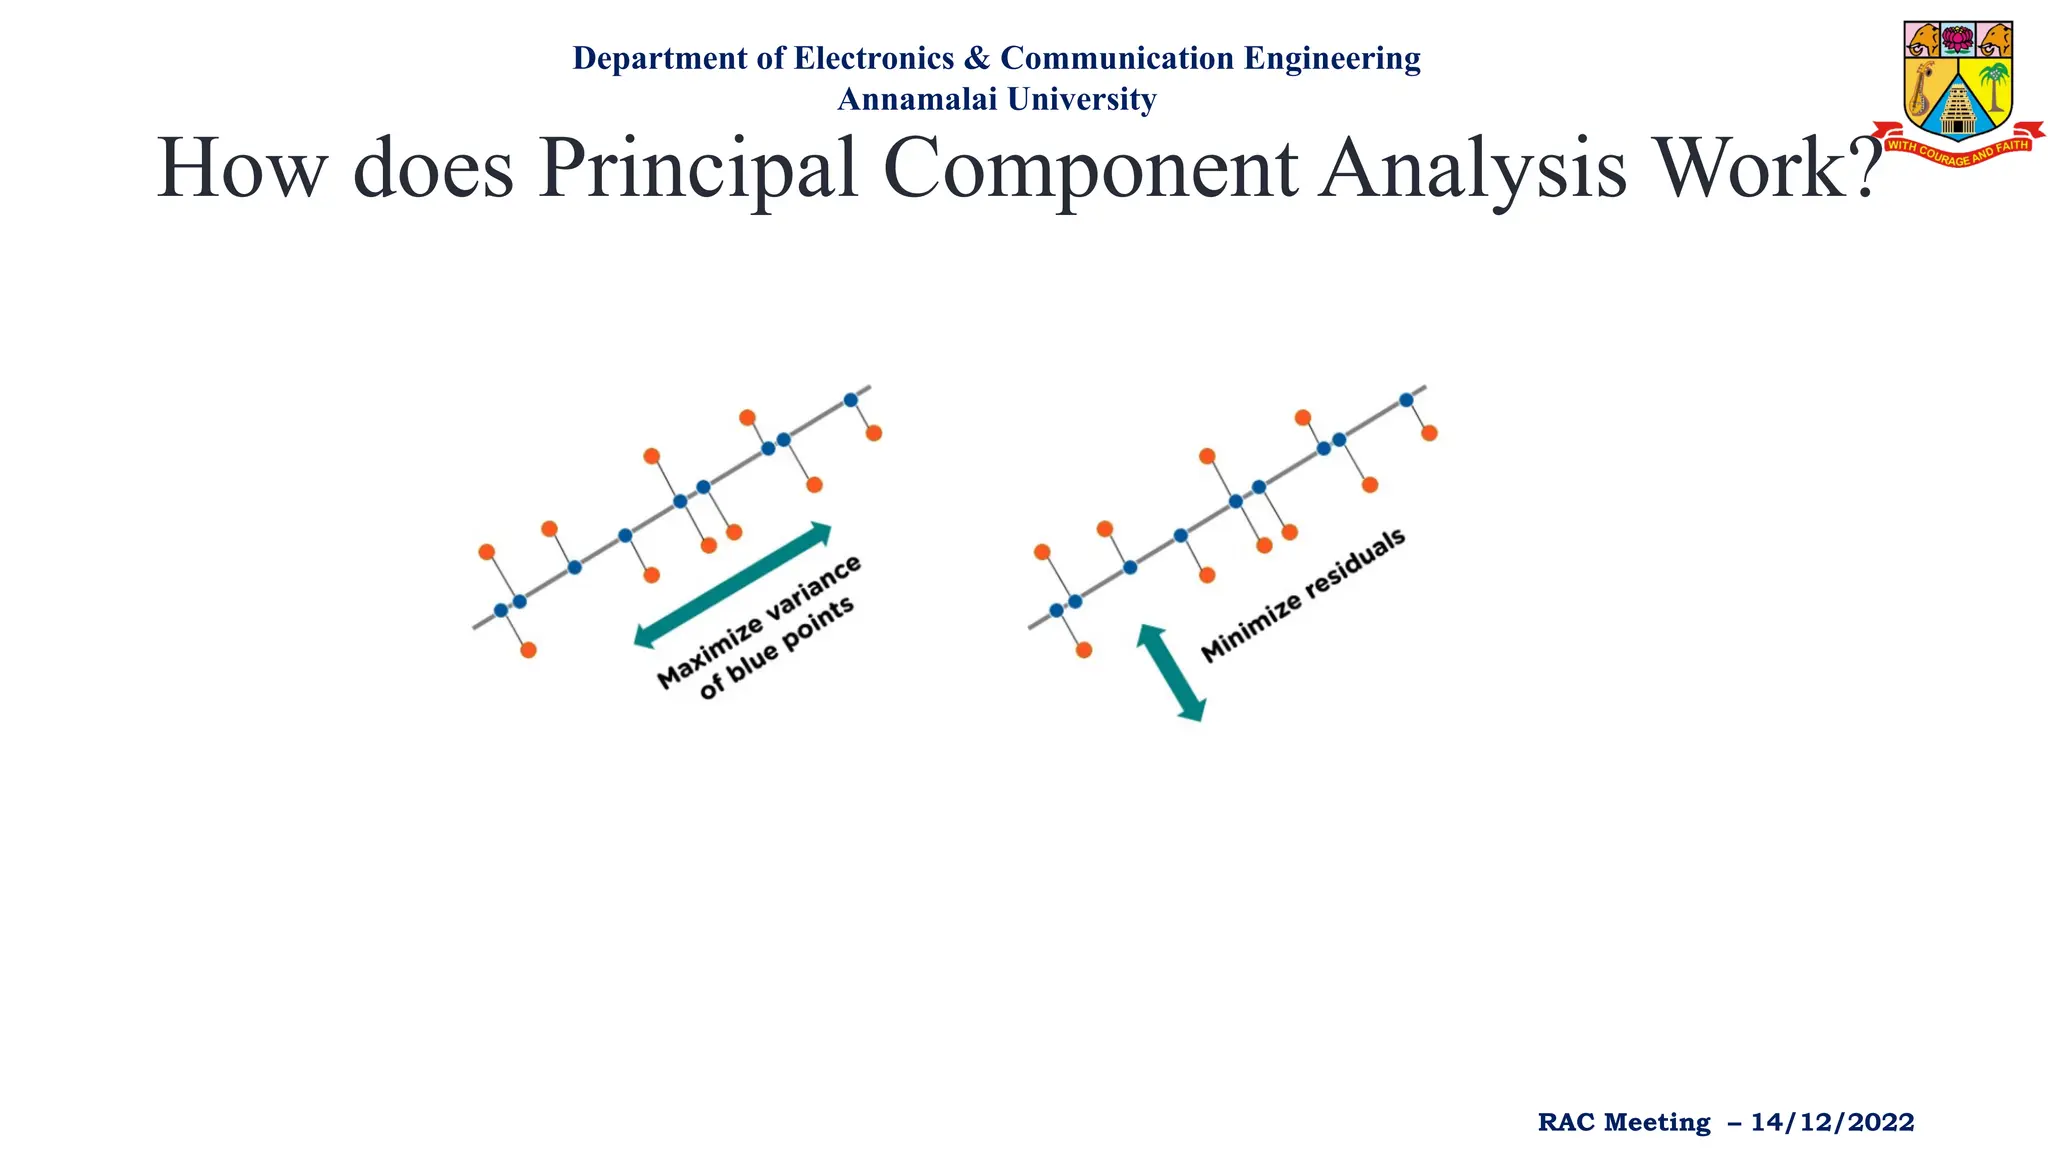
Introduction to
PCA
By NAGA V SATYANARAYANA K
WHY PCA IN ML
• While working with high-dimensional data, machine learning
models often seem to overfit, and this reduces the ability to
generalize past the training set examples. Hence, it is important to
perform dimensionality reduction techniques before creating a
model.
• Principal Component Analysis (PCA) is one of the most
commonly used unsupervised machine learning algorithms across
a variety of applications: exploratory data analysis, dimensionality
reduction, information compression, data de-noising, and plenty
more.
Department of Electronics & Communication Engineering
Annamalai University
RAC Meeting – 14/12/2022
WHAT IS PCA
• The Principal Component Analysis is a popular unsupervised learning technique for reducing the
dimensionality of data. It increases interpretability yet, at the same time, it minimizes information loss. It
helps to find the most significant features in a dataset and makes the data easy for plotting in 2D and 3D.
PCA helps in finding a sequence of linear combinations of variables.
• In the above figure, we have several points plotted on a 2-D plane. There are two principal components. PC1
is the primary principal component that explains the maximum variance in the data. PC2 is another principal
component that is orthogonal to PC1.
Department of Electronics & Communication Engineering
Annamalai University
RAC Meeting – 14/12/2022
What is a Principal Component?
• The Principal Components are a straight line that captures most of the
variance of the data. They have a direction and magnitude. Principal
components are orthogonal projections (perpendicular) of data onto
lower-dimensional space.
Department of Electronics & Communication Engineering
Annamalai University
RAC Meeting – 14/12/2022
EXAMPLE
• Before we delve into its inner workings, let’s first get a better understanding of PCA.
• Imagine we have a 2-dimensional dataset. Each dimension can be represented as a
feature column:
• We can represent the same dataset as a scatterplot:
Department of Electronics & Communication Engineering
Annamalai University
RAC Meeting – 14/12/2022
• The main aim of PCA is to find such principal components, which can
describe the data points with a set of... well, principal components.
• The principal components are vectors, but they are not chosen at
random. The first principal component is computed so that it explains
the greatest amount of variance in the original features. The second
component is orthogonal to the first, and it explains the greatest
amount of variance left after the first principal component.
• The original data can be represented as feature vectors. PCA allows us
to go a step further and represent the data as linear combinations of
principal components. Getting principal components is equivalent to a
linear transformation of data from the feature1 x feature2 axis to a
PCA1 x PCA2 axis.
Department of Electronics & Communication Engineering
Annamalai University
RAC Meeting – 14/12/2022
There are multiple ways to calculate PCA:
1.Eigen decomposition of the covariance matrix
2.Singular value decomposition of the data matrix
3.Eigenvalue approximation via power iterative computation
4.Non-linear iterative partial least squares (NIPALS) computation
5.… and more.
Department of Electronics & Communication Engineering
Annamalai University
RAC Meeting – 14/12/2022
• Feature standardization. We standardize each feature to
have a mean of 0 and a variance of 1. As we explain later in
assumptions and limitations, features with values that are on
different orders of magnitude prevent PCA from computing
the best principal components.
• Standardization is one type of scaling technique where the
values are centered around the mean with a unit standard
deviation. This means that the mean of the attribute becomes
zero and the resultant distribution has a unit standard
deviation.
• Here’s the formula for standardization:
1. Feature standardization
Department of Electronics & Communication Engineering
Annamalai University
RAC Meeting – 14/12/2022
2. covariance matrix computation
• Obtain the covariance matrix computation.
The covariance matrix is a square matrix, of d x
d dimensions, where d stands for “dimension”
(or feature or column, if our data is tabular). It
shows the pairwise feature correlation between
each feature.
• Construct a square matrix to express the
correlation between two or more features in a
multidimensional dataset.
Department of Electronics & Communication Engineering
Annamalai University
RAC Meeting – 14/12/2022
3.Calculate the eigen decomposition of the
covariance matrix.
• We calculate the eigenvectors (unit vectors) and their associated
eigenvalues (scalars by which we multiply the eigenvector) of the
covariance matrix.
• Calculate the eigenvectors/unit vectors and eigenvalues. Eigenvalues are
scalars by which we multiply the eigenvector of the covariance matrix.
Department of Electronics & Communication Engineering
Annamalai University
RAC Meeting – 14/12/2022
4. Sort the eigenvectors from the highest eigenvalue to
the lowest.
• The eigenvector with the highest eigenvalue is the first principal
component. Higher eigenvalues correspond to greater amounts of
shared variance explained.
Department of Electronics & Communication Engineering
Annamalai University
RAC Meeting – 14/12/2022
5. Select the number of principal components.
• Select the top N eigenvectors (based on their eigenvalues) to become
the N principal components. The optimal number of principal
components is both subjective and problem-dependent. Usually, we
look at the cumulative amount of shared variance explained by the
combination of principal components and pick that number of
components, which still significantly explains the shared variance.
Department of Electronics & Communication Engineering
Annamalai University
RAC Meeting – 14/12/2022
How does Principal Component Analysis Work?
Department of Electronics & Communication Engineering
Annamalai University
RAC Meeting – 14/12/2022
Advantages
1.Easy to compute. PCA is based on linear algebra, which is
computationally easy to solve by computers.
2.Speeds up other machine learning algorithms. Machine learning
algorithms converge faster when trained on principal components
instead of the original dataset.
3.Counteracts the issues of high-dimensional data. High-dimensional
data causes regression-based algorithms to overfit easily. By using
PCA beforehand to lower the dimensions of the training dataset, we
prevent the predictive algorithms from overfitting.
Department of Electronics & Communication Engineering
Annamalai University
RAC Meeting – 14/12/2022
Disadvantages
1.Low interpretability of principal components. Principal components
are linear combinations of the features from the original data, but they
are not as easy to interpret. For example, it is difficult to tell which are
the most important features in the dataset after computing principal
components.
2.The trade-off between information loss and dimensionality reduction.
Although dimensionality reduction is useful, it comes at a cost.
Information loss is a necessary part of PCA. Balancing the trade-off
between dimensionality reduction and information loss is unfortunately
a necessary compromise that we have to make when using PCA.
Department of Electronics & Communication Engineering
Annamalai University
RAC Meeting – 14/12/2022
Applications of PCA in Machine Learning
• PCA is used to visualize multidimensional data.
• It is used to reduce the number of dimensions in healthcare data.
• PCA can help resize an image.
• It can be used in finance to analyze stock data and forecast returns.
• PCA helps to find patterns in the high-dimensional datasets.
Visualize multidimensional data. Data visualizations are a great tool for
communicating multidimensional data as 2- or 3-dimensional plots.
Compress information. Principal Component Analysis is used to compress
information to store and transmit data more efficiently. For example, it can be
used to compress images without losing too much quality, or in signal processing.
The technique has successfully been applied across a wide range of compression
problems in pattern recognition (specifically face recognition), image recognition,
and more.
Department of Electronics & Communication Engineering
Annamalai University
RAC Meeting – 14/12/2022
• Simplify complex business decisions. PCA has been employed to
simplify traditionally complex business decisions. For example,
traders use over 300 financial instruments to manage portfolios. The
algorithm has proven successful in the risk management of interest
rate derivative portfolios, lowering the number of financial
instruments from more than 300 to just 3-4 principal components.
• Clarify convoluted scientific processes. The algorithm has been
applied extensively in the understanding of convoluted and
multidirectional factors, which increase the probability of neural
ensembles to trigger action potentials.
Contd… Department of Electronics & Communication Engineering
Annamalai University
RAC Meeting – 14/12/2022
THANK YOU
Department of Electronics & Communication Engineering
Annamalai University
RAC Meeting – 14/12/2022

Principal component analysis in machine L

  • 1.
    Introduction to PCA By NAGAV SATYANARAYANA K
  • 2.
    WHY PCA INML • While working with high-dimensional data, machine learning models often seem to overfit, and this reduces the ability to generalize past the training set examples. Hence, it is important to perform dimensionality reduction techniques before creating a model. • Principal Component Analysis (PCA) is one of the most commonly used unsupervised machine learning algorithms across a variety of applications: exploratory data analysis, dimensionality reduction, information compression, data de-noising, and plenty more. Department of Electronics & Communication Engineering Annamalai University RAC Meeting – 14/12/2022
  • 3.
    WHAT IS PCA •The Principal Component Analysis is a popular unsupervised learning technique for reducing the dimensionality of data. It increases interpretability yet, at the same time, it minimizes information loss. It helps to find the most significant features in a dataset and makes the data easy for plotting in 2D and 3D. PCA helps in finding a sequence of linear combinations of variables. • In the above figure, we have several points plotted on a 2-D plane. There are two principal components. PC1 is the primary principal component that explains the maximum variance in the data. PC2 is another principal component that is orthogonal to PC1. Department of Electronics & Communication Engineering Annamalai University RAC Meeting – 14/12/2022
  • 4.
    What is aPrincipal Component? • The Principal Components are a straight line that captures most of the variance of the data. They have a direction and magnitude. Principal components are orthogonal projections (perpendicular) of data onto lower-dimensional space. Department of Electronics & Communication Engineering Annamalai University RAC Meeting – 14/12/2022
  • 5.
    EXAMPLE • Before wedelve into its inner workings, let’s first get a better understanding of PCA. • Imagine we have a 2-dimensional dataset. Each dimension can be represented as a feature column: • We can represent the same dataset as a scatterplot: Department of Electronics & Communication Engineering Annamalai University RAC Meeting – 14/12/2022
  • 6.
    • The mainaim of PCA is to find such principal components, which can describe the data points with a set of... well, principal components. • The principal components are vectors, but they are not chosen at random. The first principal component is computed so that it explains the greatest amount of variance in the original features. The second component is orthogonal to the first, and it explains the greatest amount of variance left after the first principal component. • The original data can be represented as feature vectors. PCA allows us to go a step further and represent the data as linear combinations of principal components. Getting principal components is equivalent to a linear transformation of data from the feature1 x feature2 axis to a PCA1 x PCA2 axis. Department of Electronics & Communication Engineering Annamalai University RAC Meeting – 14/12/2022
  • 7.
    There are multipleways to calculate PCA: 1.Eigen decomposition of the covariance matrix 2.Singular value decomposition of the data matrix 3.Eigenvalue approximation via power iterative computation 4.Non-linear iterative partial least squares (NIPALS) computation 5.… and more. Department of Electronics & Communication Engineering Annamalai University RAC Meeting – 14/12/2022
  • 8.
    • Feature standardization.We standardize each feature to have a mean of 0 and a variance of 1. As we explain later in assumptions and limitations, features with values that are on different orders of magnitude prevent PCA from computing the best principal components. • Standardization is one type of scaling technique where the values are centered around the mean with a unit standard deviation. This means that the mean of the attribute becomes zero and the resultant distribution has a unit standard deviation. • Here’s the formula for standardization: 1. Feature standardization Department of Electronics & Communication Engineering Annamalai University RAC Meeting – 14/12/2022
  • 9.
    2. covariance matrixcomputation • Obtain the covariance matrix computation. The covariance matrix is a square matrix, of d x d dimensions, where d stands for “dimension” (or feature or column, if our data is tabular). It shows the pairwise feature correlation between each feature. • Construct a square matrix to express the correlation between two or more features in a multidimensional dataset. Department of Electronics & Communication Engineering Annamalai University RAC Meeting – 14/12/2022
  • 10.
    3.Calculate the eigendecomposition of the covariance matrix. • We calculate the eigenvectors (unit vectors) and their associated eigenvalues (scalars by which we multiply the eigenvector) of the covariance matrix. • Calculate the eigenvectors/unit vectors and eigenvalues. Eigenvalues are scalars by which we multiply the eigenvector of the covariance matrix. Department of Electronics & Communication Engineering Annamalai University RAC Meeting – 14/12/2022
  • 11.
    4. Sort theeigenvectors from the highest eigenvalue to the lowest. • The eigenvector with the highest eigenvalue is the first principal component. Higher eigenvalues correspond to greater amounts of shared variance explained. Department of Electronics & Communication Engineering Annamalai University RAC Meeting – 14/12/2022
  • 12.
    5. Select thenumber of principal components. • Select the top N eigenvectors (based on their eigenvalues) to become the N principal components. The optimal number of principal components is both subjective and problem-dependent. Usually, we look at the cumulative amount of shared variance explained by the combination of principal components and pick that number of components, which still significantly explains the shared variance. Department of Electronics & Communication Engineering Annamalai University RAC Meeting – 14/12/2022
  • 13.
    How does PrincipalComponent Analysis Work? Department of Electronics & Communication Engineering Annamalai University RAC Meeting – 14/12/2022
  • 14.
    Advantages 1.Easy to compute.PCA is based on linear algebra, which is computationally easy to solve by computers. 2.Speeds up other machine learning algorithms. Machine learning algorithms converge faster when trained on principal components instead of the original dataset. 3.Counteracts the issues of high-dimensional data. High-dimensional data causes regression-based algorithms to overfit easily. By using PCA beforehand to lower the dimensions of the training dataset, we prevent the predictive algorithms from overfitting. Department of Electronics & Communication Engineering Annamalai University RAC Meeting – 14/12/2022
  • 15.
    Disadvantages 1.Low interpretability ofprincipal components. Principal components are linear combinations of the features from the original data, but they are not as easy to interpret. For example, it is difficult to tell which are the most important features in the dataset after computing principal components. 2.The trade-off between information loss and dimensionality reduction. Although dimensionality reduction is useful, it comes at a cost. Information loss is a necessary part of PCA. Balancing the trade-off between dimensionality reduction and information loss is unfortunately a necessary compromise that we have to make when using PCA. Department of Electronics & Communication Engineering Annamalai University RAC Meeting – 14/12/2022
  • 16.
    Applications of PCAin Machine Learning • PCA is used to visualize multidimensional data. • It is used to reduce the number of dimensions in healthcare data. • PCA can help resize an image. • It can be used in finance to analyze stock data and forecast returns. • PCA helps to find patterns in the high-dimensional datasets. Visualize multidimensional data. Data visualizations are a great tool for communicating multidimensional data as 2- or 3-dimensional plots. Compress information. Principal Component Analysis is used to compress information to store and transmit data more efficiently. For example, it can be used to compress images without losing too much quality, or in signal processing. The technique has successfully been applied across a wide range of compression problems in pattern recognition (specifically face recognition), image recognition, and more. Department of Electronics & Communication Engineering Annamalai University RAC Meeting – 14/12/2022
  • 17.
    • Simplify complexbusiness decisions. PCA has been employed to simplify traditionally complex business decisions. For example, traders use over 300 financial instruments to manage portfolios. The algorithm has proven successful in the risk management of interest rate derivative portfolios, lowering the number of financial instruments from more than 300 to just 3-4 principal components. • Clarify convoluted scientific processes. The algorithm has been applied extensively in the understanding of convoluted and multidirectional factors, which increase the probability of neural ensembles to trigger action potentials. Contd… Department of Electronics & Communication Engineering Annamalai University RAC Meeting – 14/12/2022
  • 18.
    THANK YOU Department ofElectronics & Communication Engineering Annamalai University RAC Meeting – 14/12/2022