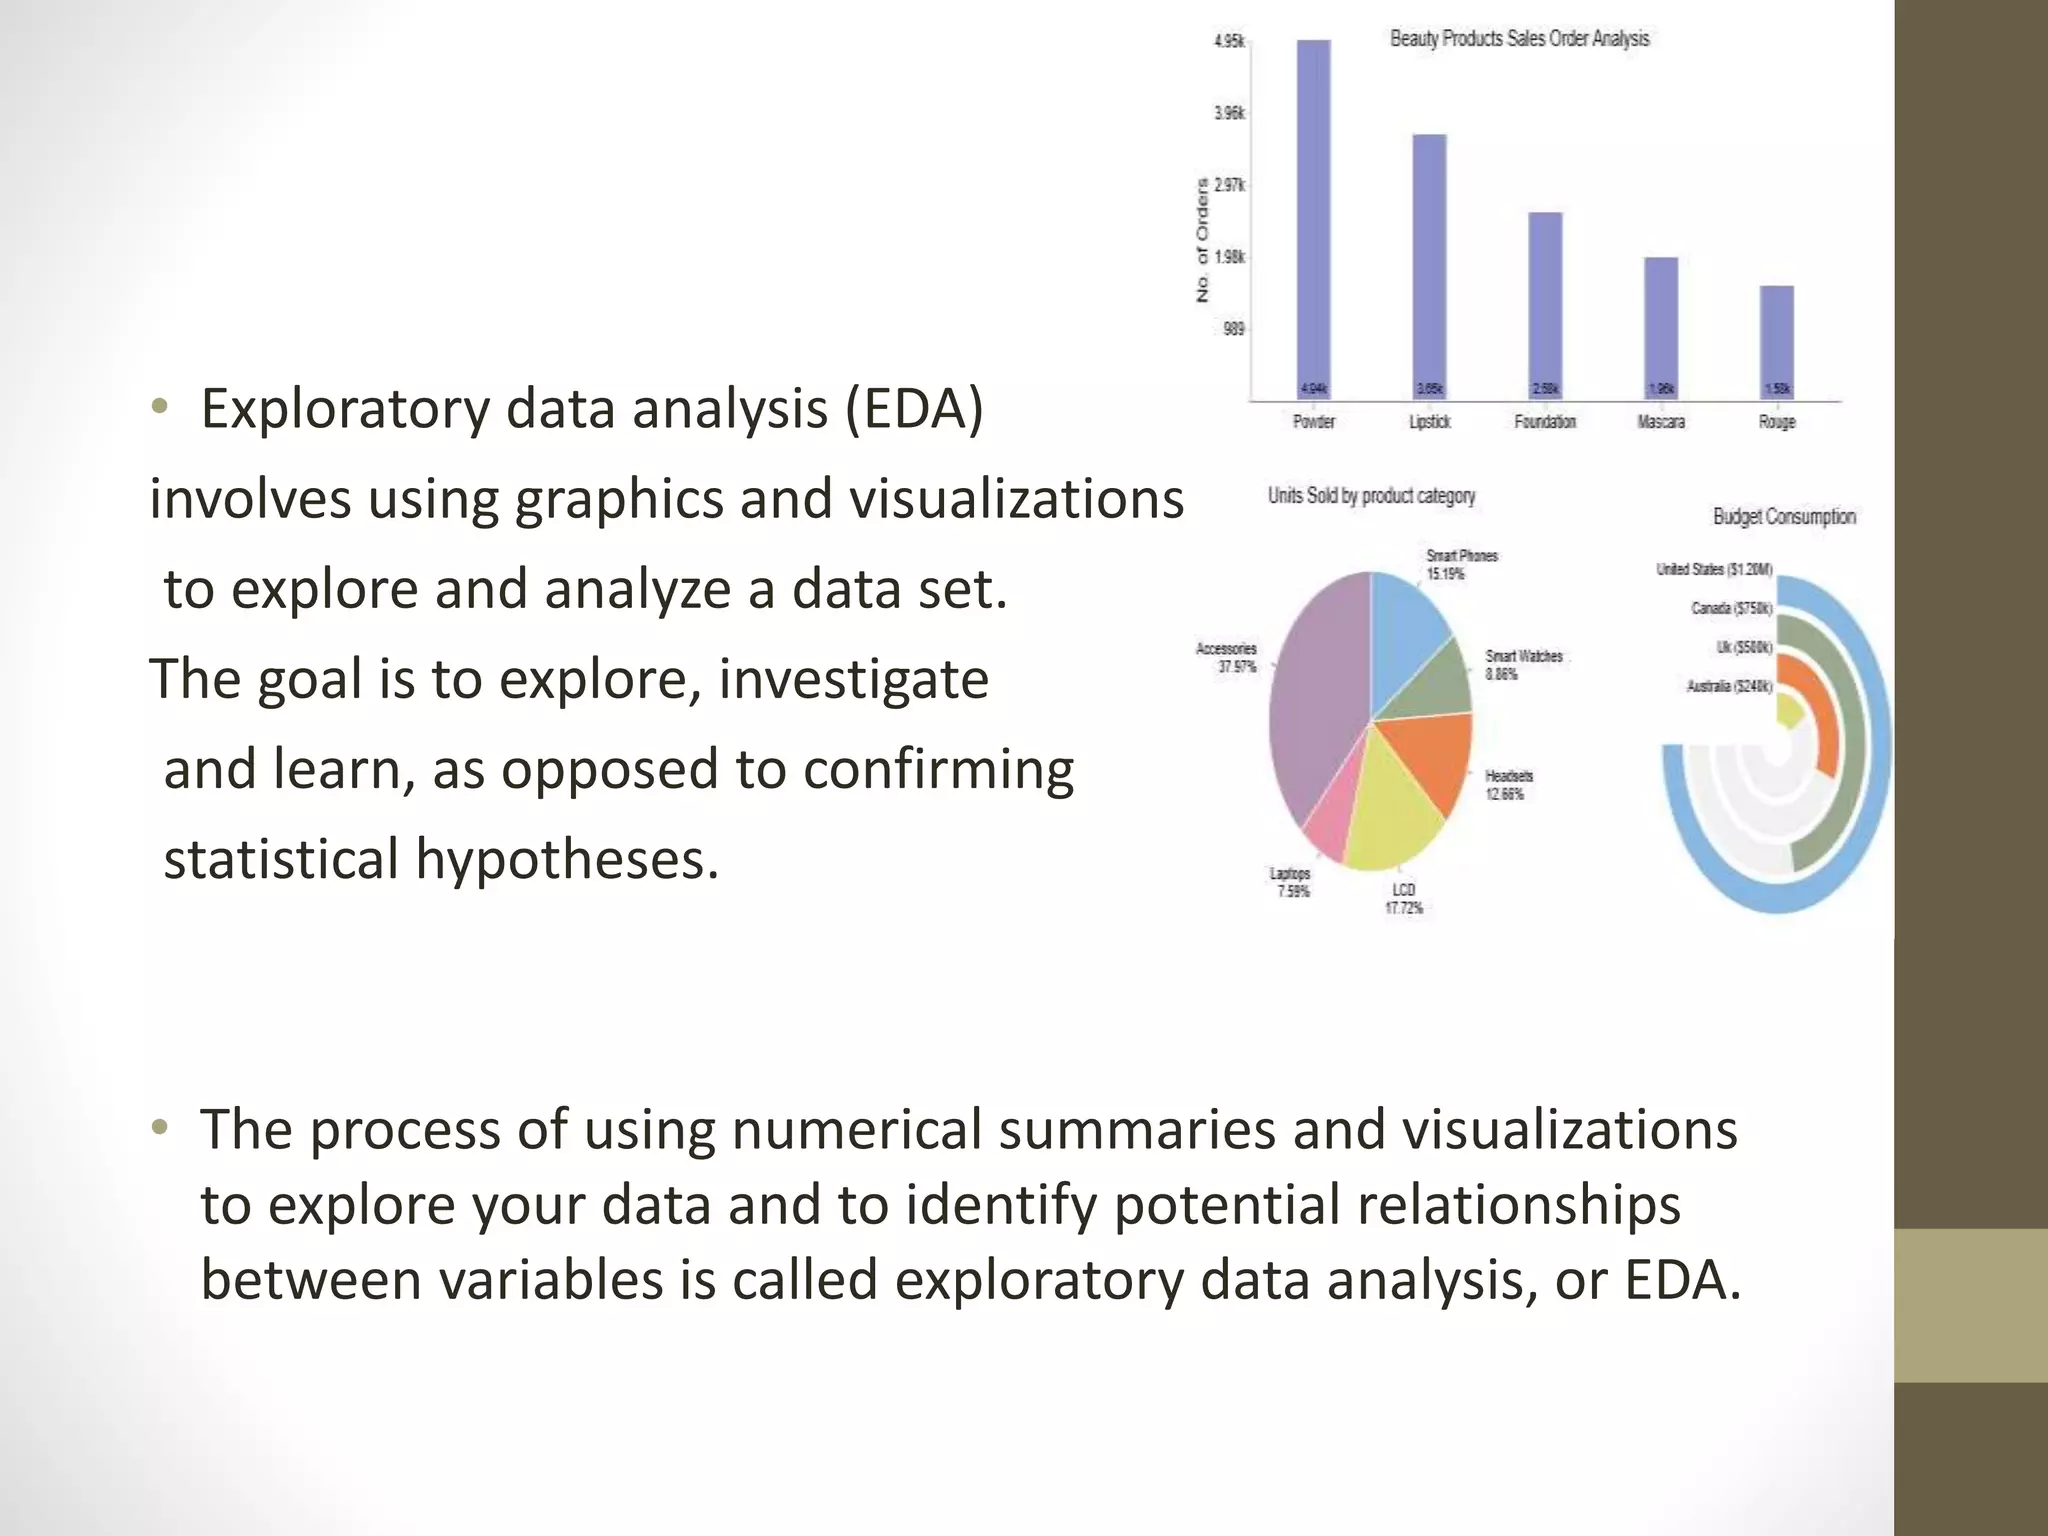
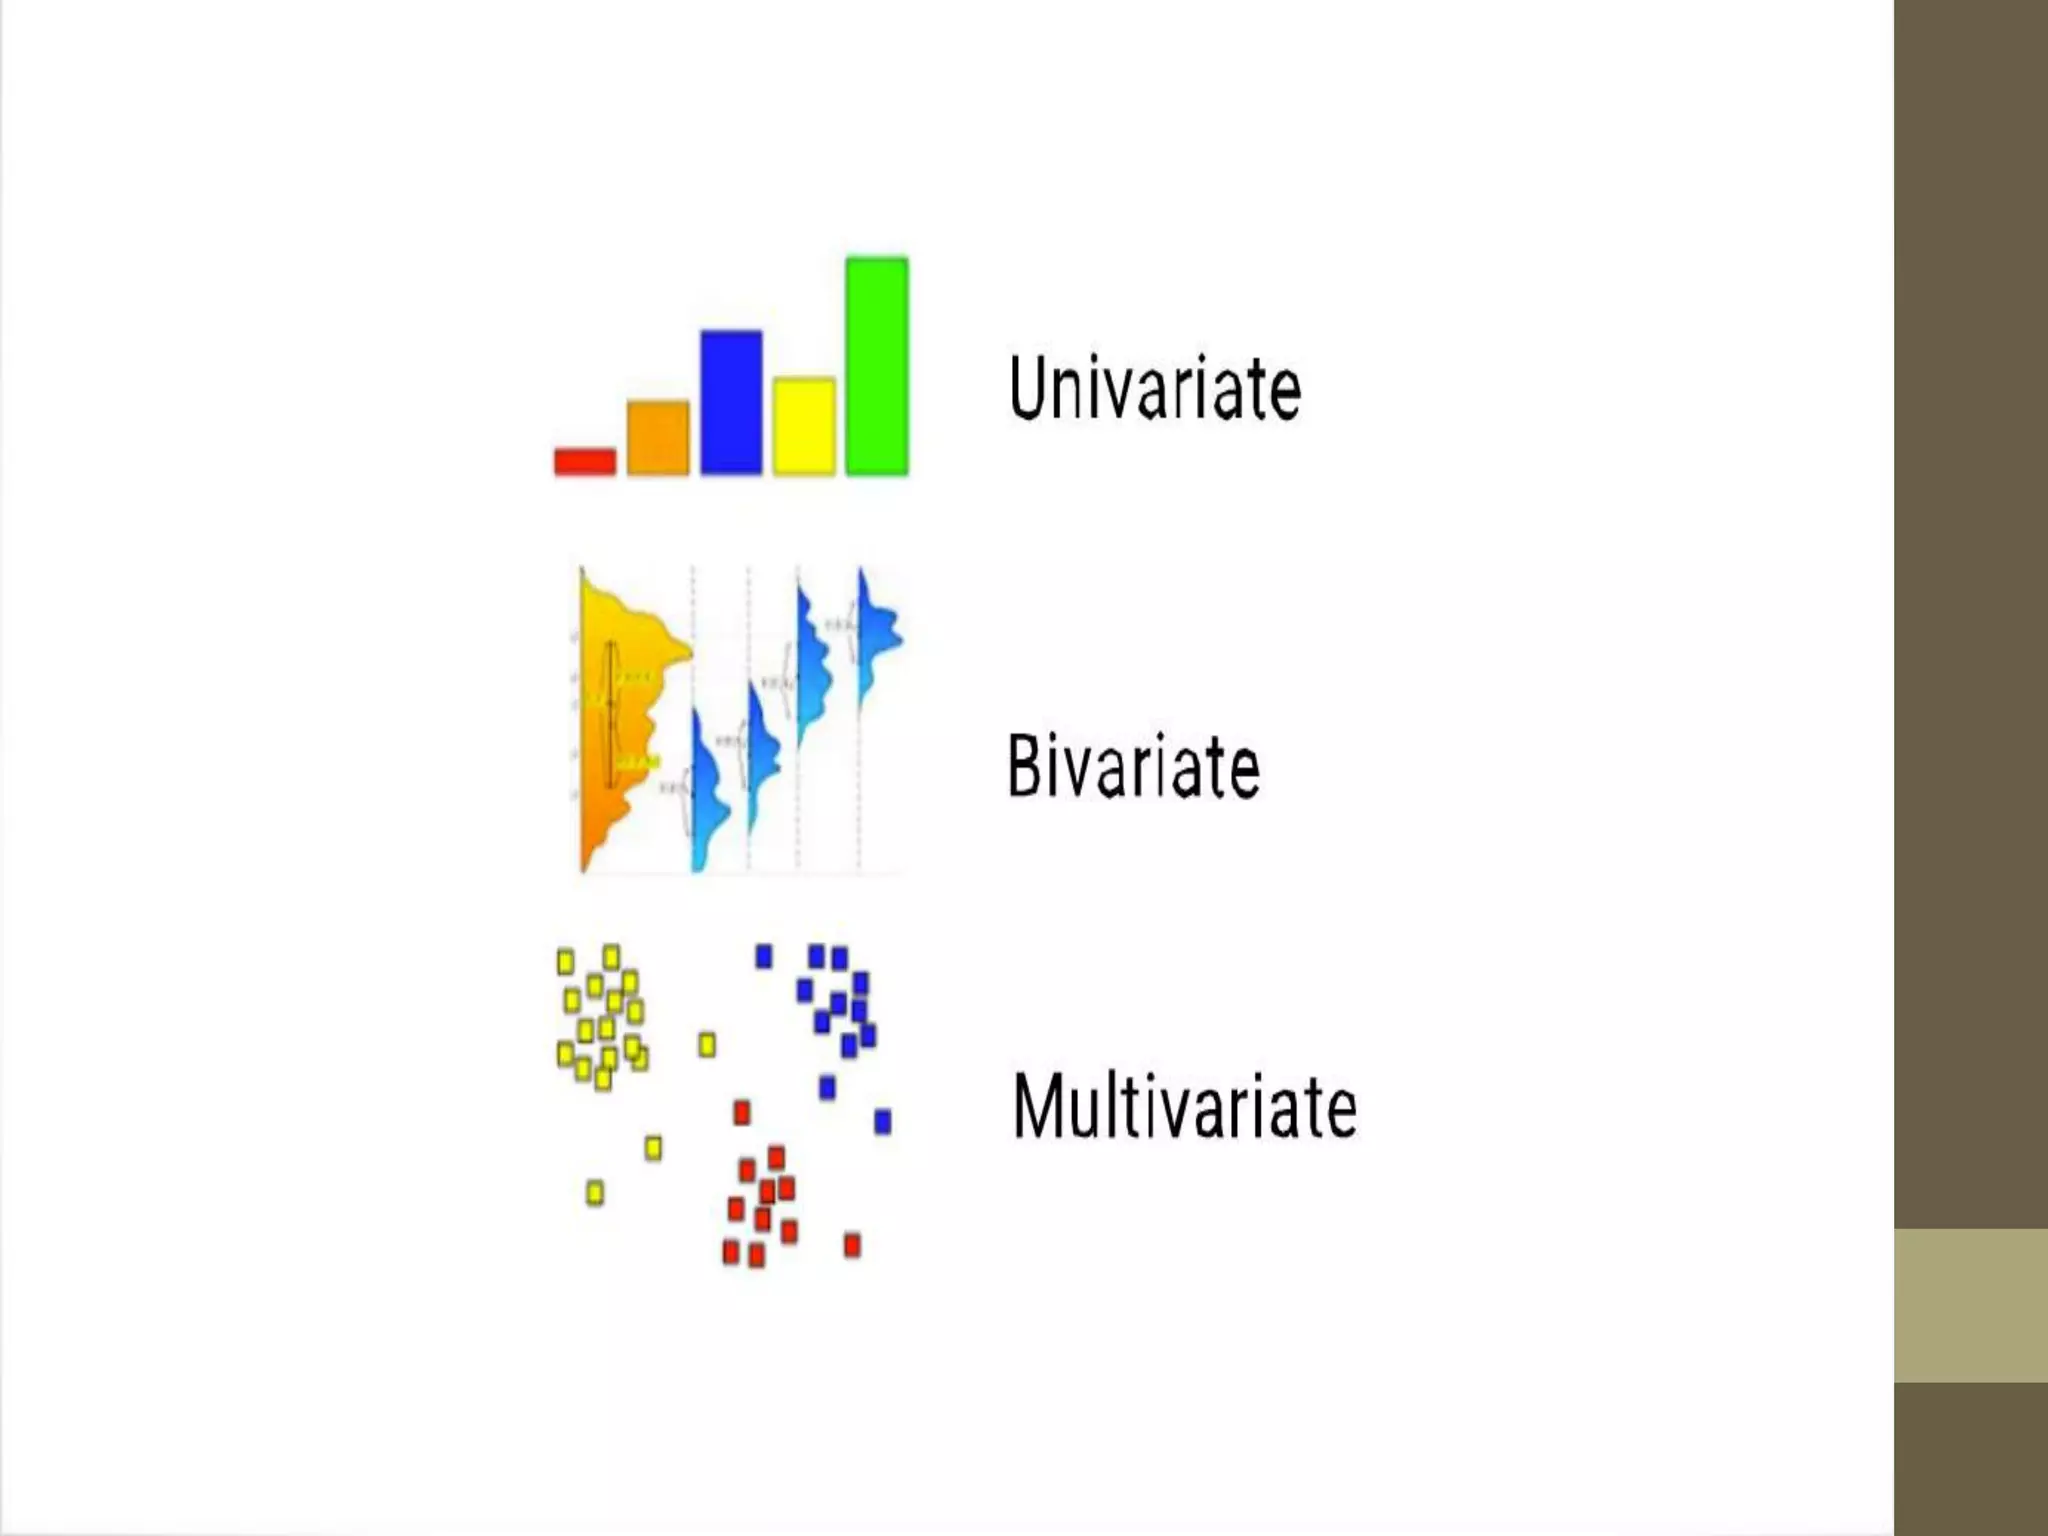
SlideShare a Scribd company logo
1 of 15
Exploratory Data
Analysis (EDA)
ZAHID RIAZ HAANS (LECTURER)
KAMYAB INSTIUTE OF MEDICAL SCIENCES KOT ADDU
E-mail. zahidriazhaans50@gmail.com
• Exploratory data analysis (EDA)
involves using graphics and visualizations
to explore and analyze a data set.
The goal is to explore, investigate
and learn, as opposed to confirming
statistical hypotheses.
• The process of using numerical summaries and visualizations
to explore your data and to identify potential relationships
between variables is called exploratory data analysis, or EDA.
• The distribution of variables in your data set. That is, what is
the shape of your data? Is the distribution skewed? Mound-
shaped? Bimodal?
• The relationships between variables.
• Whether or not your data have outliers or unusual points
that may indicate data quality issues or lead to interesting
insights.
• Whether or not your data have patterns over time.
Functions and Techniques
• Clustering and dimension reduction techniques, which help
create graphical displays of high-dimensional data containing
many variables.
• Univariate visualization of each field in the raw dataset, with
summary statistics.
• Bivariate visualizations and summary statistics that allow you
to assess the relationship between each variable in the
dataset and the target variable you’re looking at.
• Multivariate visualizations, for mapping and understanding
interactions between different fields in the data.
TYPES OF EXPLORATORY
DATA ANALYSIS:
• Univariate Non-graphical
• Multivariate Non-graphical
• Univariate graphical
• Multivariate graphical
1. Univariate Non-graphical:
• This is the simplest form of data analysis as during this we use
just one variable to research the info.
• The standard goal of univariate non-graphical EDA is to know
the underlying sample distribution/ data and make
observations about the population.
• Outlier detection is additionally part of the analysis. The
characteristics of population distribution include:
Types
• Central tendency: The central tendency or location of
distribution has got to do with typical or middle values. The
commonly useful measures of central tendency are statistics
called mean, median, and sometimes mode during
• Spread: Spread is an indicator of what proportion distant
from the middle we are to seek out the find the info values.
the quality deviation and variance are two useful measures of
spread.
• Skewness and kurtosis: Two more useful univariates
descriptors are the skewness and kurtosis of the distribution.
2. Multivariate Non-
graphical:
• Multivariate non-graphical EDA technique is usually wont to
show the connection between two or more variables within
the sort of either cross-tabulation or statistics.
• For categorical data, an extension of tabulation called cross-
tabulation is extremely useful. For 2 variables, cross-tabulation
is preferred by making a two-way table with column headings
that match the amount of one-variable and row headings that
match the amount of the opposite two variables, then filling
the counts with all subjects that share an equivalent pair of
levels.
3. Univariate graphical:
• Non-graphical methods are quantitative and objective, they
are not able to give the complete picture of the data;
therefore, graphical methods are used more as they involve a
degree of subjective analysis, also are required. Common sorts
of univariate graphics are:
• Histogram
• Stem-and-leaf plots
• Boxplots
• Quantile-normal plots
4 Multivariate graphical:
• Multivariate graphical data uses graphics to display
relationships between two or more sets of knowledge. The
sole one used commonly may be a grouped barplot with each
group representing one level of 1 of the variables
• Scatterplot:
• Run chart: It’s a line graph of data plotted over time.
• Heat map: It’s a graphical representation of data where
values are depicted by color.
• Multivariate chart: It’s a graphical representation of the
relationships between factors and response.
• Bubble chart: It’s a data visualization that displays multiple
circles (bubbles) in two-dimensional plot.
TOOLS REQUIRED FOR
EXPLORATORY DATA ANALYSIS:
• 1. R: An open-source programming language and free software
environment for statistical computing and graphics supported by the R
foundation for statistical computing. The R language is widely used
among statisticians in developing statistical observations and data
analysis.
• 2. Python: An interpreted, object-oriented programming language with
dynamic semantics. Its high level, built-in data structures, combined
with dynamic binding, make it very attractive for rapid application
development, also as to be used as a scripting or glue language to attach
existing components together. Python and EDA are often used together
to spot missing values in the data set, which is vital so you’ll decide the
way to handle missing values for machine learning.
• Apart from these functions described above, EDA can also:
• Perform k-means clustering: Perform k-means clustering: it’s an
unsupervised learning algorithm where the info points are assigned to
clusters, also referred to as k-groups, k-means clustering is usually
utilized in market segmentation, image compression, and pattern
recognition
Exploratory Data Analysis (EDA) .pptx

More Related Content

Similar to Exploratory Data Analysis (EDA) .pptx

Making abstract data visible
Making abstract data visibleMaking abstract data visible
Making abstract data visiblePriyanshi Jain
 
Exploring Data (1).pptx
Exploring Data (1).pptxExploring Data (1).pptx
Exploring Data (1).pptxgina458018
 
Chapter 12 Data Analysis Descriptive Methods and Index Numbers
Chapter 12 Data Analysis Descriptive Methods and Index NumbersChapter 12 Data Analysis Descriptive Methods and Index Numbers
Chapter 12 Data Analysis Descriptive Methods and Index NumbersInternational advisers
 
Unit 4 editing and coding (2)
Unit 4 editing and coding (2)Unit 4 editing and coding (2)
Unit 4 editing and coding (2)kalailakshmi
 
Data mining techniques unit 2
Data mining techniques unit 2Data mining techniques unit 2
Data mining techniques unit 2malathieswaran29
 
fundamentals of data science and analytics on descriptive analysis.pptx
fundamentals of data science and analytics on descriptive analysis.pptxfundamentals of data science and analytics on descriptive analysis.pptx
fundamentals of data science and analytics on descriptive analysis.pptxkumaragurusv
 
Visual Analytics in Big Data
Visual Analytics in Big DataVisual Analytics in Big Data
Visual Analytics in Big DataSaurabh Shanbhag
 
Graphicalrepresntationofdatausingstatisticaltools2019_210902_105156.pdf
Graphicalrepresntationofdatausingstatisticaltools2019_210902_105156.pdfGraphicalrepresntationofdatausingstatisticaltools2019_210902_105156.pdf
Graphicalrepresntationofdatausingstatisticaltools2019_210902_105156.pdfHimakshi7
 
CSUN 2020 Accessible Visualizations: Maps, Annotations, and Spark lines
CSUN 2020 Accessible Visualizations: Maps, Annotations, and Spark linesCSUN 2020 Accessible Visualizations: Maps, Annotations, and Spark lines
CSUN 2020 Accessible Visualizations: Maps, Annotations, and Spark linesTed Gies
 
Quality Tools & Techniques Presentation.pptx
Quality Tools & Techniques Presentation.pptxQuality Tools & Techniques Presentation.pptx
Quality Tools & Techniques Presentation.pptxSAJIDAli83655
 
EXPLORATORY DATA ANALYSIS IN STATISTICAL MODeLING.pptx
EXPLORATORY DATA ANALYSIS IN STATISTICAL MODeLING.pptxEXPLORATORY DATA ANALYSIS IN STATISTICAL MODeLING.pptx
EXPLORATORY DATA ANALYSIS IN STATISTICAL MODeLING.pptxrakeshreghu98
 
ch 2 Tools of Research.docx
ch 2 Tools of Research.docxch 2 Tools of Research.docx
ch 2 Tools of Research.docxssuserf200491
 

Similar to Exploratory Data Analysis (EDA) .pptx (20)

Data Science 1.pdf
Data Science 1.pdfData Science 1.pdf
Data Science 1.pdf
 
Data Visualization.pptx
Data Visualization.pptxData Visualization.pptx
Data Visualization.pptx
 
Making abstract data visible
Making abstract data visibleMaking abstract data visible
Making abstract data visible
 
Exploring Data (1).pptx
Exploring Data (1).pptxExploring Data (1).pptx
Exploring Data (1).pptx
 
Lec 3.pptx
Lec 3.pptxLec 3.pptx
Lec 3.pptx
 
Chapter 12 Data Analysis Descriptive Methods and Index Numbers
Chapter 12 Data Analysis Descriptive Methods and Index NumbersChapter 12 Data Analysis Descriptive Methods and Index Numbers
Chapter 12 Data Analysis Descriptive Methods and Index Numbers
 
Unit 4 editing and coding (2)
Unit 4 editing and coding (2)Unit 4 editing and coding (2)
Unit 4 editing and coding (2)
 
Data mining techniques unit 2
Data mining techniques unit 2Data mining techniques unit 2
Data mining techniques unit 2
 
Unit III.pptx
Unit III.pptxUnit III.pptx
Unit III.pptx
 
fundamentals of data science and analytics on descriptive analysis.pptx
fundamentals of data science and analytics on descriptive analysis.pptxfundamentals of data science and analytics on descriptive analysis.pptx
fundamentals of data science and analytics on descriptive analysis.pptx
 
Visual Analytics in Big Data
Visual Analytics in Big DataVisual Analytics in Big Data
Visual Analytics in Big Data
 
Graphicalrepresntationofdatausingstatisticaltools2019_210902_105156.pdf
Graphicalrepresntationofdatausingstatisticaltools2019_210902_105156.pdfGraphicalrepresntationofdatausingstatisticaltools2019_210902_105156.pdf
Graphicalrepresntationofdatausingstatisticaltools2019_210902_105156.pdf
 
EDA.pptx
EDA.pptxEDA.pptx
EDA.pptx
 
CSUN 2020 Accessible Visualizations: Maps, Annotations, and Spark lines
CSUN 2020 Accessible Visualizations: Maps, Annotations, and Spark linesCSUN 2020 Accessible Visualizations: Maps, Annotations, and Spark lines
CSUN 2020 Accessible Visualizations: Maps, Annotations, and Spark lines
 
Introduction to Descriptive Statistics
Introduction to Descriptive StatisticsIntroduction to Descriptive Statistics
Introduction to Descriptive Statistics
 
Quality Tools & Techniques Presentation.pptx
Quality Tools & Techniques Presentation.pptxQuality Tools & Techniques Presentation.pptx
Quality Tools & Techniques Presentation.pptx
 
EXPLORATORY DATA ANALYSIS IN STATISTICAL MODeLING.pptx
EXPLORATORY DATA ANALYSIS IN STATISTICAL MODeLING.pptxEXPLORATORY DATA ANALYSIS IN STATISTICAL MODeLING.pptx
EXPLORATORY DATA ANALYSIS IN STATISTICAL MODeLING.pptx
 
Quantitative research
Quantitative researchQuantitative research
Quantitative research
 
Data Visulalization
Data VisulalizationData Visulalization
Data Visulalization
 
ch 2 Tools of Research.docx
ch 2 Tools of Research.docxch 2 Tools of Research.docx
ch 2 Tools of Research.docx
 

Recently uploaded

Q4-W6-Restating Informational Text Grade 3
Q4-W6-Restating Informational Text Grade 3Q4-W6-Restating Informational Text Grade 3
Q4-W6-Restating Informational Text Grade 3JemimahLaneBuaron
 
Presentation by Andreas Schleicher Tackling the School Absenteeism Crisis 30 ...
Presentation by Andreas Schleicher Tackling the School Absenteeism Crisis 30 ...Presentation by Andreas Schleicher Tackling the School Absenteeism Crisis 30 ...
Presentation by Andreas Schleicher Tackling the School Absenteeism Crisis 30 ...EduSkills OECD
 
Interactive Powerpoint_How to Master effective communication
Interactive Powerpoint_How to Master effective communicationInteractive Powerpoint_How to Master effective communication
Interactive Powerpoint_How to Master effective communicationnomboosow
 
Kisan Call Centre - To harness potential of ICT in Agriculture by answer farm...
Kisan Call Centre - To harness potential of ICT in Agriculture by answer farm...Kisan Call Centre - To harness potential of ICT in Agriculture by answer farm...
Kisan Call Centre - To harness potential of ICT in Agriculture by answer farm...Krashi Coaching
 
Software Engineering Methodologies (overview)
Software Engineering Methodologies (overview)Software Engineering Methodologies (overview)
Software Engineering Methodologies (overview)eniolaolutunde
 
Beyond the EU: DORA and NIS 2 Directive's Global Impact
Beyond the EU: DORA and NIS 2 Directive's Global ImpactBeyond the EU: DORA and NIS 2 Directive's Global Impact
Beyond the EU: DORA and NIS 2 Directive's Global ImpactPECB
 
1029-Danh muc Sach Giao Khoa khoi 6.pdf
1029-Danh muc Sach Giao Khoa khoi  6.pdf1029-Danh muc Sach Giao Khoa khoi  6.pdf
1029-Danh muc Sach Giao Khoa khoi 6.pdfQucHHunhnh
 
SOCIAL AND HISTORICAL CONTEXT - LFTVD.pptx
SOCIAL AND HISTORICAL CONTEXT - LFTVD.pptxSOCIAL AND HISTORICAL CONTEXT - LFTVD.pptx
SOCIAL AND HISTORICAL CONTEXT - LFTVD.pptxiammrhaywood
 
Hybridoma Technology ( Production , Purification , and Application )
Hybridoma Technology  ( Production , Purification , and Application  ) Hybridoma Technology  ( Production , Purification , and Application  )
Hybridoma Technology ( Production , Purification , and Application ) Sakshi Ghasle
 
The Most Excellent Way | 1 Corinthians 13
The Most Excellent Way | 1 Corinthians 13The Most Excellent Way | 1 Corinthians 13
The Most Excellent Way | 1 Corinthians 13Steve Thomason
 
Industrial Policy - 1948, 1956, 1973, 1977, 1980, 1991
Industrial Policy - 1948, 1956, 1973, 1977, 1980, 1991Industrial Policy - 1948, 1956, 1973, 1977, 1980, 1991
Industrial Policy - 1948, 1956, 1973, 1977, 1980, 1991RKavithamani
 
Sanyam Choudhary Chemistry practical.pdf
Sanyam Choudhary Chemistry practical.pdfSanyam Choudhary Chemistry practical.pdf
Sanyam Choudhary Chemistry practical.pdfsanyamsingh5019
 
Z Score,T Score, Percential Rank and Box Plot Graph
Z Score,T Score, Percential Rank and Box Plot GraphZ Score,T Score, Percential Rank and Box Plot Graph
Z Score,T Score, Percential Rank and Box Plot GraphThiyagu K
 
Privatization and Disinvestment - Meaning, Objectives, Advantages and Disadva...
Privatization and Disinvestment - Meaning, Objectives, Advantages and Disadva...Privatization and Disinvestment - Meaning, Objectives, Advantages and Disadva...
Privatization and Disinvestment - Meaning, Objectives, Advantages and Disadva...RKavithamani
 
Accessible design: Minimum effort, maximum impact
Accessible design: Minimum effort, maximum impactAccessible design: Minimum effort, maximum impact
Accessible design: Minimum effort, maximum impactdawncurless
 
Contemporary philippine arts from the regions_PPT_Module_12 [Autosaved] (1).pptx
Contemporary philippine arts from the regions_PPT_Module_12 [Autosaved] (1).pptxContemporary philippine arts from the regions_PPT_Module_12 [Autosaved] (1).pptx
Contemporary philippine arts from the regions_PPT_Module_12 [Autosaved] (1).pptxRoyAbrique
 
Call Girls in Dwarka Mor Delhi Contact Us 9654467111
Call Girls in Dwarka Mor Delhi Contact Us 9654467111Call Girls in Dwarka Mor Delhi Contact Us 9654467111
Call Girls in Dwarka Mor Delhi Contact Us 9654467111Sapana Sha
 
CARE OF CHILD IN INCUBATOR..........pptx
CARE OF CHILD IN INCUBATOR..........pptxCARE OF CHILD IN INCUBATOR..........pptx
CARE OF CHILD IN INCUBATOR..........pptxGaneshChakor2
 

Recently uploaded (20)

Q4-W6-Restating Informational Text Grade 3
Q4-W6-Restating Informational Text Grade 3Q4-W6-Restating Informational Text Grade 3
Q4-W6-Restating Informational Text Grade 3
 
Presentation by Andreas Schleicher Tackling the School Absenteeism Crisis 30 ...
Presentation by Andreas Schleicher Tackling the School Absenteeism Crisis 30 ...Presentation by Andreas Schleicher Tackling the School Absenteeism Crisis 30 ...
Presentation by Andreas Schleicher Tackling the School Absenteeism Crisis 30 ...
 
Interactive Powerpoint_How to Master effective communication
Interactive Powerpoint_How to Master effective communicationInteractive Powerpoint_How to Master effective communication
Interactive Powerpoint_How to Master effective communication
 
Kisan Call Centre - To harness potential of ICT in Agriculture by answer farm...
Kisan Call Centre - To harness potential of ICT in Agriculture by answer farm...Kisan Call Centre - To harness potential of ICT in Agriculture by answer farm...
Kisan Call Centre - To harness potential of ICT in Agriculture by answer farm...
 
Software Engineering Methodologies (overview)
Software Engineering Methodologies (overview)Software Engineering Methodologies (overview)
Software Engineering Methodologies (overview)
 
Beyond the EU: DORA and NIS 2 Directive's Global Impact
Beyond the EU: DORA and NIS 2 Directive's Global ImpactBeyond the EU: DORA and NIS 2 Directive's Global Impact
Beyond the EU: DORA and NIS 2 Directive's Global Impact
 
1029-Danh muc Sach Giao Khoa khoi 6.pdf
1029-Danh muc Sach Giao Khoa khoi  6.pdf1029-Danh muc Sach Giao Khoa khoi  6.pdf
1029-Danh muc Sach Giao Khoa khoi 6.pdf
 
SOCIAL AND HISTORICAL CONTEXT - LFTVD.pptx
SOCIAL AND HISTORICAL CONTEXT - LFTVD.pptxSOCIAL AND HISTORICAL CONTEXT - LFTVD.pptx
SOCIAL AND HISTORICAL CONTEXT - LFTVD.pptx
 
Hybridoma Technology ( Production , Purification , and Application )
Hybridoma Technology  ( Production , Purification , and Application  ) Hybridoma Technology  ( Production , Purification , and Application  )
Hybridoma Technology ( Production , Purification , and Application )
 
The Most Excellent Way | 1 Corinthians 13
The Most Excellent Way | 1 Corinthians 13The Most Excellent Way | 1 Corinthians 13
The Most Excellent Way | 1 Corinthians 13
 
Código Creativo y Arte de Software | Unidad 1
Código Creativo y Arte de Software | Unidad 1Código Creativo y Arte de Software | Unidad 1
Código Creativo y Arte de Software | Unidad 1
 
Industrial Policy - 1948, 1956, 1973, 1977, 1980, 1991
Industrial Policy - 1948, 1956, 1973, 1977, 1980, 1991Industrial Policy - 1948, 1956, 1973, 1977, 1980, 1991
Industrial Policy - 1948, 1956, 1973, 1977, 1980, 1991
 
Sanyam Choudhary Chemistry practical.pdf
Sanyam Choudhary Chemistry practical.pdfSanyam Choudhary Chemistry practical.pdf
Sanyam Choudhary Chemistry practical.pdf
 
Z Score,T Score, Percential Rank and Box Plot Graph
Z Score,T Score, Percential Rank and Box Plot GraphZ Score,T Score, Percential Rank and Box Plot Graph
Z Score,T Score, Percential Rank and Box Plot Graph
 
Privatization and Disinvestment - Meaning, Objectives, Advantages and Disadva...
Privatization and Disinvestment - Meaning, Objectives, Advantages and Disadva...Privatization and Disinvestment - Meaning, Objectives, Advantages and Disadva...
Privatization and Disinvestment - Meaning, Objectives, Advantages and Disadva...
 
Accessible design: Minimum effort, maximum impact
Accessible design: Minimum effort, maximum impactAccessible design: Minimum effort, maximum impact
Accessible design: Minimum effort, maximum impact
 
Contemporary philippine arts from the regions_PPT_Module_12 [Autosaved] (1).pptx
Contemporary philippine arts from the regions_PPT_Module_12 [Autosaved] (1).pptxContemporary philippine arts from the regions_PPT_Module_12 [Autosaved] (1).pptx
Contemporary philippine arts from the regions_PPT_Module_12 [Autosaved] (1).pptx
 
Call Girls in Dwarka Mor Delhi Contact Us 9654467111
Call Girls in Dwarka Mor Delhi Contact Us 9654467111Call Girls in Dwarka Mor Delhi Contact Us 9654467111
Call Girls in Dwarka Mor Delhi Contact Us 9654467111
 
Mattingly "AI & Prompt Design: The Basics of Prompt Design"
Mattingly "AI & Prompt Design: The Basics of Prompt Design"Mattingly "AI & Prompt Design: The Basics of Prompt Design"
Mattingly "AI & Prompt Design: The Basics of Prompt Design"
 
CARE OF CHILD IN INCUBATOR..........pptx
CARE OF CHILD IN INCUBATOR..........pptxCARE OF CHILD IN INCUBATOR..........pptx
CARE OF CHILD IN INCUBATOR..........pptx
 

Exploratory Data Analysis (EDA) .pptx

  • 1. Exploratory Data Analysis (EDA) ZAHID RIAZ HAANS (LECTURER) KAMYAB INSTIUTE OF MEDICAL SCIENCES KOT ADDU E-mail. zahidriazhaans50@gmail.com
  • 2. • Exploratory data analysis (EDA) involves using graphics and visualizations to explore and analyze a data set. The goal is to explore, investigate and learn, as opposed to confirming statistical hypotheses. • The process of using numerical summaries and visualizations to explore your data and to identify potential relationships between variables is called exploratory data analysis, or EDA.
  • 3. • The distribution of variables in your data set. That is, what is the shape of your data? Is the distribution skewed? Mound- shaped? Bimodal? • The relationships between variables. • Whether or not your data have outliers or unusual points that may indicate data quality issues or lead to interesting insights. • Whether or not your data have patterns over time.
  • 4. Functions and Techniques • Clustering and dimension reduction techniques, which help create graphical displays of high-dimensional data containing many variables. • Univariate visualization of each field in the raw dataset, with summary statistics. • Bivariate visualizations and summary statistics that allow you to assess the relationship between each variable in the dataset and the target variable you’re looking at. • Multivariate visualizations, for mapping and understanding interactions between different fields in the data.
  • 5.
  • 6.
  • 7. TYPES OF EXPLORATORY DATA ANALYSIS: • Univariate Non-graphical • Multivariate Non-graphical • Univariate graphical • Multivariate graphical
  • 8. 1. Univariate Non-graphical: • This is the simplest form of data analysis as during this we use just one variable to research the info. • The standard goal of univariate non-graphical EDA is to know the underlying sample distribution/ data and make observations about the population. • Outlier detection is additionally part of the analysis. The characteristics of population distribution include:
  • 9. Types • Central tendency: The central tendency or location of distribution has got to do with typical or middle values. The commonly useful measures of central tendency are statistics called mean, median, and sometimes mode during • Spread: Spread is an indicator of what proportion distant from the middle we are to seek out the find the info values. the quality deviation and variance are two useful measures of spread. • Skewness and kurtosis: Two more useful univariates descriptors are the skewness and kurtosis of the distribution.
  • 10. 2. Multivariate Non- graphical: • Multivariate non-graphical EDA technique is usually wont to show the connection between two or more variables within the sort of either cross-tabulation or statistics. • For categorical data, an extension of tabulation called cross- tabulation is extremely useful. For 2 variables, cross-tabulation is preferred by making a two-way table with column headings that match the amount of one-variable and row headings that match the amount of the opposite two variables, then filling the counts with all subjects that share an equivalent pair of levels.
  • 11. 3. Univariate graphical: • Non-graphical methods are quantitative and objective, they are not able to give the complete picture of the data; therefore, graphical methods are used more as they involve a degree of subjective analysis, also are required. Common sorts of univariate graphics are: • Histogram • Stem-and-leaf plots • Boxplots • Quantile-normal plots
  • 12. 4 Multivariate graphical: • Multivariate graphical data uses graphics to display relationships between two or more sets of knowledge. The sole one used commonly may be a grouped barplot with each group representing one level of 1 of the variables • Scatterplot: • Run chart: It’s a line graph of data plotted over time. • Heat map: It’s a graphical representation of data where values are depicted by color. • Multivariate chart: It’s a graphical representation of the relationships between factors and response. • Bubble chart: It’s a data visualization that displays multiple circles (bubbles) in two-dimensional plot.
  • 13. TOOLS REQUIRED FOR EXPLORATORY DATA ANALYSIS: • 1. R: An open-source programming language and free software environment for statistical computing and graphics supported by the R foundation for statistical computing. The R language is widely used among statisticians in developing statistical observations and data analysis. • 2. Python: An interpreted, object-oriented programming language with dynamic semantics. Its high level, built-in data structures, combined with dynamic binding, make it very attractive for rapid application development, also as to be used as a scripting or glue language to attach existing components together. Python and EDA are often used together to spot missing values in the data set, which is vital so you’ll decide the way to handle missing values for machine learning. • Apart from these functions described above, EDA can also: • Perform k-means clustering: Perform k-means clustering: it’s an unsupervised learning algorithm where the info points are assigned to clusters, also referred to as k-groups, k-means clustering is usually utilized in market segmentation, image compression, and pattern recognition