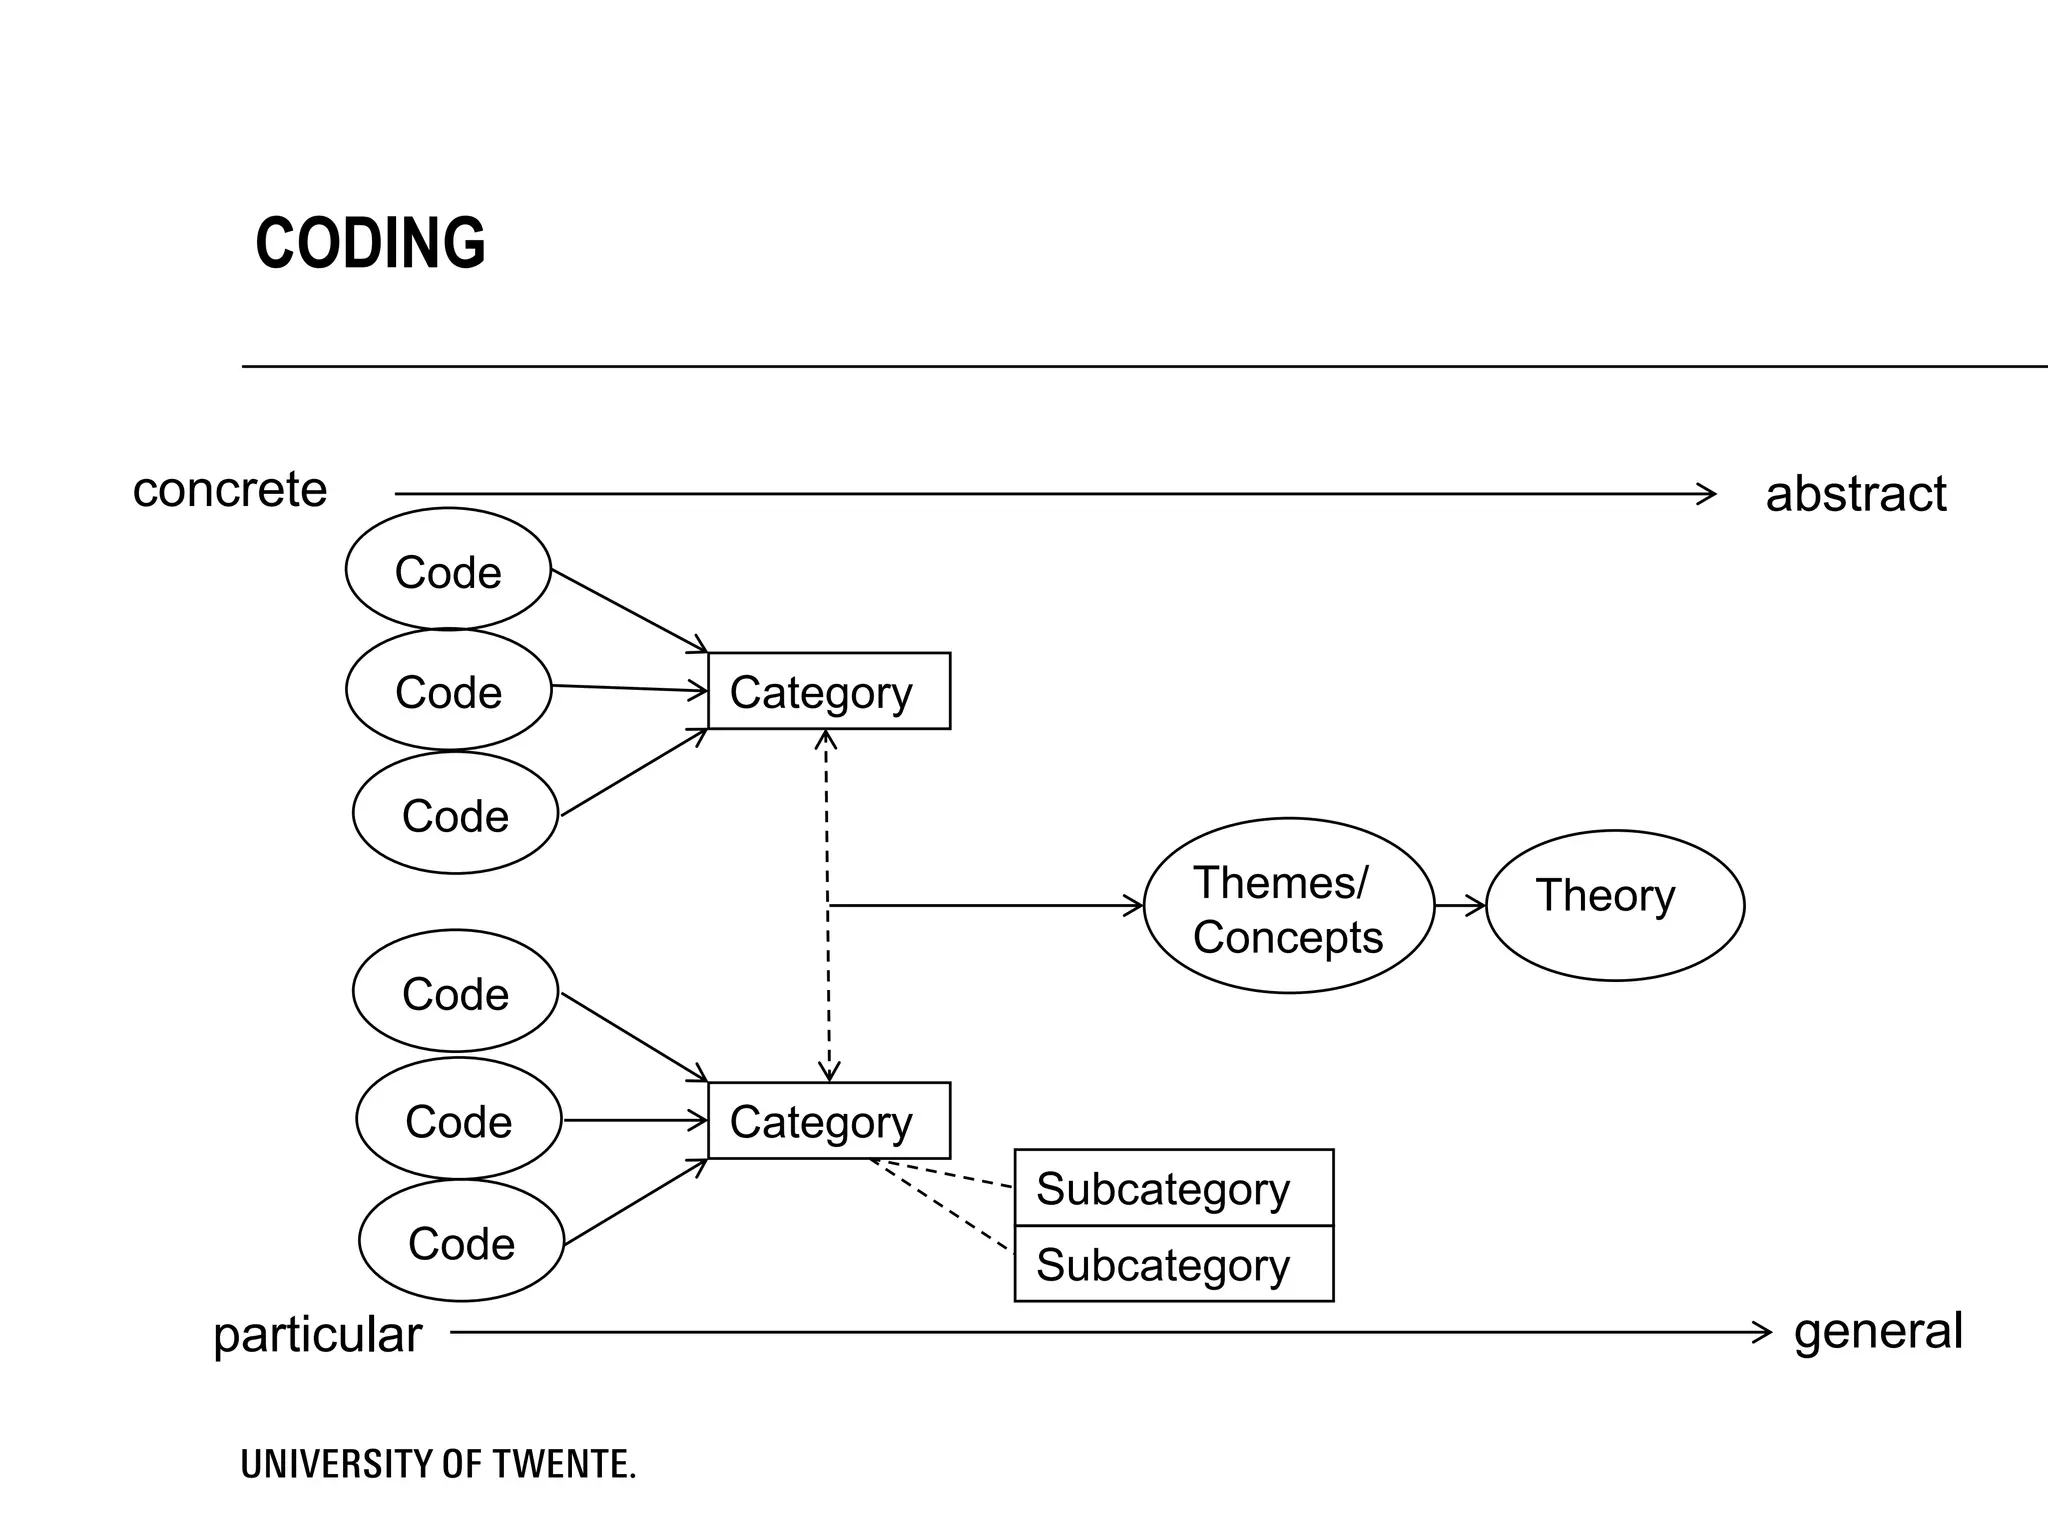
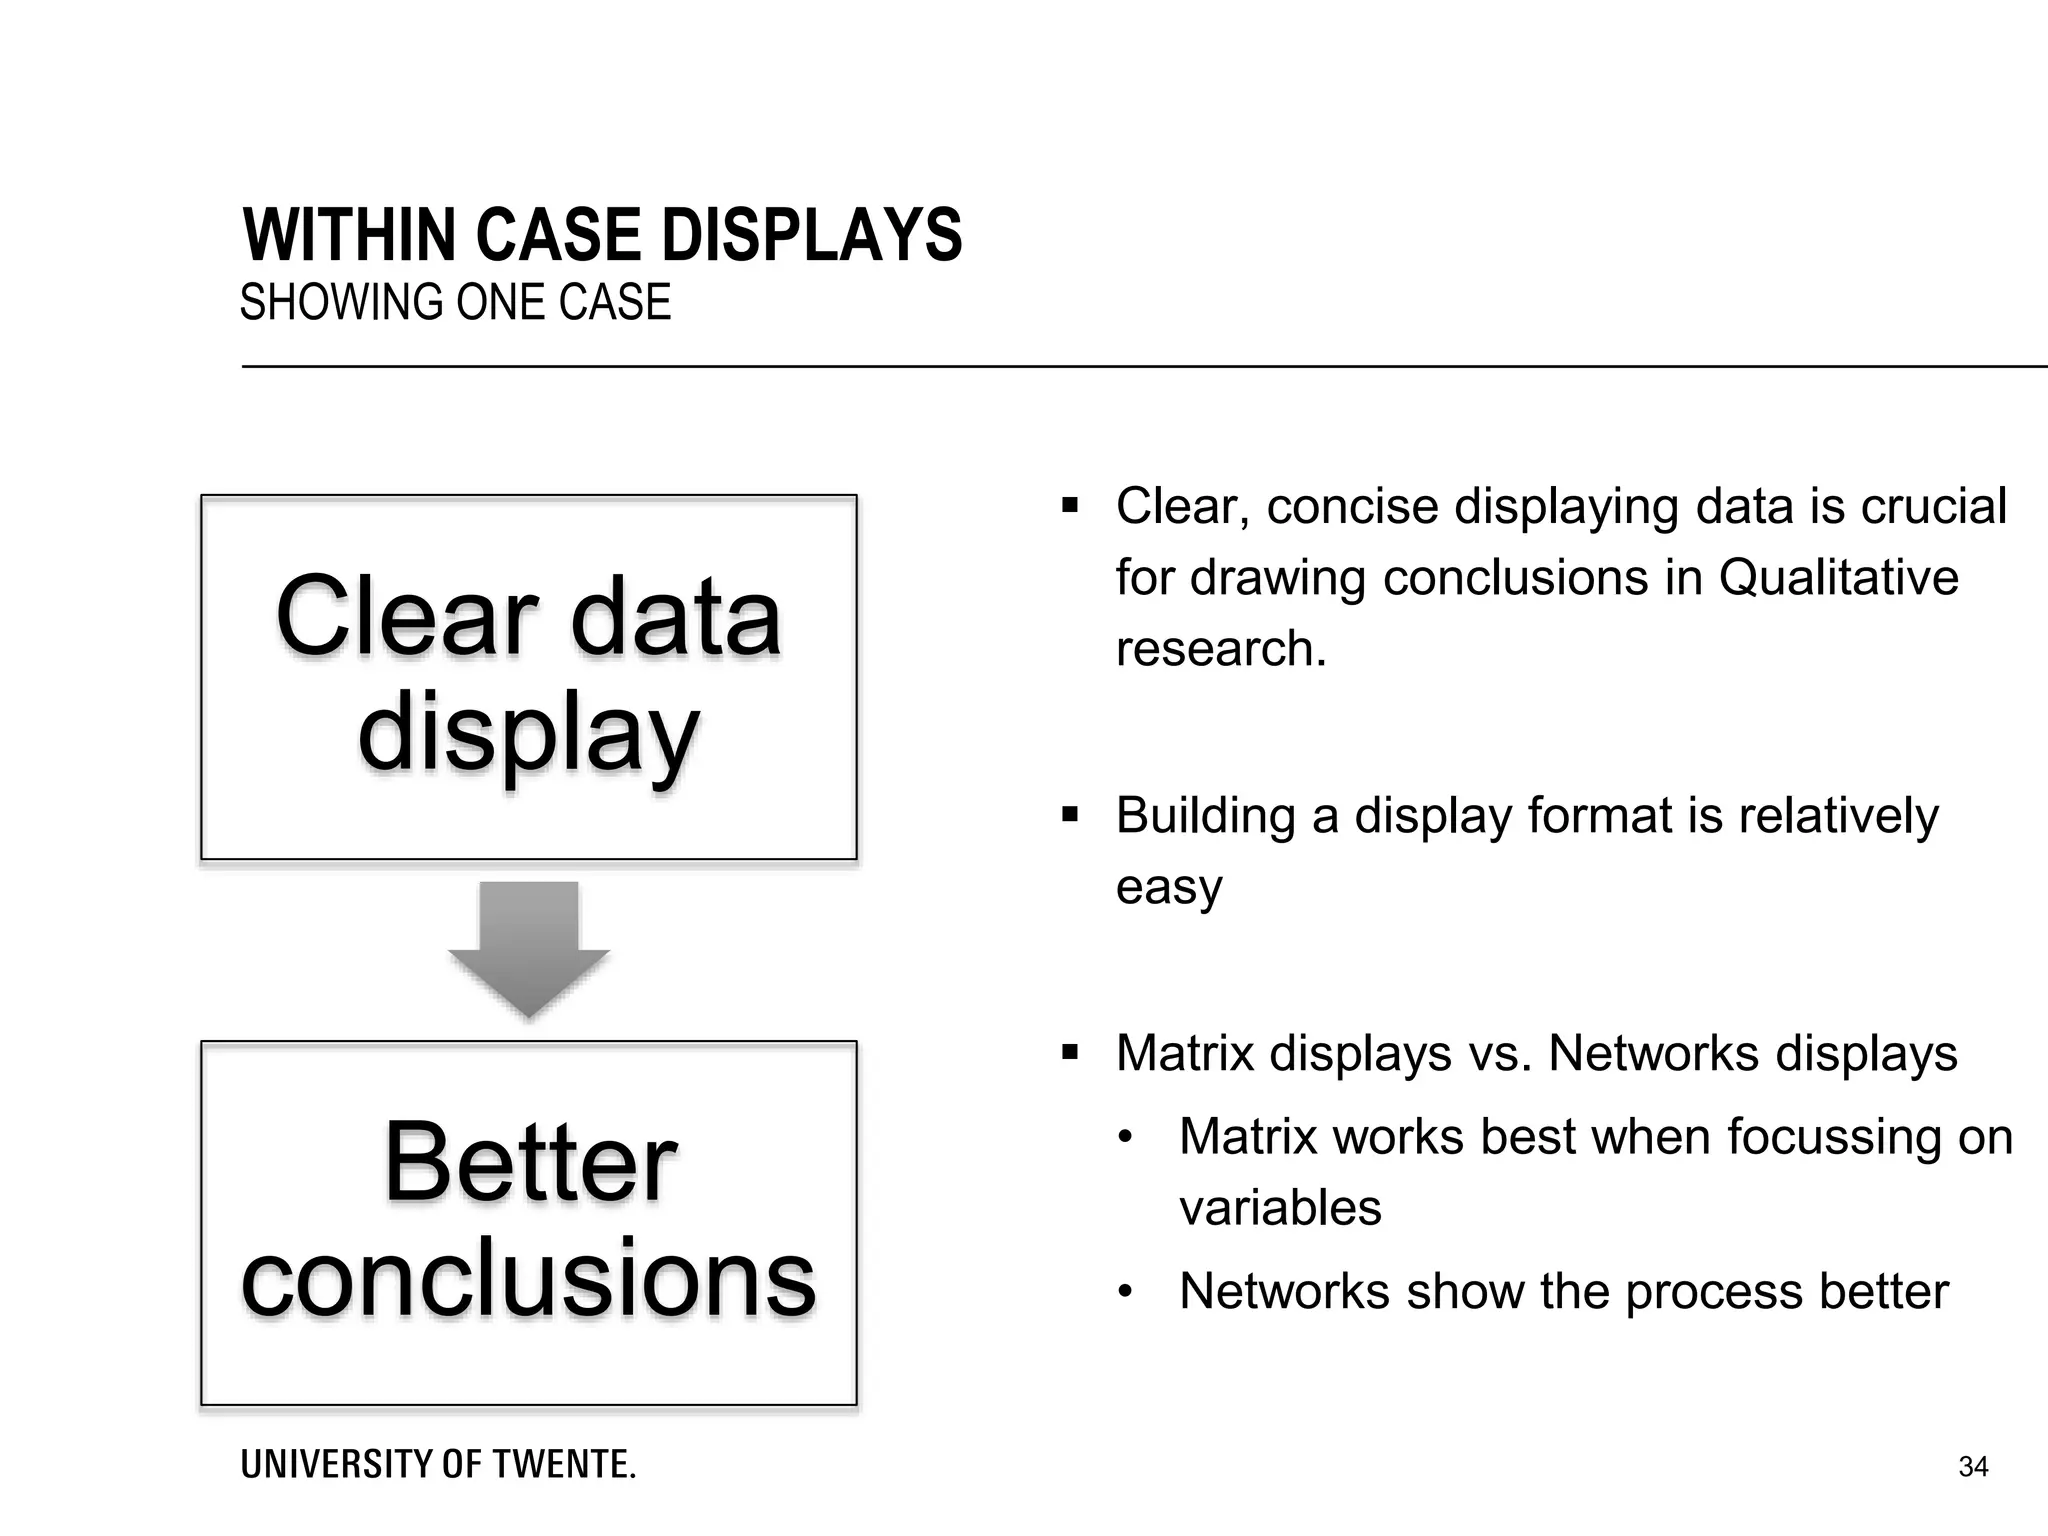
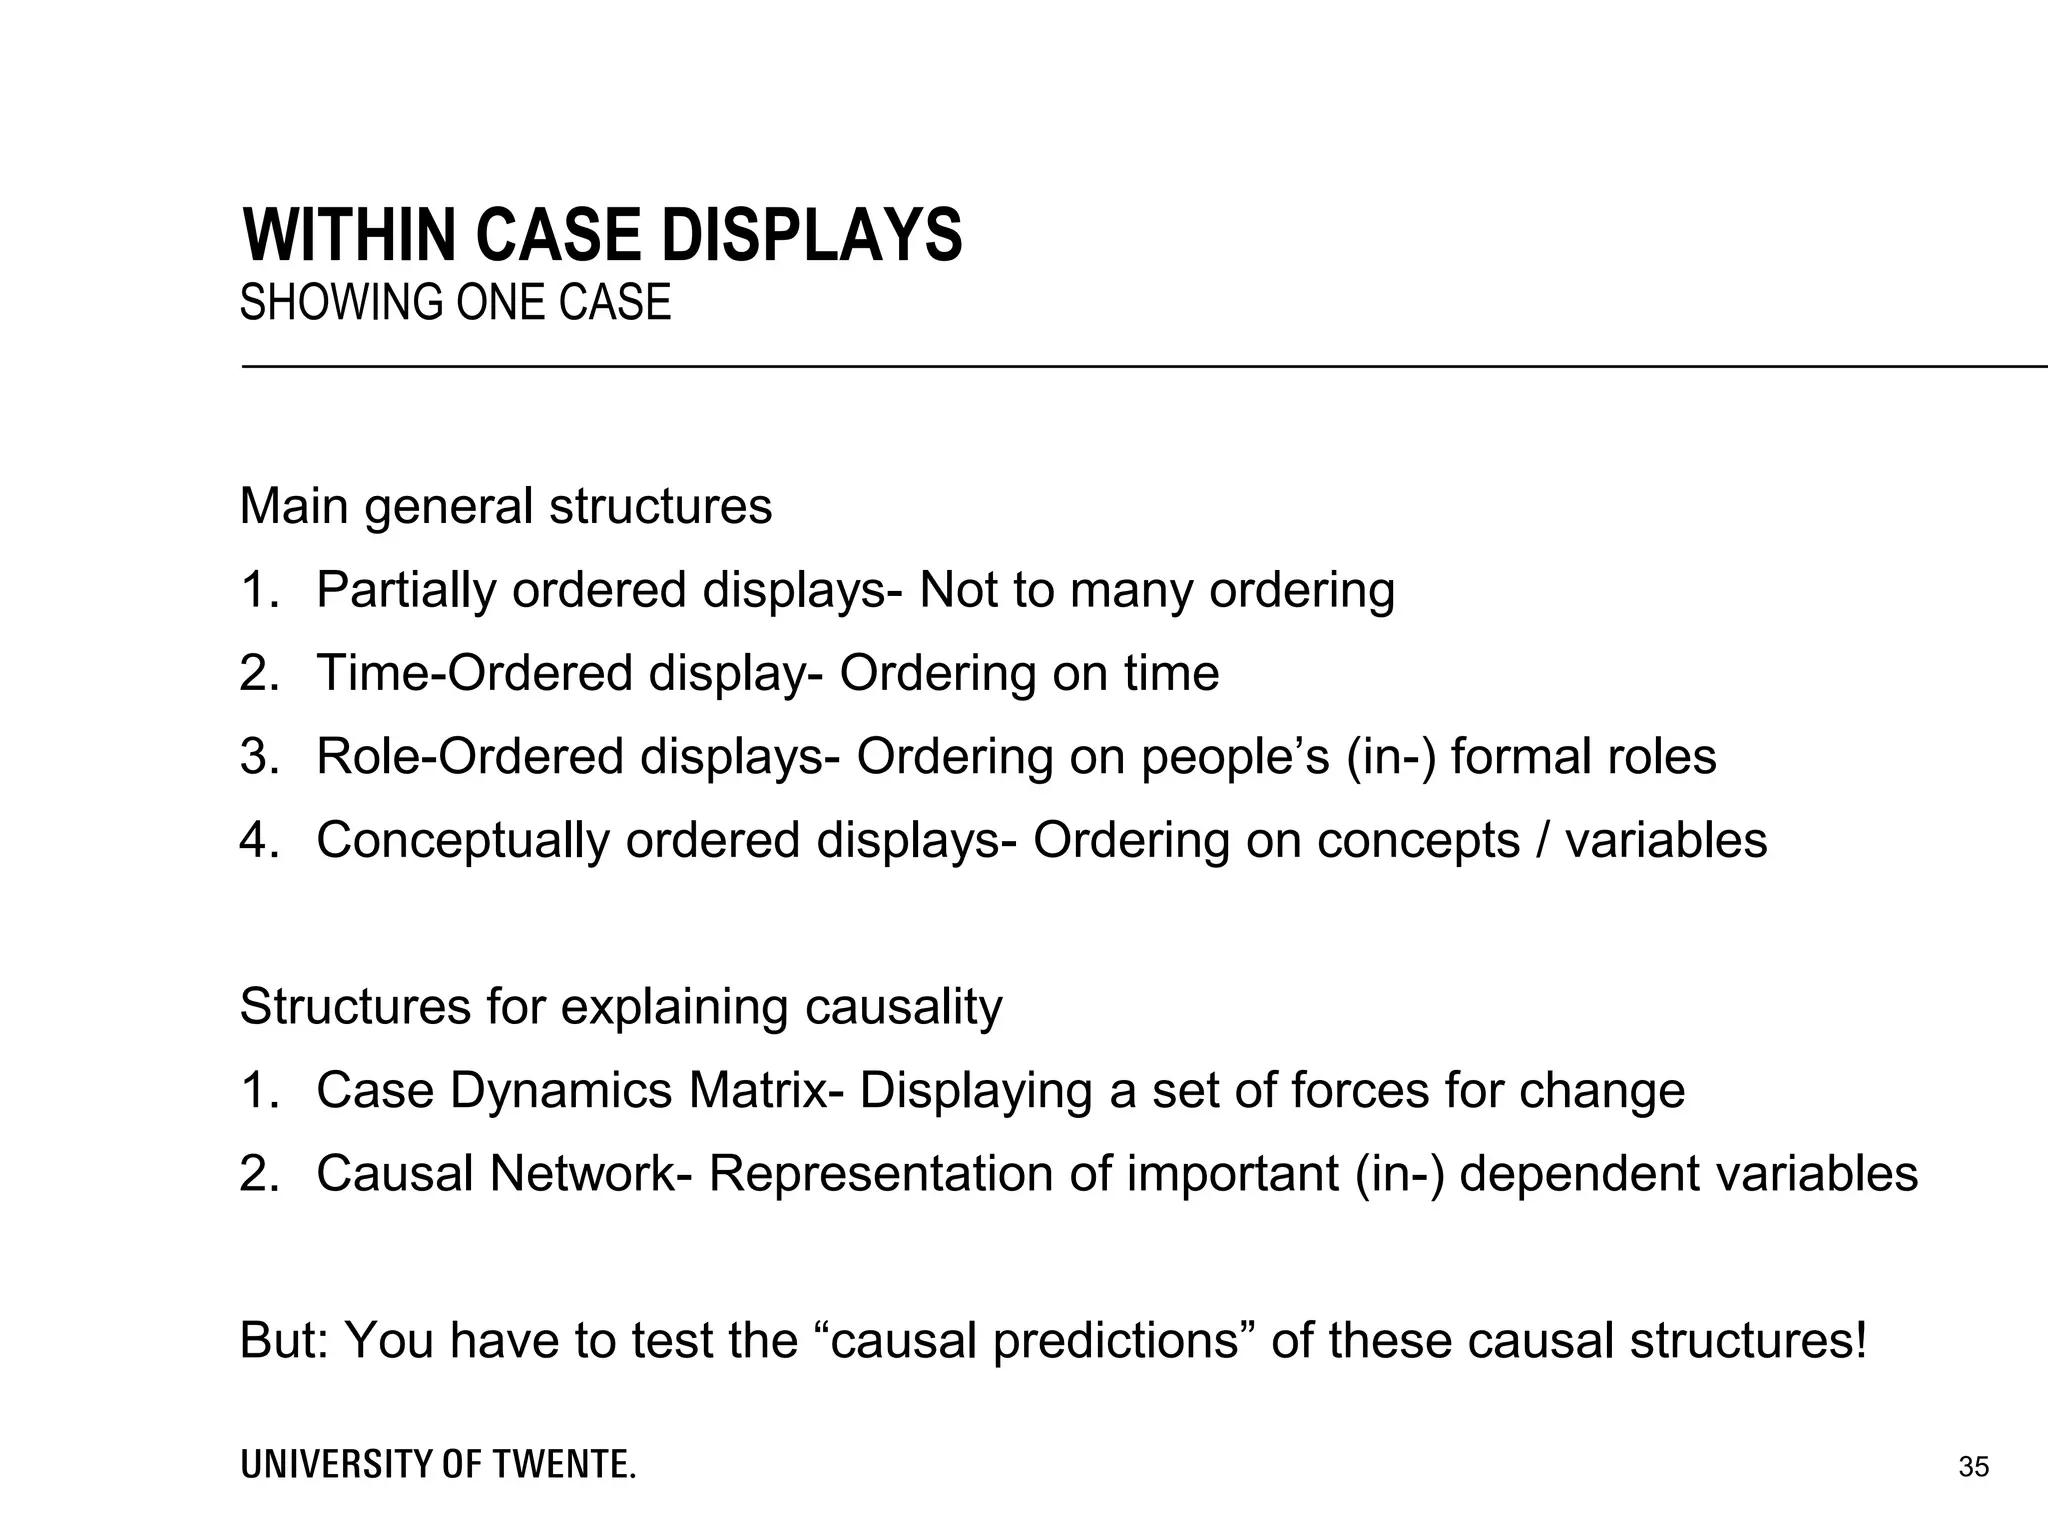
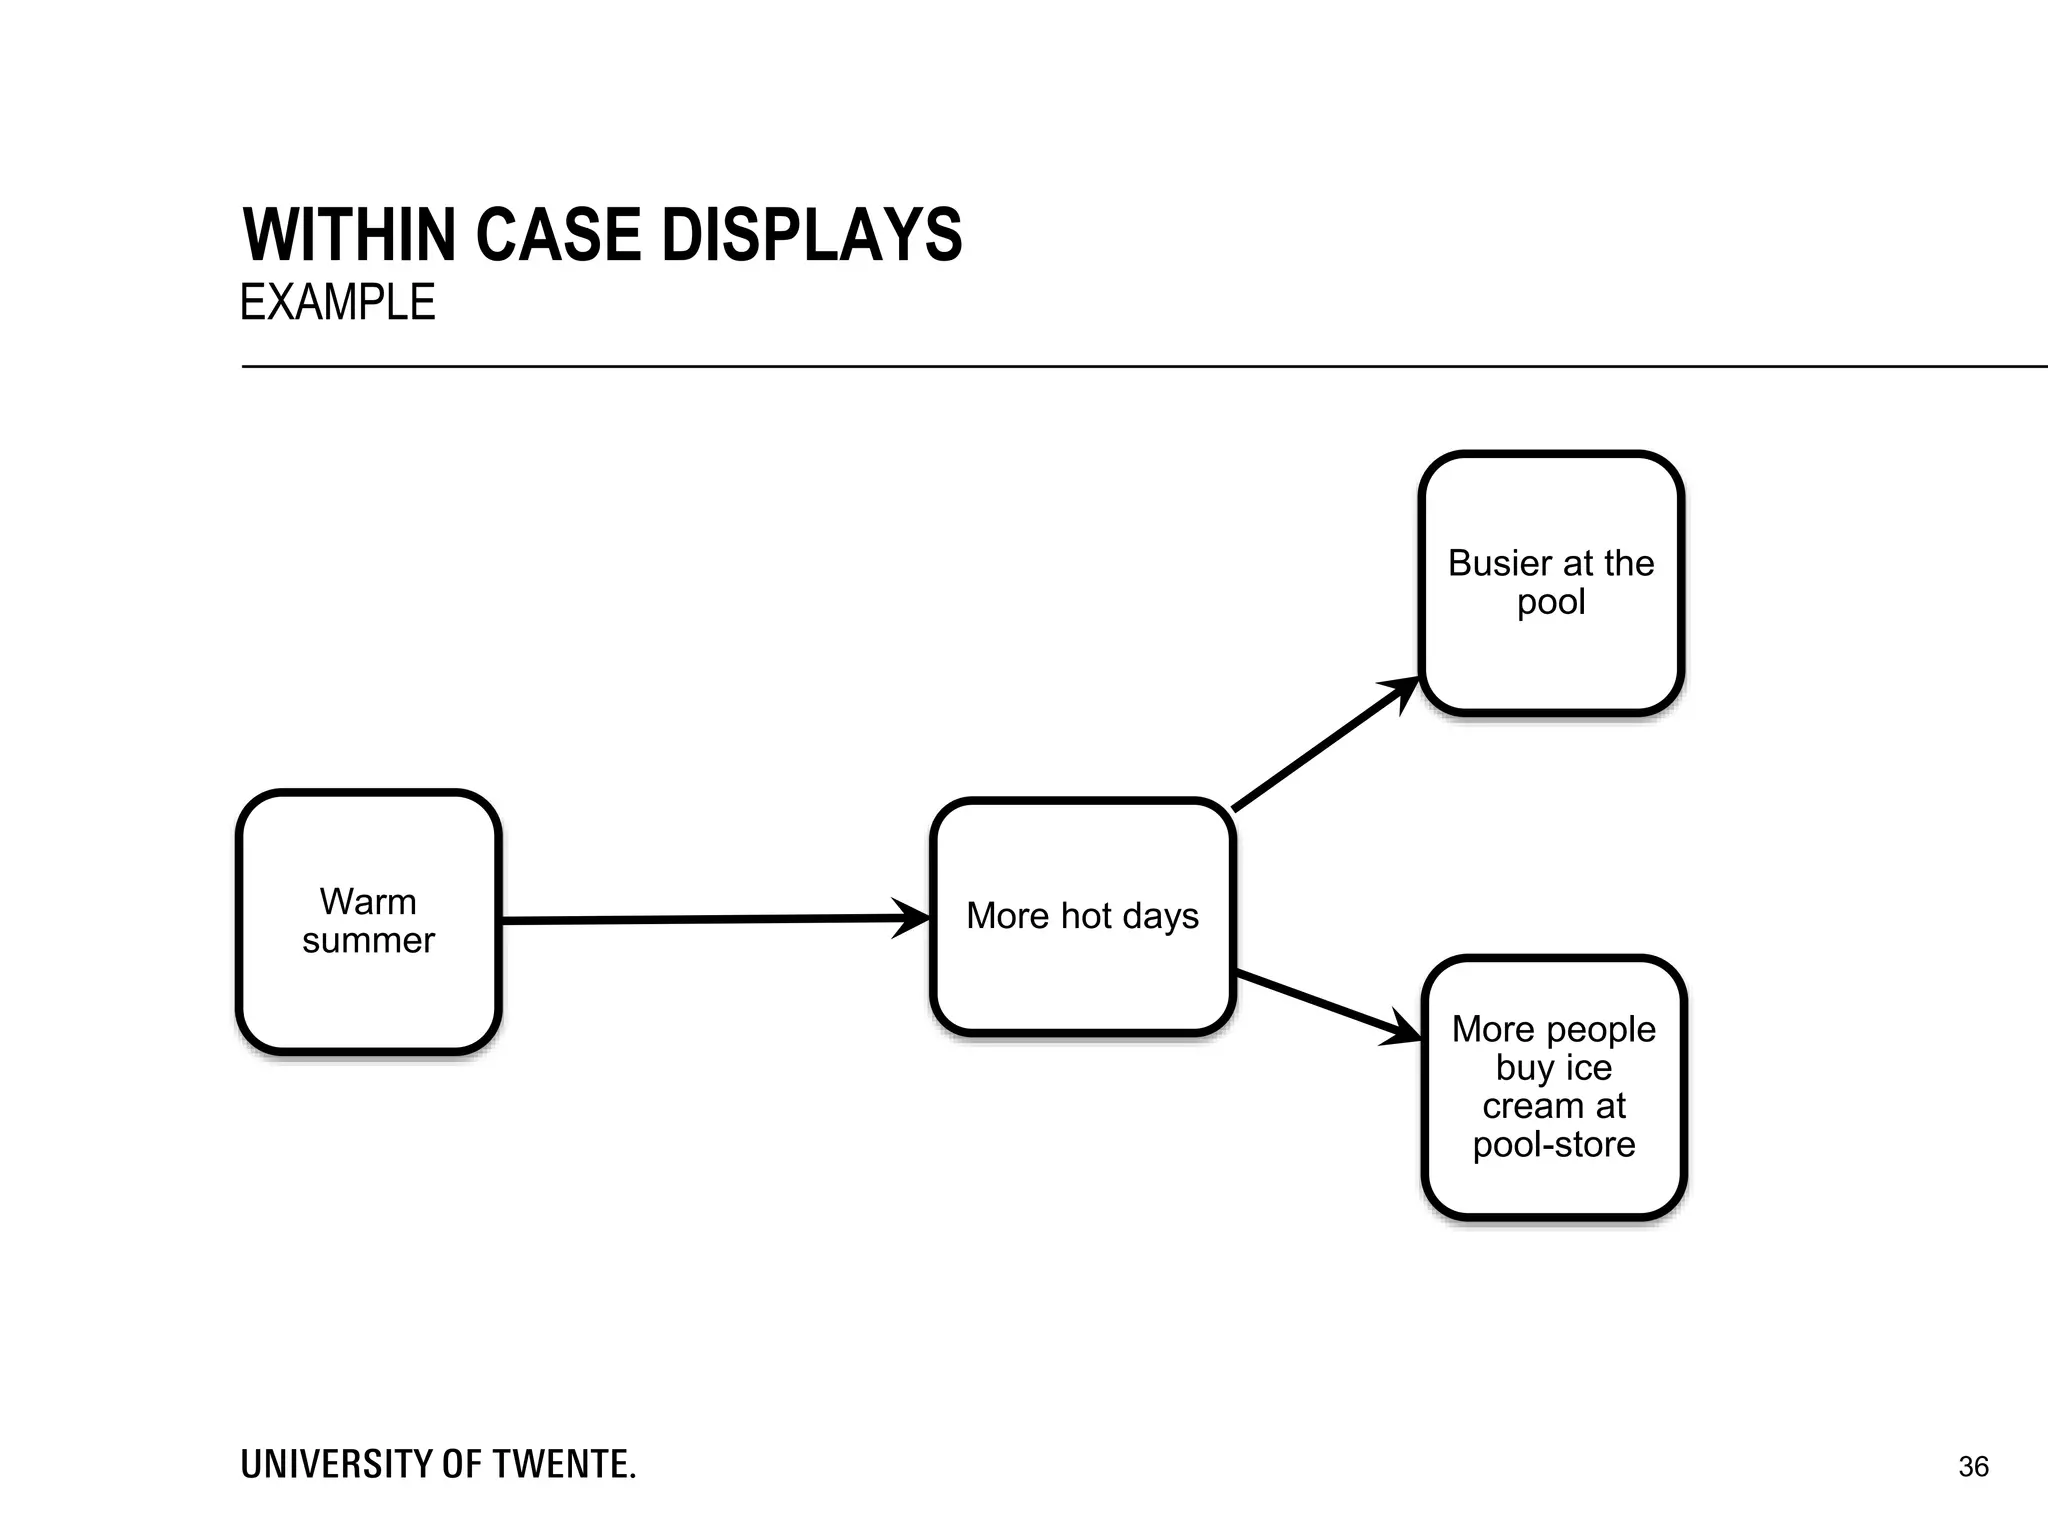
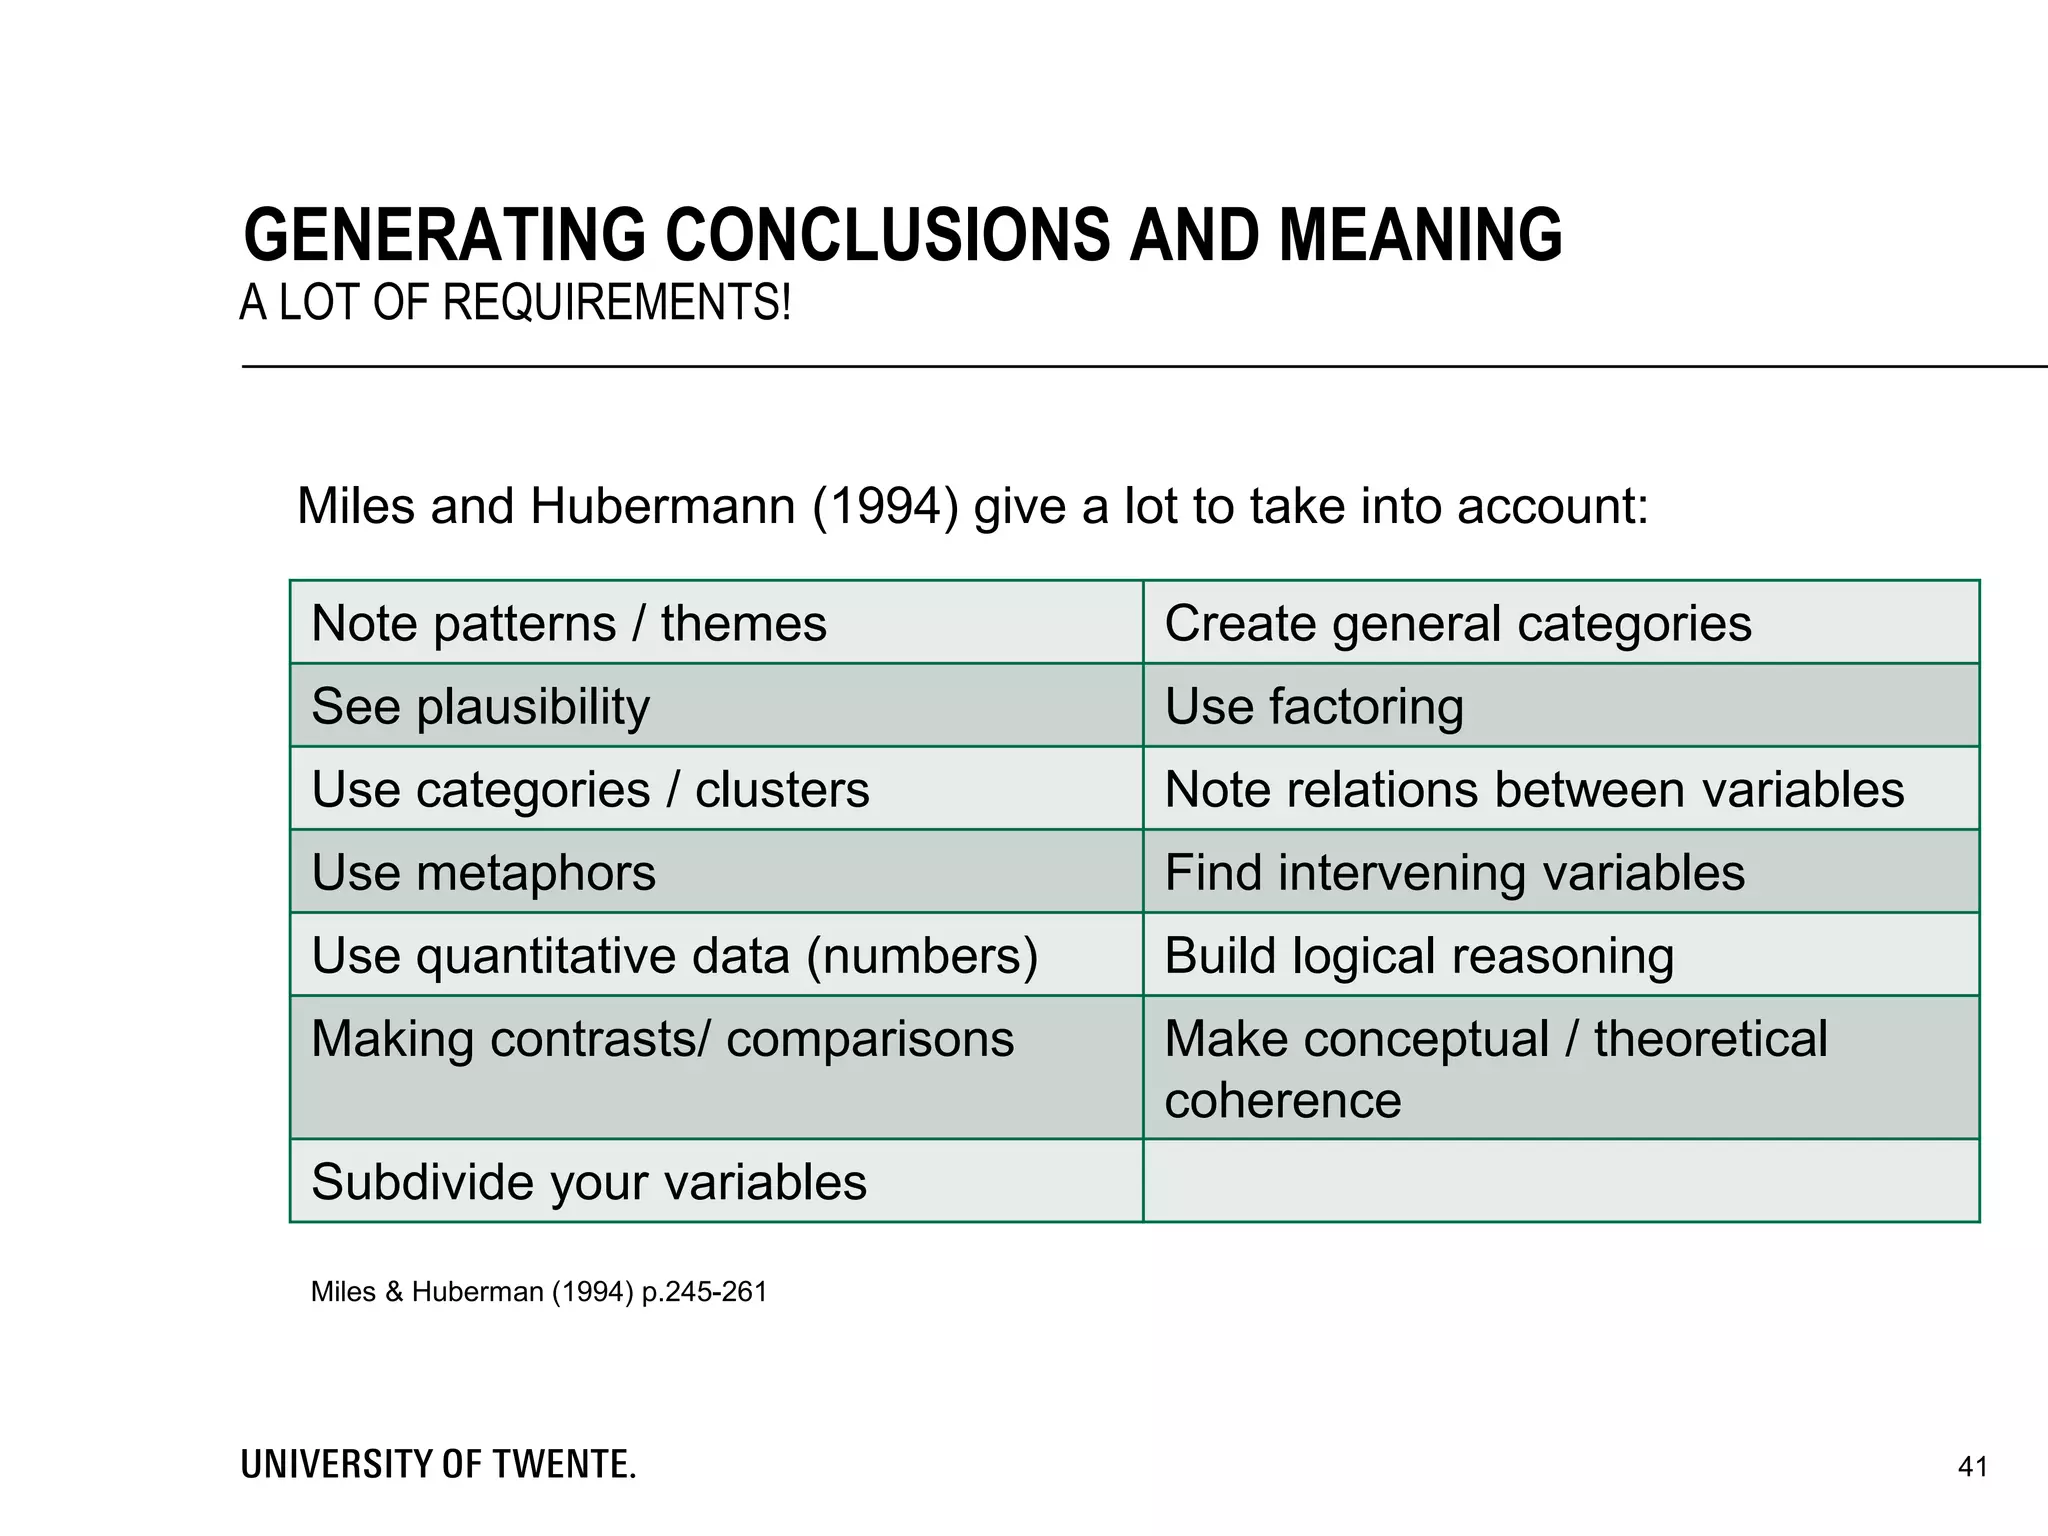
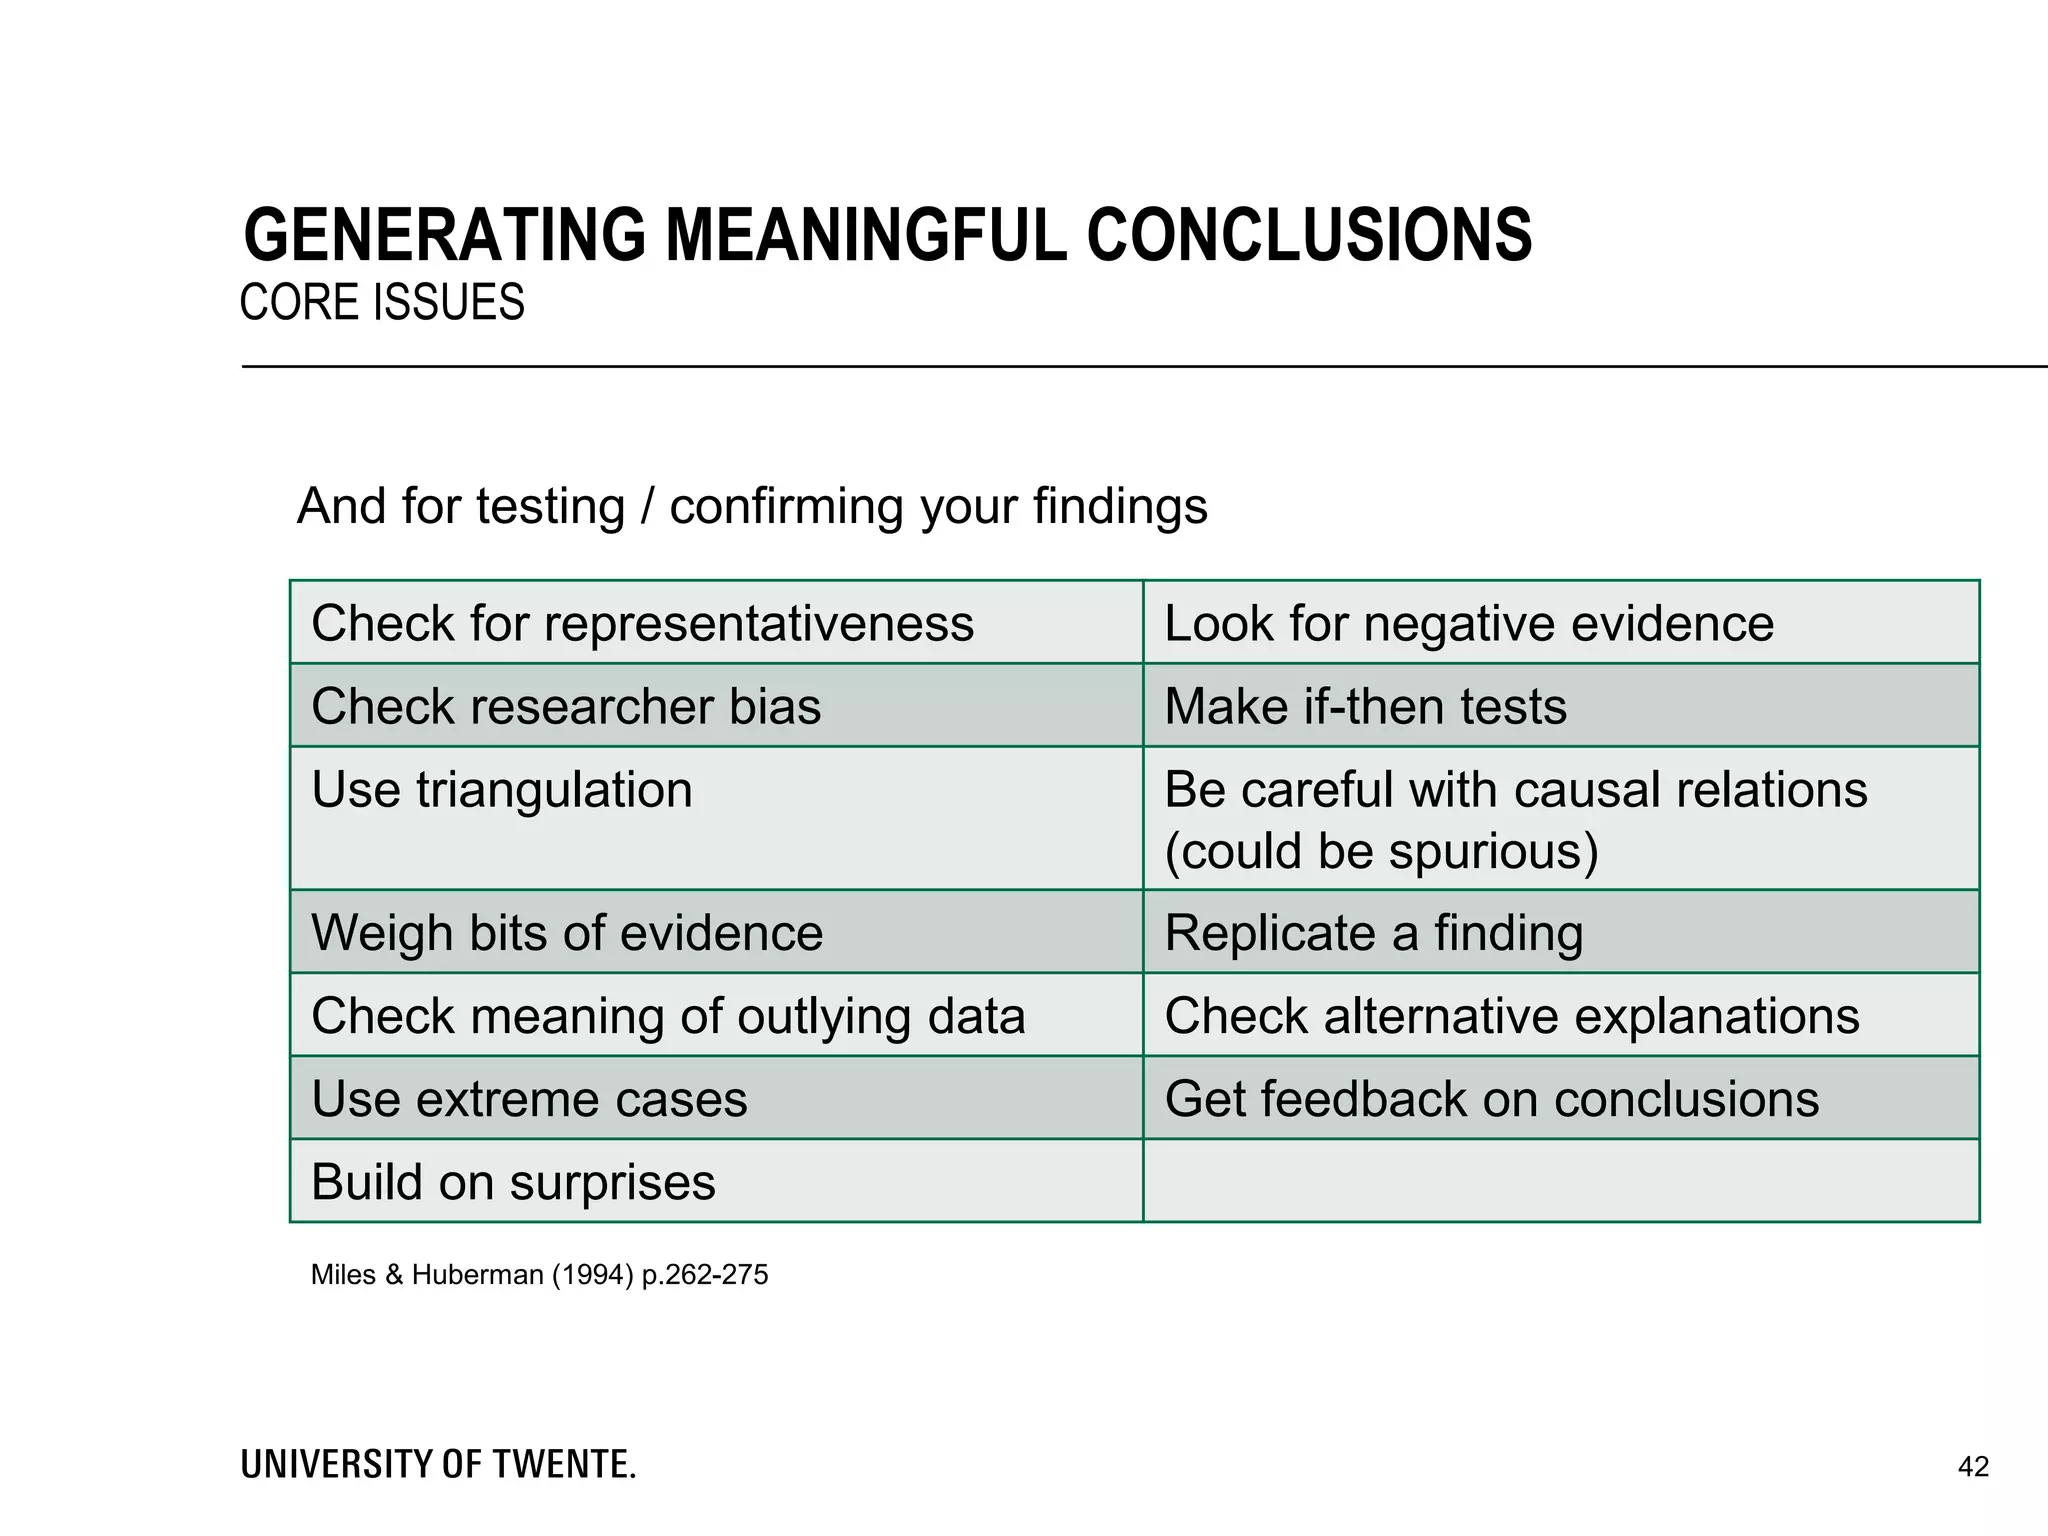
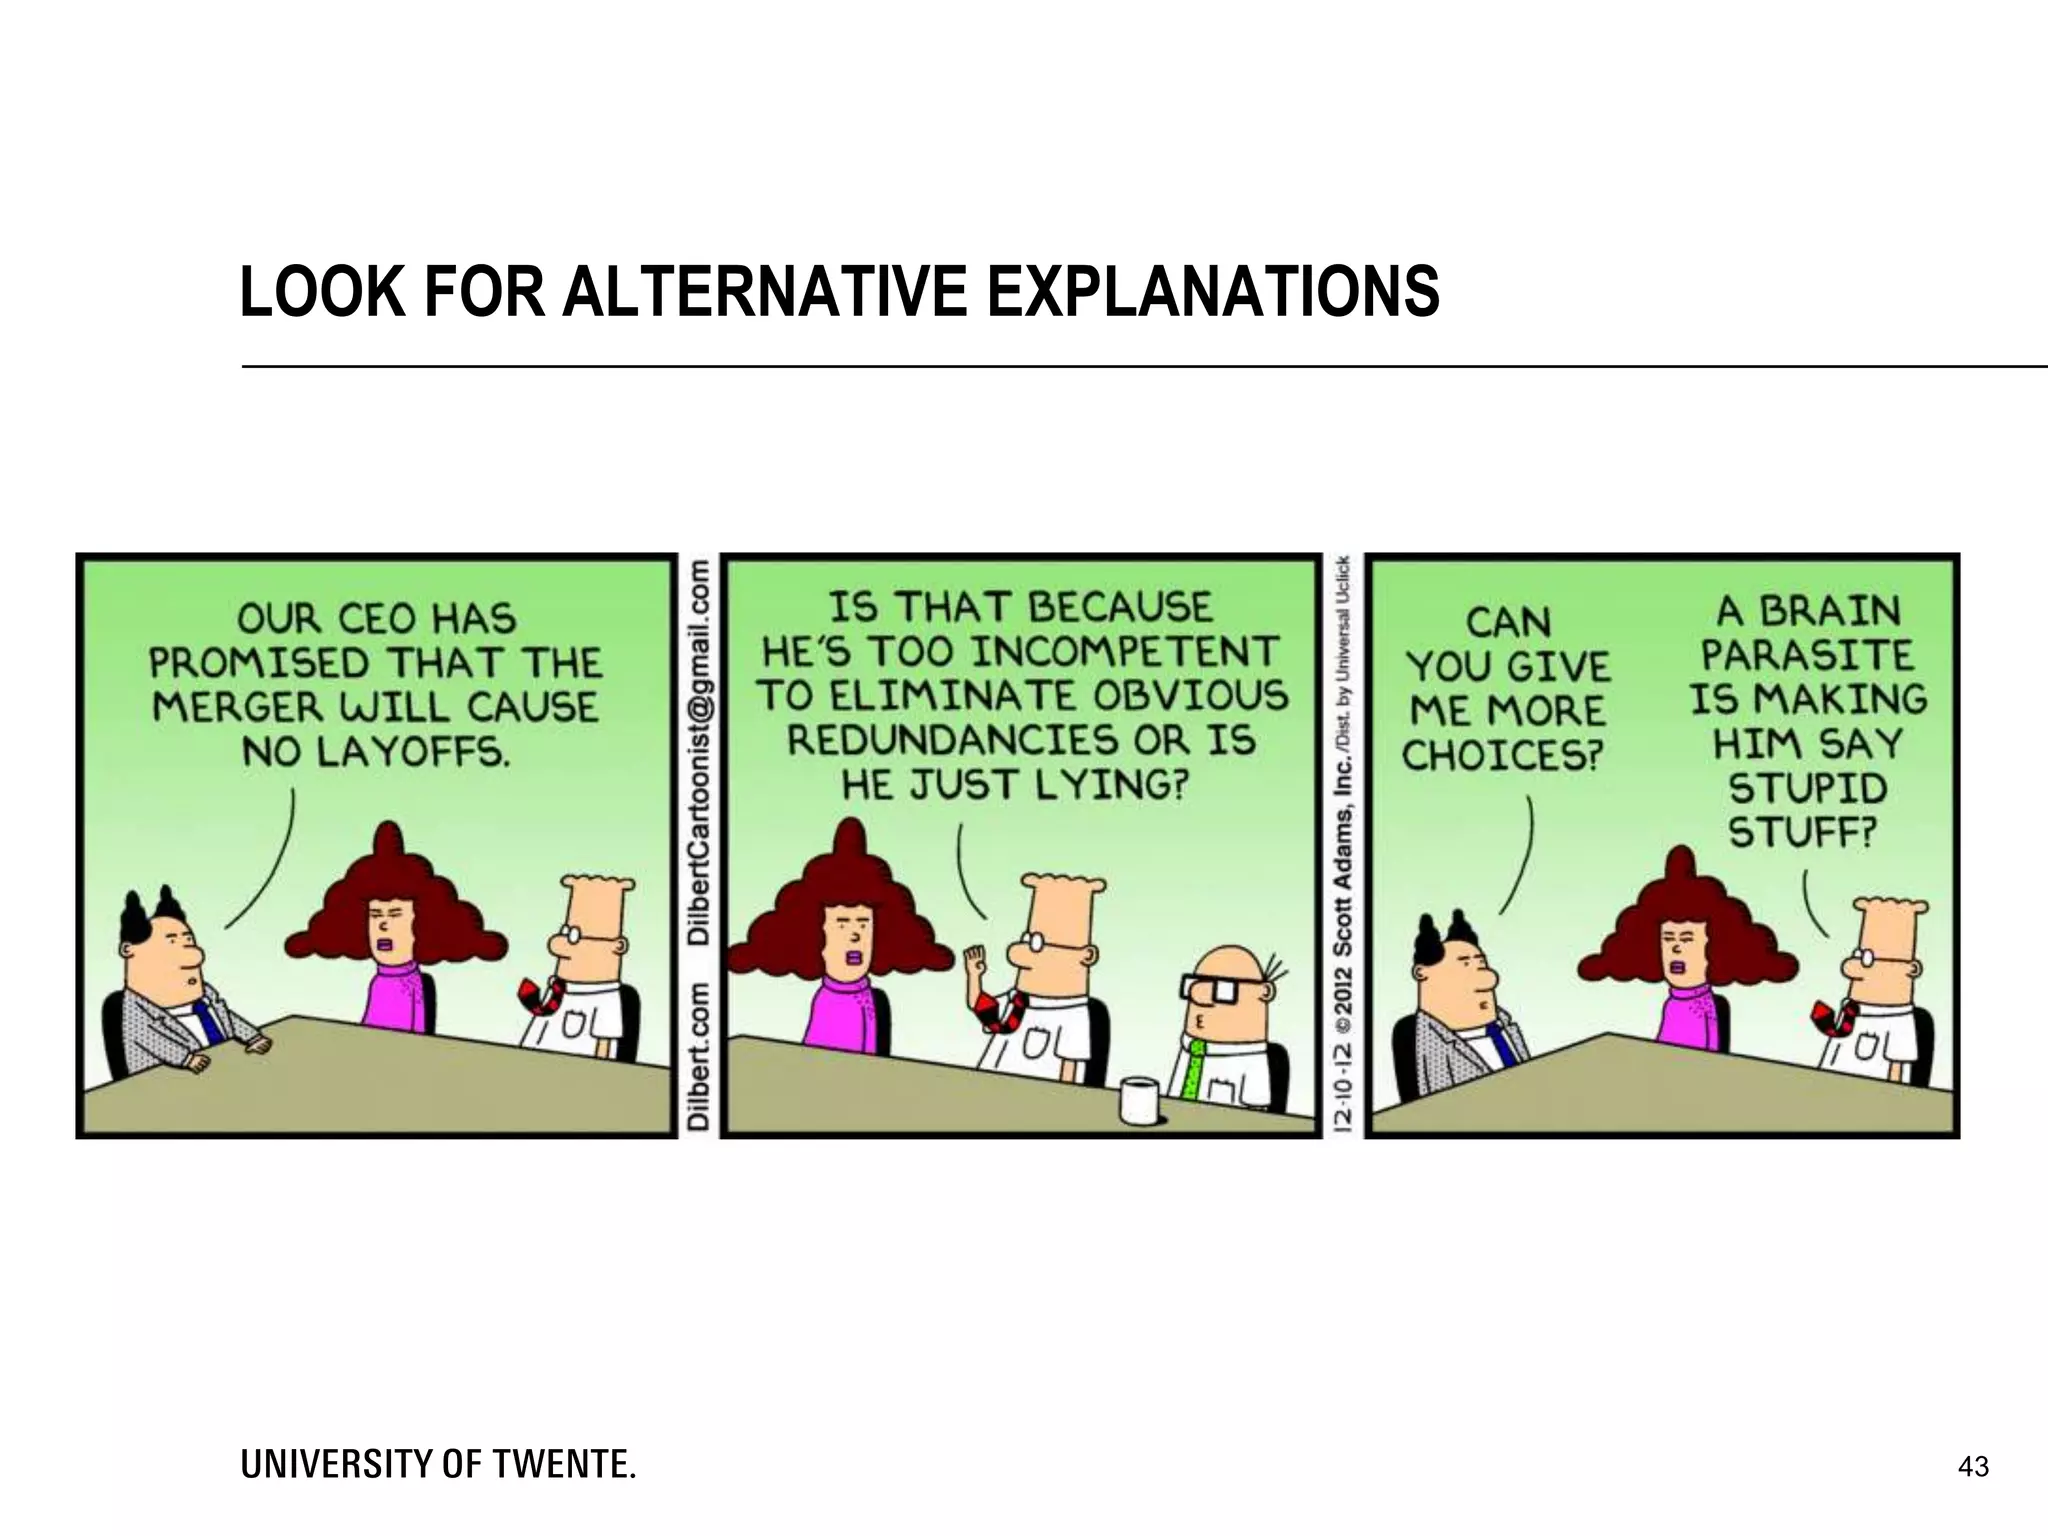
INTERNATIONAL NEW BUSINESS DEVELOPMENT
QUALITATIVE RESEARCH
MICHEL EHRENHARD
SUMMARIZING SO FAR
2
 Project is hard work
 But you can show skills and have fun
 With enough effort you will pass!
 Take responsibility
 Prepares for bachelor assignment
in ‘safe’ environment (group/time limit)
 Also please help us
 Email first to student assistant
 Initial communication in English
 How’s it going?
 What did you experience as most difficult?
“No man left behind”
3
BALANCED KEY CUSTOMER PROBLEM ESSENTIAL
 More than just ‘problem definition’
 A recognition that
 Problems are not just ‘found’ during analysis, they’re also designed -
by you!
 Your ability to solve a problem is directly affected by how well you
design it in the first place
 If you can’t solve the problem, then change the problem you’re solving
8-7-2014Voettekst: aanpassen via 'Invoegen' ('Beeld' voor Office 2003 of
eerder) kies vervolgens 'Koptekst en voettekst'
4
PROBLEM FRAMING
 Designed to be actionable in the first place
 Suggest what steps/tools/approach might be required to address the
problems
 Use whatever language, jargon (formal or informal) makes most sense
for those involved
 Exciting, compellingly worded
 Upon reading it, should be a problem you want to know the answer to
 Relevance at least as important as rigor
 I.e., ‘usefulness’ as important as ‘precision’
8-7-2014Voettekst: aanpassen via 'Invoegen' ('Beeld' voor Office 2003 of
eerder) kies vervolgens 'Koptekst en voettekst'
5
GOOD PROBLEM DEFINITIONS
 Statements you make raise questions in the listener's mind
 Fail to answer those questions—presentation perceived as incomplete
 Answer questions that were not asked—presentation perceived as
redundant
 Achieve a balance and credibility and impact rise dramatically
 Ask only the questions you can answer, and
 Answer only the questions you ask
8-7-2014Voettekst: aanpassen via 'Invoegen' ('Beeld' voor Office 2003 of
eerder) kies vervolgens 'Koptekst en voettekst'
6
KEY IS BALANCE BETWEEN
QUESTIONS ASKED AND ANSWERED
8-7-2014Voettekst: aanpassen via 'Invoegen' ('Beeld' voor Office 2003 of
eerder) kies vervolgens 'Koptekst en voettekst'
7
PROBLEM FRAMING SETS STARTING POINT
AND DETERMINES SCOPE
8-7-2014Voettekst: aanpassen via 'Invoegen' ('Beeld' voor Office 2003 of
eerder) kies vervolgens 'Koptekst en voettekst'
8
KEY CUSTOMER PROBLEM
EXAMPLES
 You know what you want: answer to Key Customer Problem
 What did others find? Theory!
 But most problems cannot be answered by use of theory alone, e.g.:
 No literature available
 Literature too broad
 Different context (industry, country, time, etc.)
 Solution: make your own ‘theory’ by empirical study
8-7-2014Voettekst: aanpassen via 'Invoegen' ('Beeld' voor Office 2003 of
eerder) kies vervolgens 'Koptekst en voettekst'
9
EMPIRICAL RESEARCH DESIGN
HOW TO ANSWER KEY CUSTOMER PROBLEM?
 Quantitative: emphasis on statistical
testing of assumptions
 Qualitative: emphasis on analyzing
behaviors, events and artefacts
 Design research: emphasis on
developing a useful artefact
 Mixed methods
 Combinations of above
10
DIFFERENT DESIGNS
11
WHEN USE WHICH DESIGN?
 How would you measure customer demand?
 Last year students did field experiment
 Sell with different stories
 Positive frame: prevention
 Negative frame: danger
 Control group: neutral
 Which one sold more?
8-7-2014Voettekst: aanpassen via 'Invoegen' ('Beeld' voor Office 2003 of
eerder) kies vervolgens 'Koptekst en voettekst'
12
EXAMPLE: DEMAND FOR FIRE EXTINGUISHERS
Methods Benefits Possible drawbacks
Quantitative Clear cut testing/
analyses; hypothesis
testing (confirm/reject)
Design needs to be perfect up
front; sample size; self-report;
causality; oversimplification
(proxies / forced answers)
Qualitative Aim to understand;
open minded
Analyses complicated; matter of
plausibility: always multiple
interpretations possible
Design You ‘deliver’ something Full cycle difficult, often only
prototype testing
Mixed methods Best of both qual and
quant
Almost double the work
13
MAIN BENEFITS/ DRAWBACKS
14
QUANTITATIVE RESEARCH
 Selection: which population, which respondents?
 Sample: how many respondents necessary? What type of sampling?
 Measurement: constructing survey instrument, use validated scales,
Databases? Self-report data / common method bias?
 Collection: post or online? Dillman method?
 Analysis: what type of statistics?
 T-test, ANOVA, exploratory factor analysis, regression, etc.
 NOIR
 Highly recommended reading
 Andy Field – Discovering Statistics using SPSS (Sage)
15
KEY CHOICES
16
QUALITATIVE RESEARCH
WHY QUALITATIVE RESEARCH?
 Much more work than quantitative research if done well
 Cost more time
 Cost more effort:
more ‘messy’ process
 Why bother?
17
 Qualitative Research can provide meaningful findings.
 Features
 Intense contact with the field
 Holistic view of the context
 Gather data from the inside
 Isolation of certain themes
 Understand account for and act on people’s behavior
 Many interpretations possible
 Little standardized instruments
 Mostly in words
18
SCIENTIFIC REASONS (MILES & HUBERMAN, 1994)
CASSELL & SYMON (2004)
 Non-exhaustive list of 30 (!) different methods
 Interviews, electronic interviews, life histories, critical incident technique,
repertory grids, cognitive mapping, twenty statements test, research
diaries, stories, pictoral representation, group methods, participant
observation, analytic induction, critical research, hermeneutic
understanding, discourse analysis, talk-in-action/conversation analysis,
attributional coding, grounded theory, template text analysis, data
matrices, preserving/sharing/reusing, documents, ethnography, case
study, soft systems, action research, co-research, future conference
19
OWN QUALITATIVE EXPERIENCE
 Semi-structured interview
 (Informal) unstructured interviews
 Structured interviews
 Diaries
 Documentary data
 Group interview
 (Non)participant observation
 Action research
20
 Selection & sample: who do you study and why?
 Measurement: which questions do you ask?
 Data collection: how do you ask?
 Data analyses: how do you analyze?
21
RESEARCH PROCESS
SELECTION & SAMPLE
 Who do you talk to? What about? Where to go? What do you look at?
 Maximum variation or similar cases?
 Selection on dependent variable
 Events with system disturbing potential (Barley & Tolbert, 1997)
 Multiple cases: replication and extension?
 Gaining access
 Snowballing
22
23
MEASUREMENT
MEASUREMENT
 How do you ‘measure’?
 Interviews (open, semi-structured, structured)
 Focus groups (=small group interview)
 Open survey (!)
 Field study ((non-)participant observation, action research)
 Documents (minutes, annual reports, manuals, protocols, etc.)
 Diaries
 Etc.
24
SEMI-STRUCTURED INTERVIEWS
 Most common form of qualitative research
 Get a snapshot, could repeat over multiple waves
 People are not familiar with you: social desirable answers
 Audiotape!
25
OBSERVATION STUDY
26
27
HOW MUCH DATA?
ALWAYS QUESTION OF BALANCE: SATURATION
28
DATA ANALYSIS
MAKING SENSE OF DATA BEYOND OBVIOUS
29
 Contact summary sheet
• One-page document to summarize a field contact
 Case analysis meetings
• Meeting with peers to discuss your research progress
 Interim case summaries
• Summarizing your research progress
30
SOME STRUCTURE BEFORE START
• Good way to analyze data (not the only way)
• Start from the data
• Difficult to see the larger picture
• Start from theory
• Difficult to find new things
• In practice always somewhere in the middle
• Other way is coding for recurring important themes over entire text
• You determine what is ‘important’
31
TABLES
Data coding
• Assigning tags / codes to pieces of your data.
• Makes analysis easier / faster
Vignette
• Example of your research
• Narrative structure
• Exemplifies typical series of steps
Pre-structured Case
• Structure your research beforehand
32
EARLY ANALYSIS STEPS
CODING
Code
Code
Code
Code
Code
Code
Themes/
Concepts
Theory
Category
Category
Subcategory
Subcategory
concrete abstract
particular general
 Clear, concise displaying data is crucial
for drawing conclusions in Qualitative
research.
 Building a display format is relatively
easy
 Matrix displays vs. Networks displays
• Matrix works best when focussing on
variables
• Networks show the process better
34
WITHIN CASE DISPLAYS
SHOWING ONE CASE
Clear data
display
Better
conclusions
Main general structures
1. Partially ordered displays- Not to many ordering
2. Time-Ordered display- Ordering on time
3. Role-Ordered displays- Ordering on people’s (in-) formal roles
4. Conceptually ordered displays- Ordering on concepts / variables
Structures for explaining causality
1. Case Dynamics Matrix- Displaying a set of forces for change
2. Causal Network- Representation of important (in-) dependent variables
But: You have to test the “causal predictions” of these causal structures!
35
WITHIN CASE DISPLAYS
SHOWING ONE CASE
36
WITHIN CASE DISPLAYS
EXAMPLE
More hot daysWarm
summer
Busier at the
pool
More people
buy ice
cream at
pool-store
8-7-2014 37
WITHIN CASE
DISPLAYS
EXAMPLE
 Previous slides were about one case / research
 We can also use this for multiple cases
• It makes our research more generalizable
• It deepens our understanding
 More complex then a single case
 Same categories:
1. Partially ordered displays
2. Time-Ordered display
3. Role-Ordered displays
4. Conceptually ordered displays
38
CROSS-CASE DISPLAYS
SHOWING SEVERAL CASES TOGETHER
When explaining causality
 Understand all cases
 Do not plainly aggregate
your data
 Avoid ‘throwing away’ data
 Use both variable- and
process-oriented structures
 Cluster cases in
“explanatory families”
39
CROSS-CASE DISPLAYS
SHOWING SEVERAL CASES TOGETHER
PLAUSIBILITY: BE CRITICAL
DON’T TAKE STATEMENTS FOR GRANTED
40
Miles and Hubermann (1994) give a lot to take into account:
41
GENERATING CONCLUSIONS AND MEANING
A LOT OF REQUIREMENTS!
Note patterns / themes Create general categories
See plausibility Use factoring
Use categories / clusters Note relations between variables
Use metaphors Find intervening variables
Use quantitative data (numbers) Build logical reasoning
Making contrasts/ comparisons Make conceptual / theoretical
coherence
Subdivide your variables
Miles & Huberman (1994) p.245-261
And for testing / confirming your findings
42
GENERATING MEANINGFUL CONCLUSIONS
CORE ISSUES
Check for representativeness Look for negative evidence
Check researcher bias Make if-then tests
Use triangulation Be careful with causal relations
(could be spurious)
Weigh bits of evidence Replicate a finding
Check meaning of outlying data Check alternative explanations
Use extreme cases Get feedback on conclusions
Build on surprises
Miles & Huberman (1994) p.262-275
LOOK FOR ALTERNATIVE EXPLANATIONS
43
 The way of organizing data can improve your research / report
 Miles and Huberman state there are 4 categories here:
1. Is your research objective and confirmable?
2. Is your research methodology reliable / stable?
3. Do your findings make sense for this particular problem?
4. Are your findings generalizable to a larger set of problems?
 Key here is to carefully document your progress and methods, so
that you connect with your ‘audiences’.
44
WRAPPING UP
WHAT DID WE SEE?
45
FINALLY
1. Build a conceptual framework
 A graphical display of your research
2. Formulating research questions
3. Determine your case
 Determine your unit of analysis
4. Sampling
 Determine what you study and when
46
SUMMARY RESEARCH PROCESS (1/2)
REDUCING DATA IN ADVANCE
5. Instrumentation
 How will you get information for
answering your questions?
6. Linking qualitative and quantitative
data (=mixed methods)
This enables:
a) Deeper analysis
b) Confirmation of qualitative data
c) New lines of thinking
47
SUMMARY RESEARCH PROCESS (2/2)
REDUCING DATA IN ADVANCE
48
MANAGE YOUR SUPERVISORS
49
ANY FINAL QUESTIONS?

Session 2 into to qualitative research intro

  • 1.
    INTERNATIONAL NEW BUSINESSDEVELOPMENT QUALITATIVE RESEARCH MICHEL EHRENHARD
  • 2.
    SUMMARIZING SO FAR 2 Project is hard work  But you can show skills and have fun  With enough effort you will pass!  Take responsibility  Prepares for bachelor assignment in ‘safe’ environment (group/time limit)  Also please help us  Email first to student assistant  Initial communication in English  How’s it going?  What did you experience as most difficult? “No man left behind”
  • 3.
    3 BALANCED KEY CUSTOMERPROBLEM ESSENTIAL
  • 4.
     More thanjust ‘problem definition’  A recognition that  Problems are not just ‘found’ during analysis, they’re also designed - by you!  Your ability to solve a problem is directly affected by how well you design it in the first place  If you can’t solve the problem, then change the problem you’re solving 8-7-2014Voettekst: aanpassen via 'Invoegen' ('Beeld' voor Office 2003 of eerder) kies vervolgens 'Koptekst en voettekst' 4 PROBLEM FRAMING
  • 5.
     Designed tobe actionable in the first place  Suggest what steps/tools/approach might be required to address the problems  Use whatever language, jargon (formal or informal) makes most sense for those involved  Exciting, compellingly worded  Upon reading it, should be a problem you want to know the answer to  Relevance at least as important as rigor  I.e., ‘usefulness’ as important as ‘precision’ 8-7-2014Voettekst: aanpassen via 'Invoegen' ('Beeld' voor Office 2003 of eerder) kies vervolgens 'Koptekst en voettekst' 5 GOOD PROBLEM DEFINITIONS
  • 6.
     Statements youmake raise questions in the listener's mind  Fail to answer those questions—presentation perceived as incomplete  Answer questions that were not asked—presentation perceived as redundant  Achieve a balance and credibility and impact rise dramatically  Ask only the questions you can answer, and  Answer only the questions you ask 8-7-2014Voettekst: aanpassen via 'Invoegen' ('Beeld' voor Office 2003 of eerder) kies vervolgens 'Koptekst en voettekst' 6 KEY IS BALANCE BETWEEN QUESTIONS ASKED AND ANSWERED
  • 7.
    8-7-2014Voettekst: aanpassen via'Invoegen' ('Beeld' voor Office 2003 of eerder) kies vervolgens 'Koptekst en voettekst' 7 PROBLEM FRAMING SETS STARTING POINT AND DETERMINES SCOPE
  • 8.
    8-7-2014Voettekst: aanpassen via'Invoegen' ('Beeld' voor Office 2003 of eerder) kies vervolgens 'Koptekst en voettekst' 8 KEY CUSTOMER PROBLEM EXAMPLES
  • 9.
     You knowwhat you want: answer to Key Customer Problem  What did others find? Theory!  But most problems cannot be answered by use of theory alone, e.g.:  No literature available  Literature too broad  Different context (industry, country, time, etc.)  Solution: make your own ‘theory’ by empirical study 8-7-2014Voettekst: aanpassen via 'Invoegen' ('Beeld' voor Office 2003 of eerder) kies vervolgens 'Koptekst en voettekst' 9 EMPIRICAL RESEARCH DESIGN HOW TO ANSWER KEY CUSTOMER PROBLEM?
  • 10.
     Quantitative: emphasison statistical testing of assumptions  Qualitative: emphasis on analyzing behaviors, events and artefacts  Design research: emphasis on developing a useful artefact  Mixed methods  Combinations of above 10 DIFFERENT DESIGNS
  • 11.
  • 12.
     How wouldyou measure customer demand?  Last year students did field experiment  Sell with different stories  Positive frame: prevention  Negative frame: danger  Control group: neutral  Which one sold more? 8-7-2014Voettekst: aanpassen via 'Invoegen' ('Beeld' voor Office 2003 of eerder) kies vervolgens 'Koptekst en voettekst' 12 EXAMPLE: DEMAND FOR FIRE EXTINGUISHERS
  • 13.
    Methods Benefits Possibledrawbacks Quantitative Clear cut testing/ analyses; hypothesis testing (confirm/reject) Design needs to be perfect up front; sample size; self-report; causality; oversimplification (proxies / forced answers) Qualitative Aim to understand; open minded Analyses complicated; matter of plausibility: always multiple interpretations possible Design You ‘deliver’ something Full cycle difficult, often only prototype testing Mixed methods Best of both qual and quant Almost double the work 13 MAIN BENEFITS/ DRAWBACKS
  • 14.
  • 15.
     Selection: whichpopulation, which respondents?  Sample: how many respondents necessary? What type of sampling?  Measurement: constructing survey instrument, use validated scales, Databases? Self-report data / common method bias?  Collection: post or online? Dillman method?  Analysis: what type of statistics?  T-test, ANOVA, exploratory factor analysis, regression, etc.  NOIR  Highly recommended reading  Andy Field – Discovering Statistics using SPSS (Sage) 15 KEY CHOICES
  • 16.
  • 17.
    WHY QUALITATIVE RESEARCH? Much more work than quantitative research if done well  Cost more time  Cost more effort: more ‘messy’ process  Why bother? 17
  • 18.
     Qualitative Researchcan provide meaningful findings.  Features  Intense contact with the field  Holistic view of the context  Gather data from the inside  Isolation of certain themes  Understand account for and act on people’s behavior  Many interpretations possible  Little standardized instruments  Mostly in words 18 SCIENTIFIC REASONS (MILES & HUBERMAN, 1994)
  • 19.
    CASSELL & SYMON(2004)  Non-exhaustive list of 30 (!) different methods  Interviews, electronic interviews, life histories, critical incident technique, repertory grids, cognitive mapping, twenty statements test, research diaries, stories, pictoral representation, group methods, participant observation, analytic induction, critical research, hermeneutic understanding, discourse analysis, talk-in-action/conversation analysis, attributional coding, grounded theory, template text analysis, data matrices, preserving/sharing/reusing, documents, ethnography, case study, soft systems, action research, co-research, future conference 19
  • 20.
    OWN QUALITATIVE EXPERIENCE Semi-structured interview  (Informal) unstructured interviews  Structured interviews  Diaries  Documentary data  Group interview  (Non)participant observation  Action research 20
  • 21.
     Selection &sample: who do you study and why?  Measurement: which questions do you ask?  Data collection: how do you ask?  Data analyses: how do you analyze? 21 RESEARCH PROCESS
  • 22.
    SELECTION & SAMPLE Who do you talk to? What about? Where to go? What do you look at?  Maximum variation or similar cases?  Selection on dependent variable  Events with system disturbing potential (Barley & Tolbert, 1997)  Multiple cases: replication and extension?  Gaining access  Snowballing 22
  • 23.
  • 24.
    MEASUREMENT  How doyou ‘measure’?  Interviews (open, semi-structured, structured)  Focus groups (=small group interview)  Open survey (!)  Field study ((non-)participant observation, action research)  Documents (minutes, annual reports, manuals, protocols, etc.)  Diaries  Etc. 24
  • 25.
    SEMI-STRUCTURED INTERVIEWS  Mostcommon form of qualitative research  Get a snapshot, could repeat over multiple waves  People are not familiar with you: social desirable answers  Audiotape! 25
  • 26.
  • 27.
    27 HOW MUCH DATA? ALWAYSQUESTION OF BALANCE: SATURATION
  • 28.
  • 29.
    MAKING SENSE OFDATA BEYOND OBVIOUS 29
  • 30.
     Contact summarysheet • One-page document to summarize a field contact  Case analysis meetings • Meeting with peers to discuss your research progress  Interim case summaries • Summarizing your research progress 30 SOME STRUCTURE BEFORE START
  • 31.
    • Good wayto analyze data (not the only way) • Start from the data • Difficult to see the larger picture • Start from theory • Difficult to find new things • In practice always somewhere in the middle • Other way is coding for recurring important themes over entire text • You determine what is ‘important’ 31 TABLES
  • 32.
    Data coding • Assigningtags / codes to pieces of your data. • Makes analysis easier / faster Vignette • Example of your research • Narrative structure • Exemplifies typical series of steps Pre-structured Case • Structure your research beforehand 32 EARLY ANALYSIS STEPS
  • 33.
  • 34.
     Clear, concisedisplaying data is crucial for drawing conclusions in Qualitative research.  Building a display format is relatively easy  Matrix displays vs. Networks displays • Matrix works best when focussing on variables • Networks show the process better 34 WITHIN CASE DISPLAYS SHOWING ONE CASE Clear data display Better conclusions
  • 35.
    Main general structures 1.Partially ordered displays- Not to many ordering 2. Time-Ordered display- Ordering on time 3. Role-Ordered displays- Ordering on people’s (in-) formal roles 4. Conceptually ordered displays- Ordering on concepts / variables Structures for explaining causality 1. Case Dynamics Matrix- Displaying a set of forces for change 2. Causal Network- Representation of important (in-) dependent variables But: You have to test the “causal predictions” of these causal structures! 35 WITHIN CASE DISPLAYS SHOWING ONE CASE
  • 36.
    36 WITHIN CASE DISPLAYS EXAMPLE Morehot daysWarm summer Busier at the pool More people buy ice cream at pool-store
  • 37.
  • 38.
     Previous slideswere about one case / research  We can also use this for multiple cases • It makes our research more generalizable • It deepens our understanding  More complex then a single case  Same categories: 1. Partially ordered displays 2. Time-Ordered display 3. Role-Ordered displays 4. Conceptually ordered displays 38 CROSS-CASE DISPLAYS SHOWING SEVERAL CASES TOGETHER
  • 39.
    When explaining causality Understand all cases  Do not plainly aggregate your data  Avoid ‘throwing away’ data  Use both variable- and process-oriented structures  Cluster cases in “explanatory families” 39 CROSS-CASE DISPLAYS SHOWING SEVERAL CASES TOGETHER
  • 40.
    PLAUSIBILITY: BE CRITICAL DON’TTAKE STATEMENTS FOR GRANTED 40
  • 41.
    Miles and Hubermann(1994) give a lot to take into account: 41 GENERATING CONCLUSIONS AND MEANING A LOT OF REQUIREMENTS! Note patterns / themes Create general categories See plausibility Use factoring Use categories / clusters Note relations between variables Use metaphors Find intervening variables Use quantitative data (numbers) Build logical reasoning Making contrasts/ comparisons Make conceptual / theoretical coherence Subdivide your variables Miles & Huberman (1994) p.245-261
  • 42.
    And for testing/ confirming your findings 42 GENERATING MEANINGFUL CONCLUSIONS CORE ISSUES Check for representativeness Look for negative evidence Check researcher bias Make if-then tests Use triangulation Be careful with causal relations (could be spurious) Weigh bits of evidence Replicate a finding Check meaning of outlying data Check alternative explanations Use extreme cases Get feedback on conclusions Build on surprises Miles & Huberman (1994) p.262-275
  • 43.
    LOOK FOR ALTERNATIVEEXPLANATIONS 43
  • 44.
     The wayof organizing data can improve your research / report  Miles and Huberman state there are 4 categories here: 1. Is your research objective and confirmable? 2. Is your research methodology reliable / stable? 3. Do your findings make sense for this particular problem? 4. Are your findings generalizable to a larger set of problems?  Key here is to carefully document your progress and methods, so that you connect with your ‘audiences’. 44 WRAPPING UP WHAT DID WE SEE?
  • 45.
  • 46.
    1. Build aconceptual framework  A graphical display of your research 2. Formulating research questions 3. Determine your case  Determine your unit of analysis 4. Sampling  Determine what you study and when 46 SUMMARY RESEARCH PROCESS (1/2) REDUCING DATA IN ADVANCE
  • 47.
    5. Instrumentation  Howwill you get information for answering your questions? 6. Linking qualitative and quantitative data (=mixed methods) This enables: a) Deeper analysis b) Confirmation of qualitative data c) New lines of thinking 47 SUMMARY RESEARCH PROCESS (2/2) REDUCING DATA IN ADVANCE
  • 48.
  • 49.