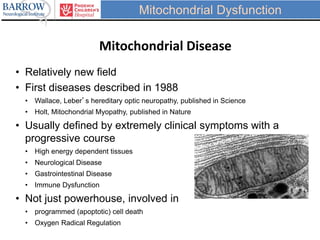
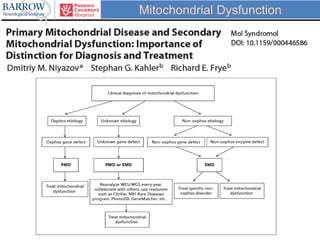
This document summarizes a presentation by Dr. Richard E. Frye on mitochondrial dysfunction in neurodevelopmental disorders and autism. The presentation covers:
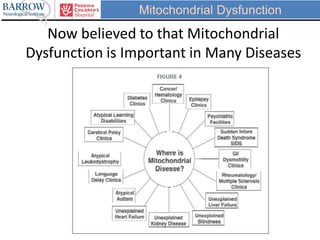
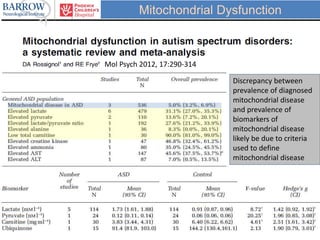
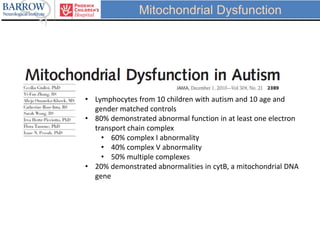
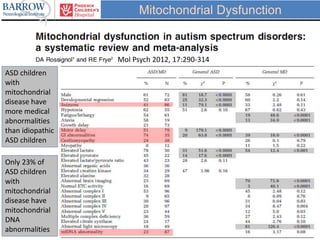
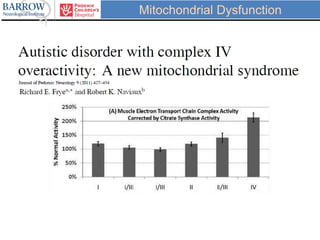
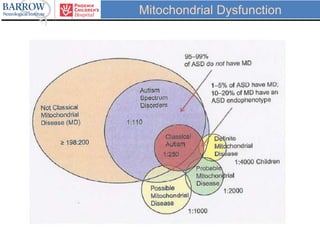
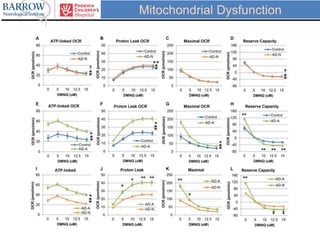
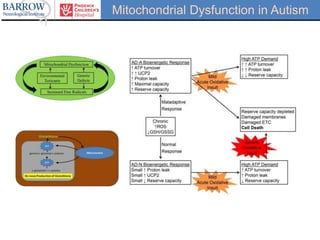
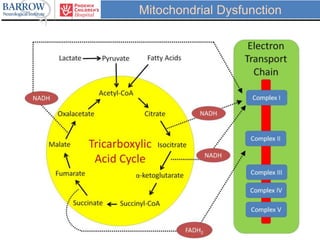
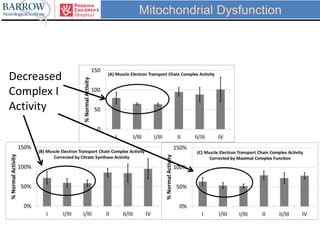
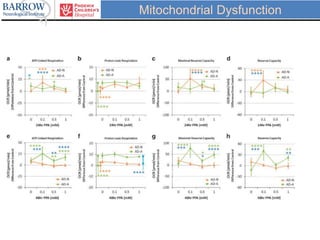
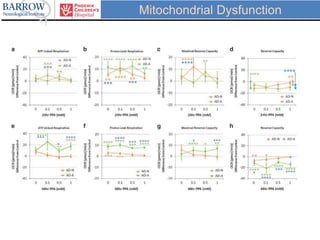
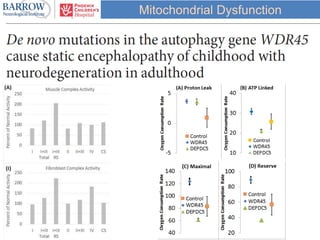
- Evidence that mitochondrial dysfunction is involved in many diseases and now believed to be important in autism based on studies showing abnormalities in electron transport chain complexes in autistic children.
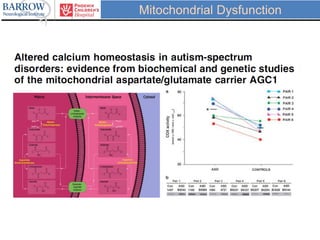
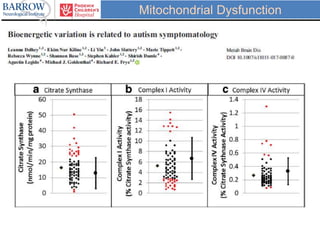
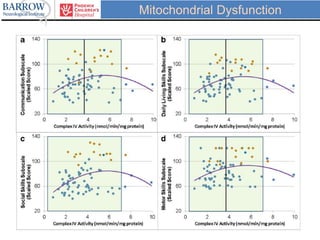
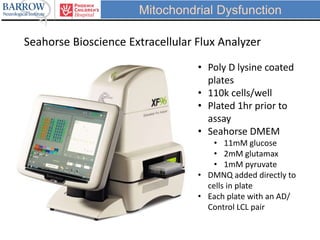
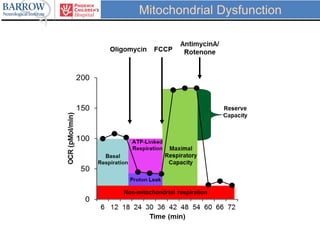
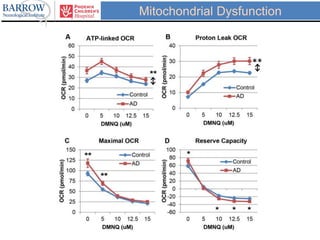
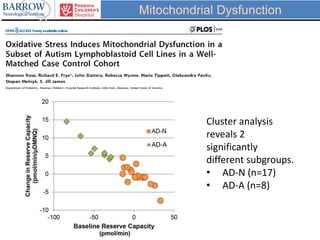
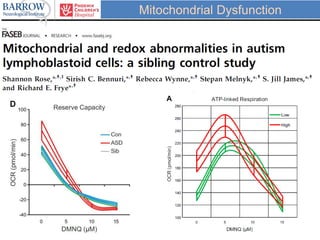
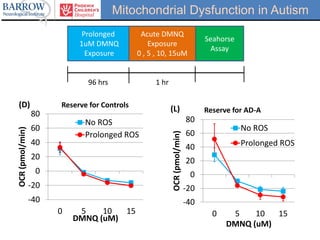
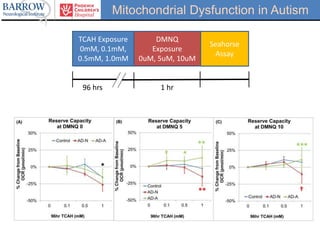
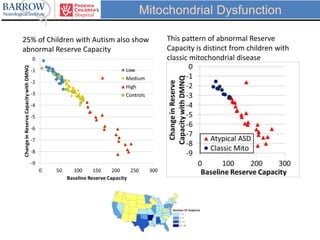
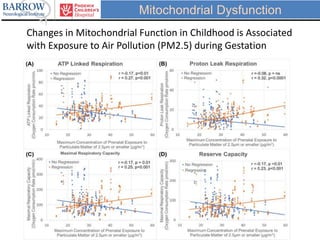
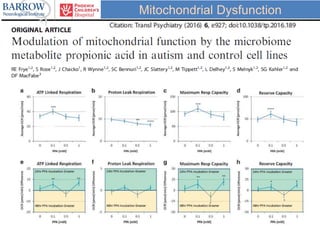
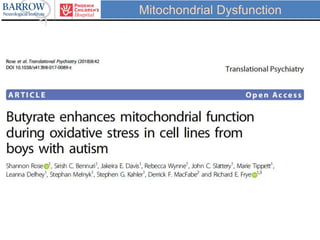
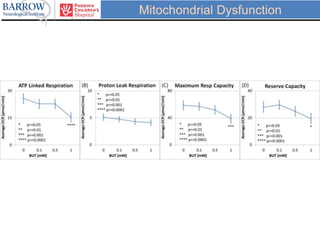
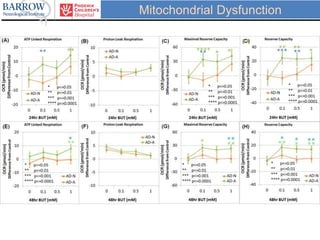
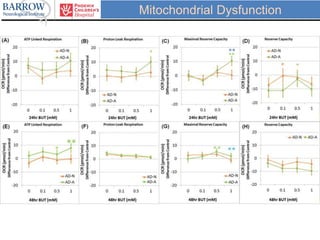
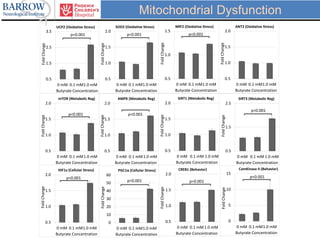
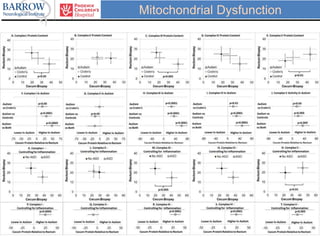
- Further studies demonstrating differences in mitochondrial reserve capacity between autistic children and controls, and associations with environmental exposures like air pollution.
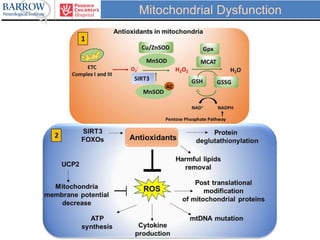
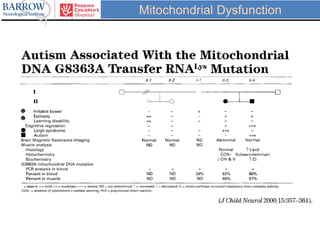
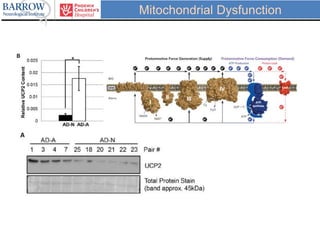
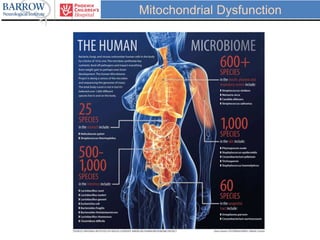
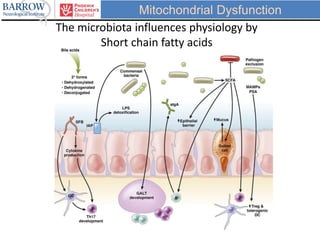
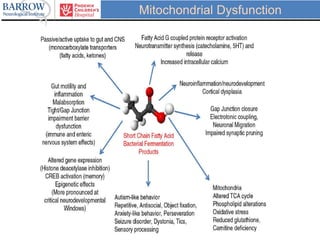
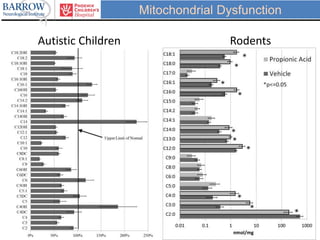
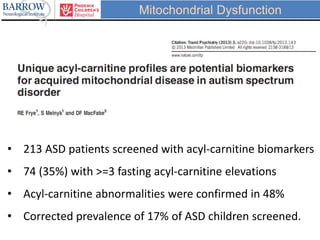
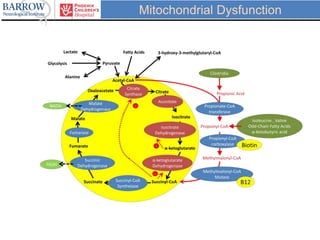
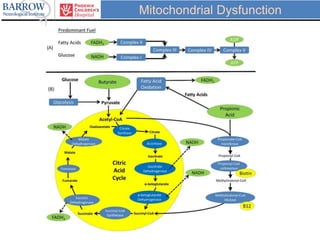
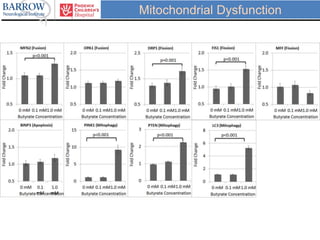
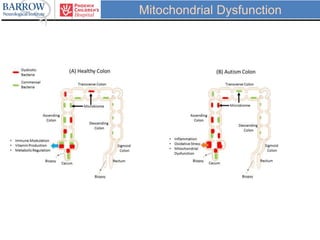
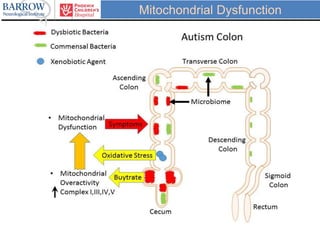
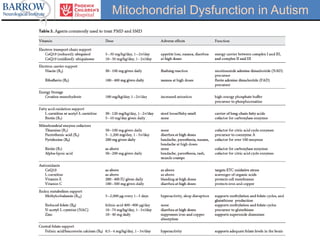
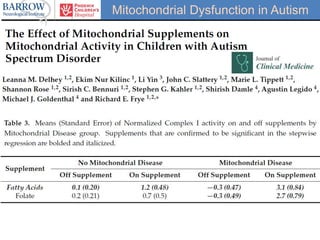
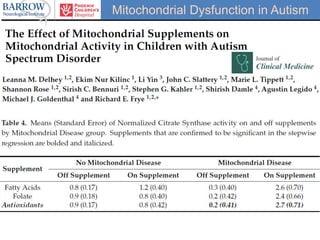
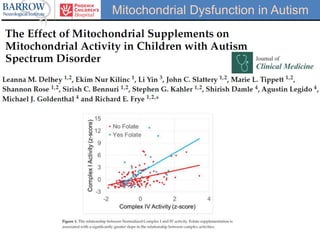
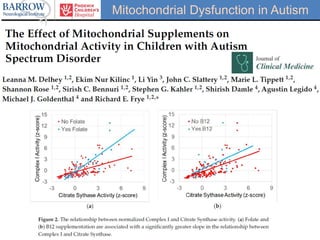
- Research into mechanisms of dysfunction including effects of the gut microbiome, genes, and potential treatments like mitochondrial cocktails.


![PERI-PROSTHETIC FRACTURE NAIL-PLATE CONSTRUCT [NPC].pptx](https://cdn.slidesharecdn.com/ss_thumbnails/drarunkumardrmohamedashrafperiprostheticfrasturenail-plateconstructnpc-260209164459-7e9d15a1-thumbnail.jpg?width=640&height=640&fit=bounds)

