Download to read offline
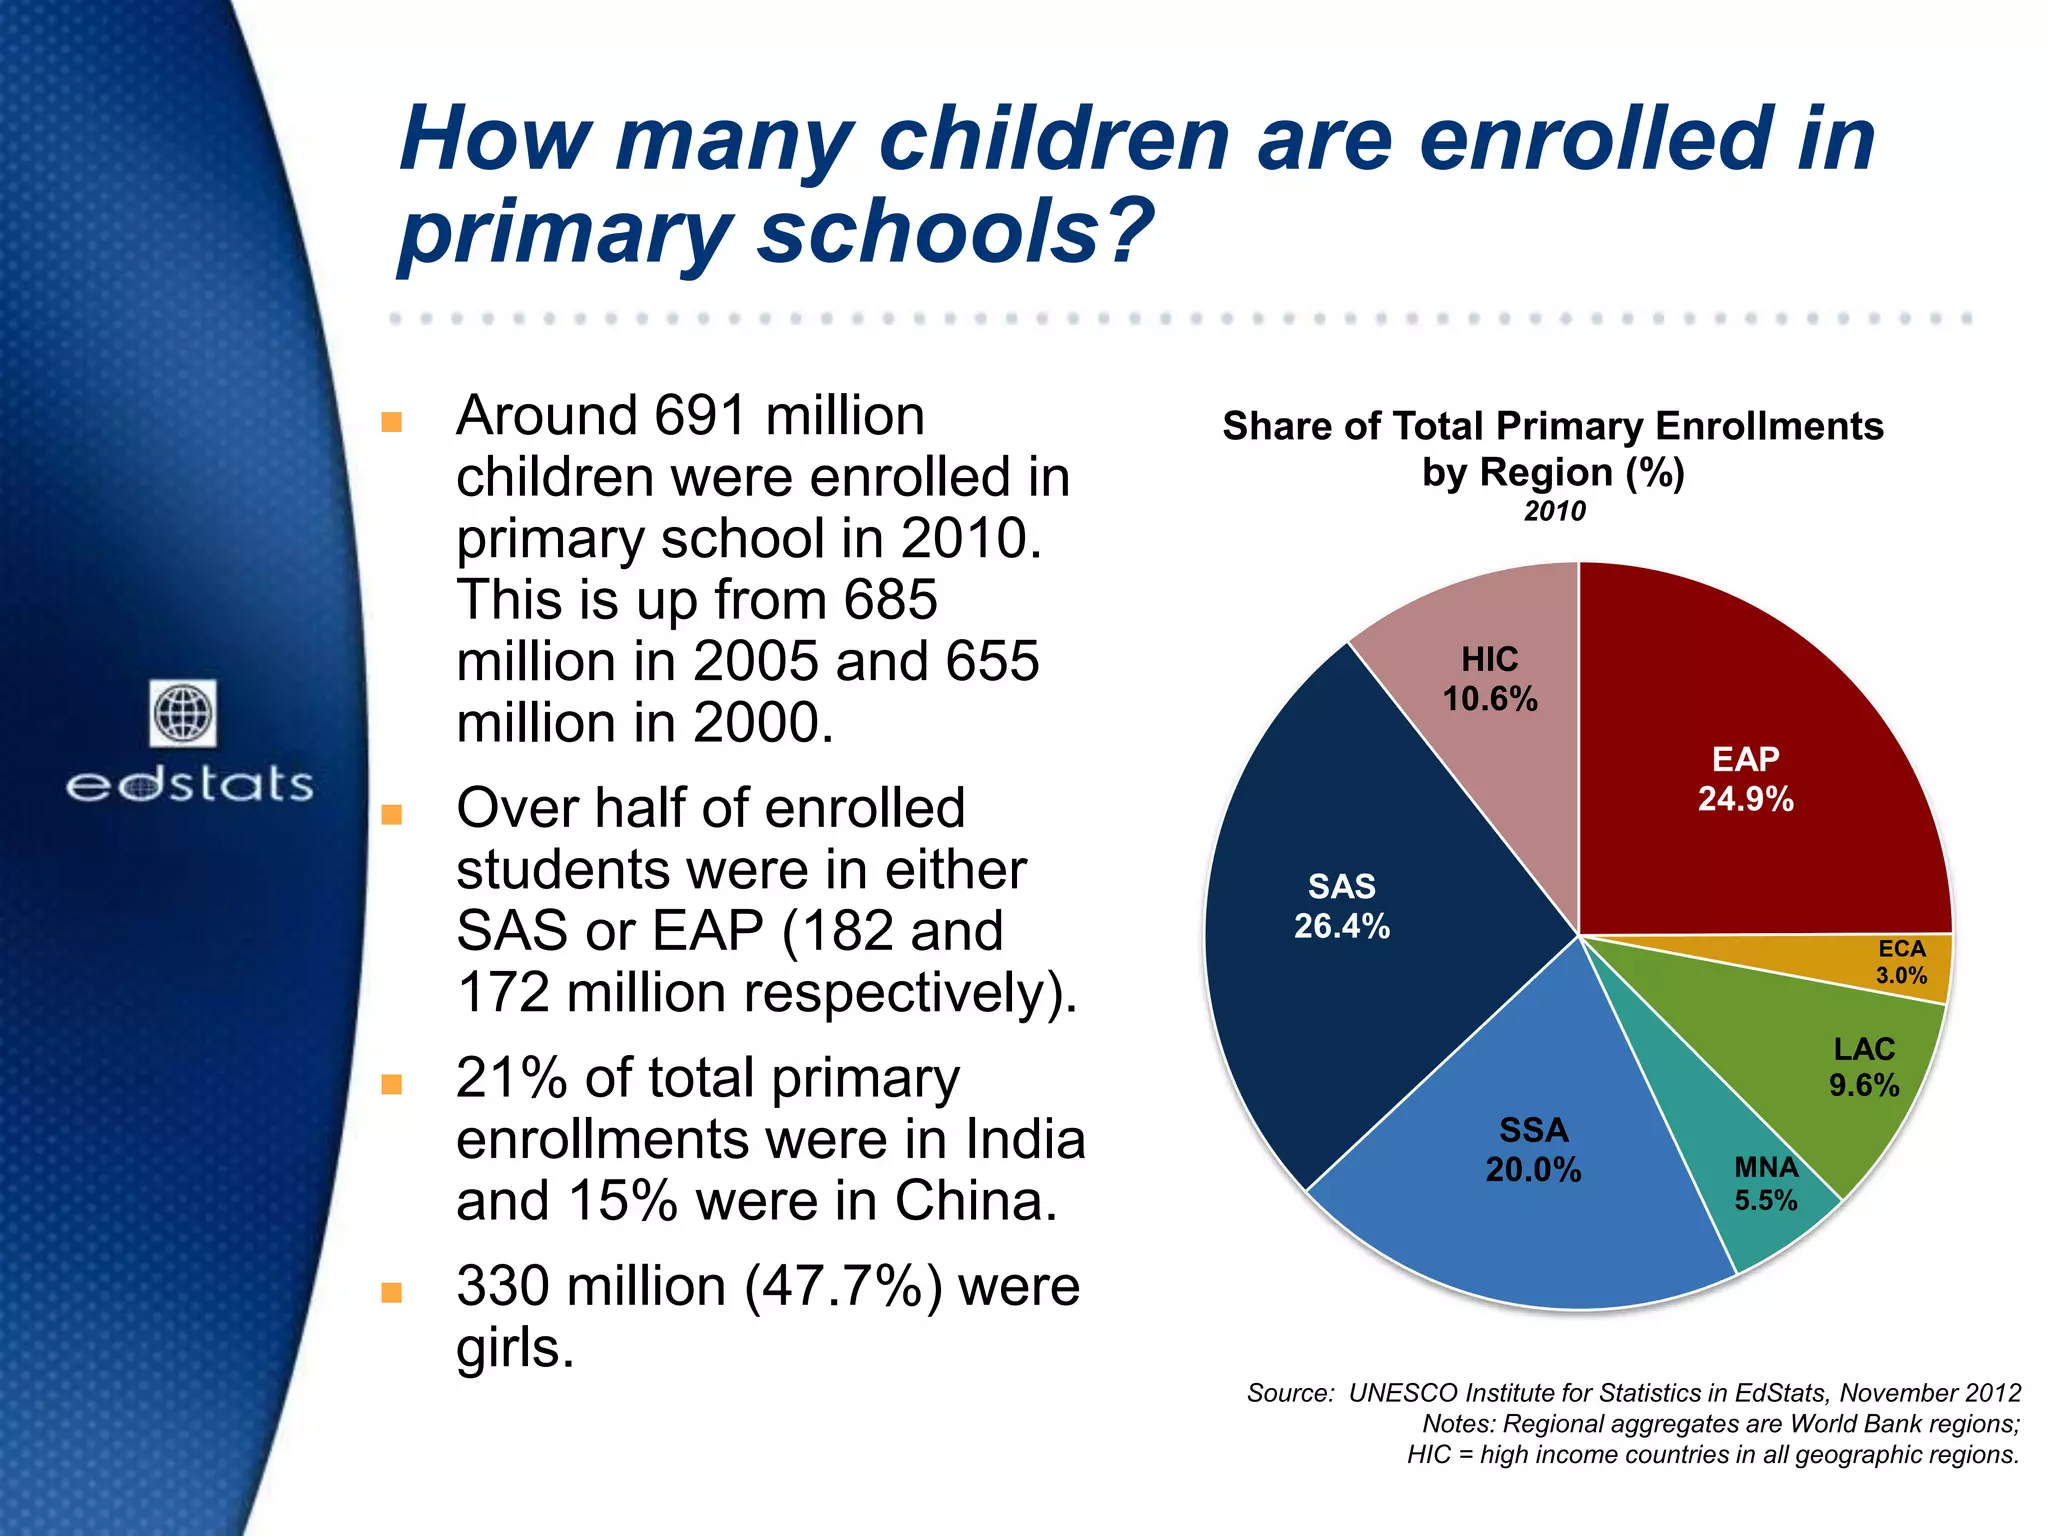

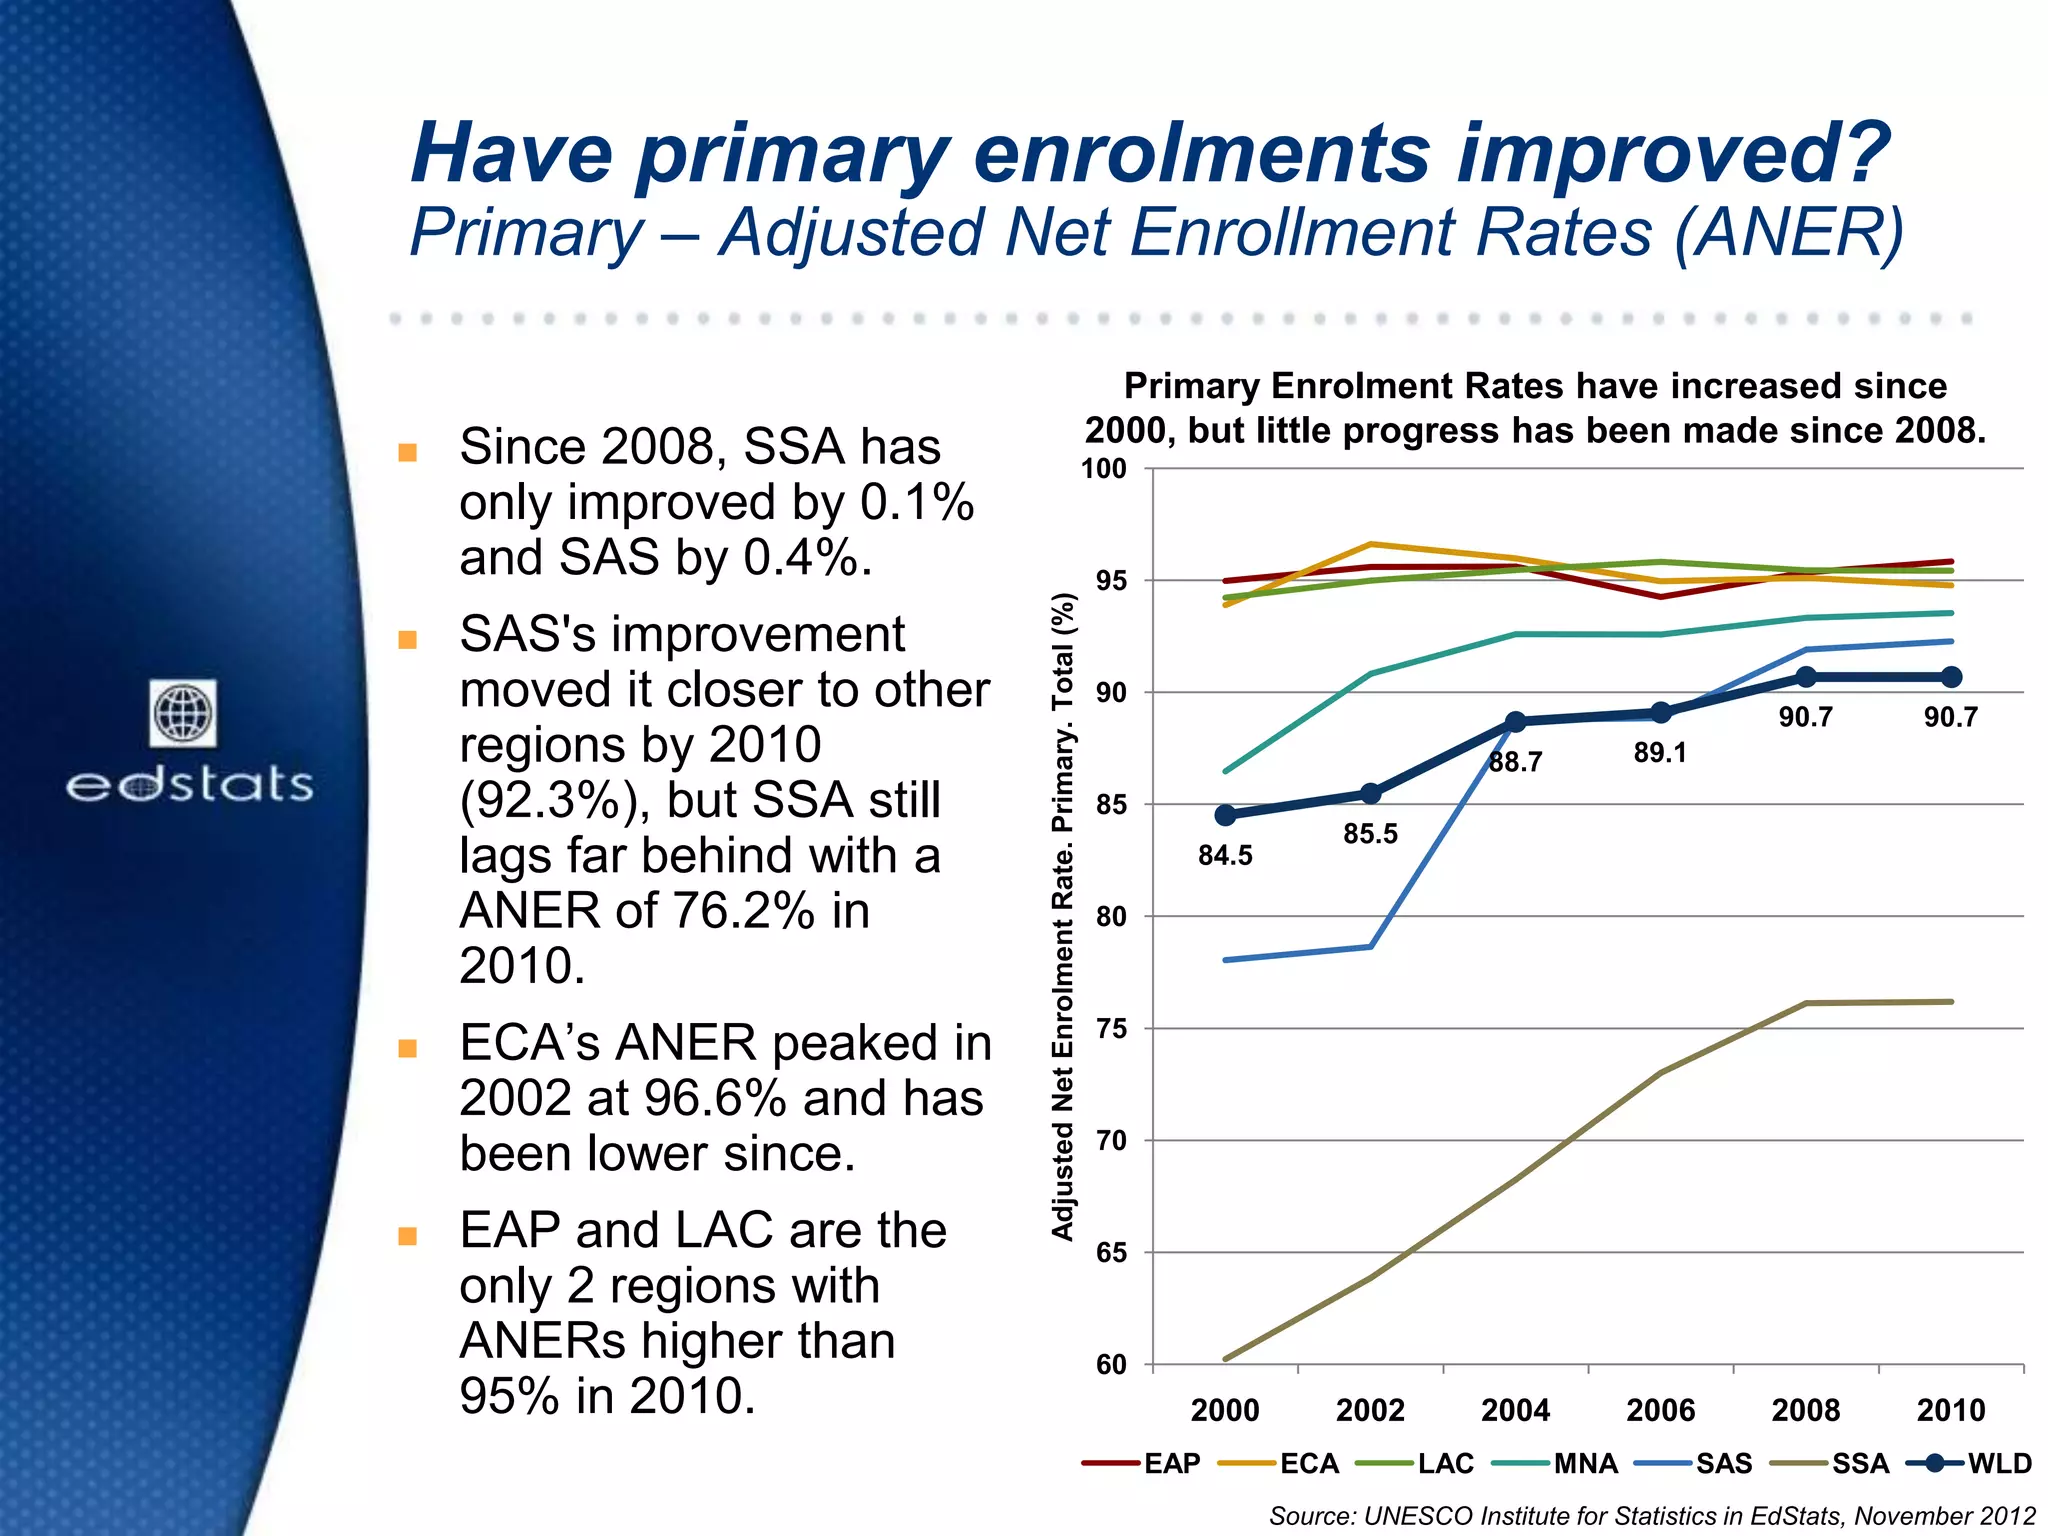
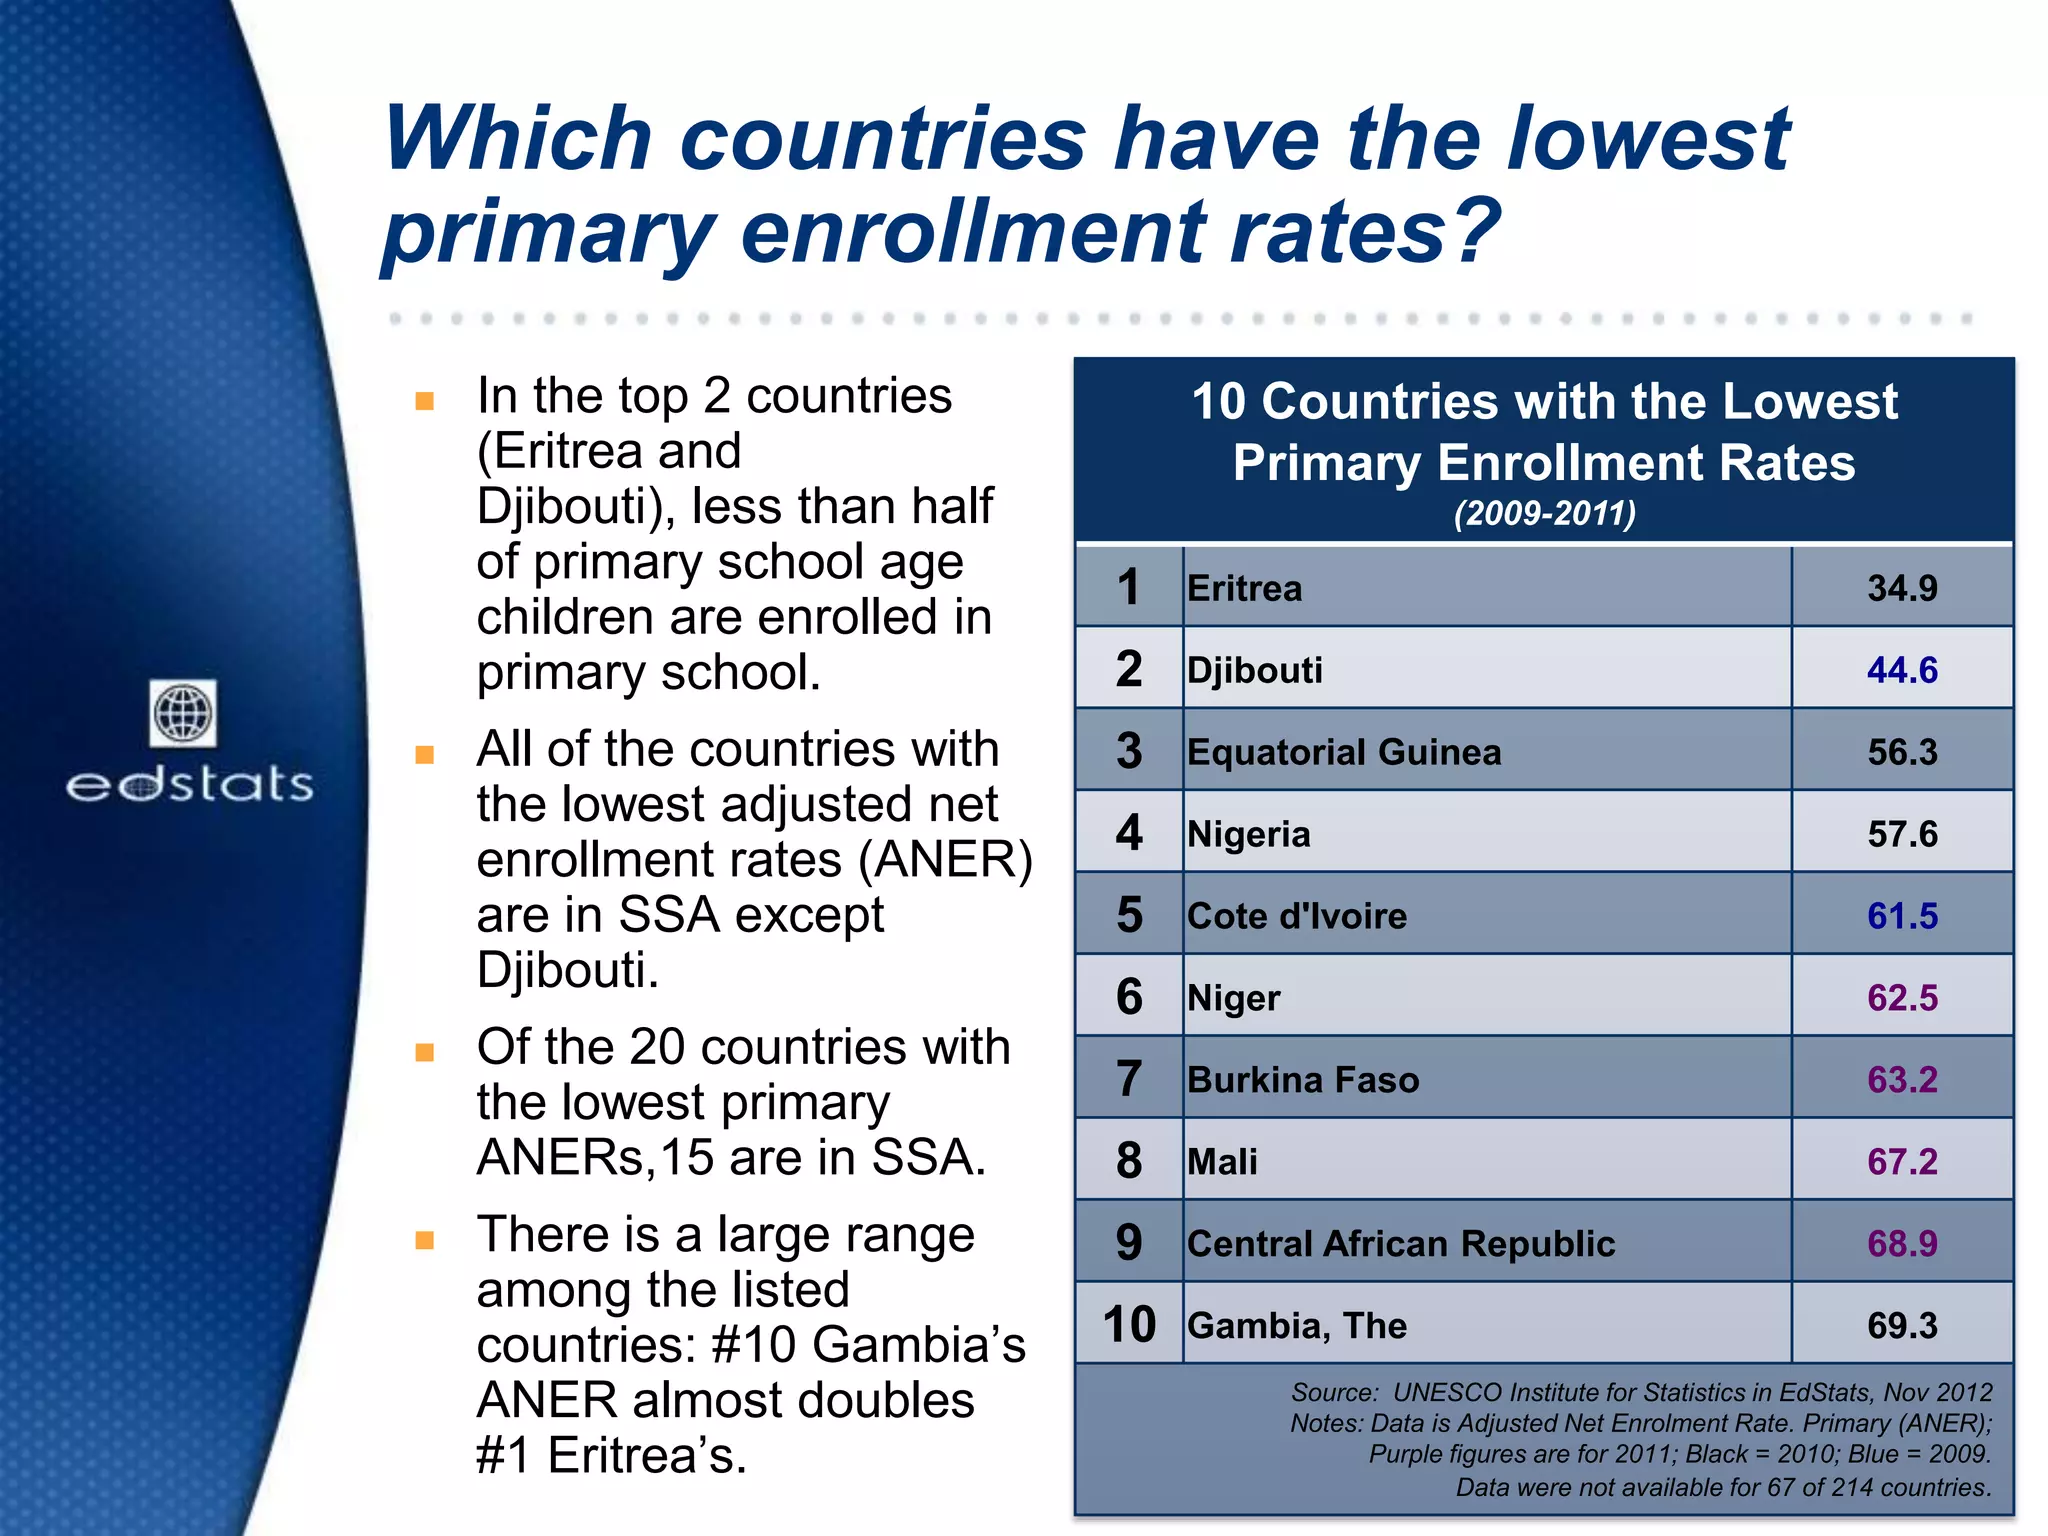
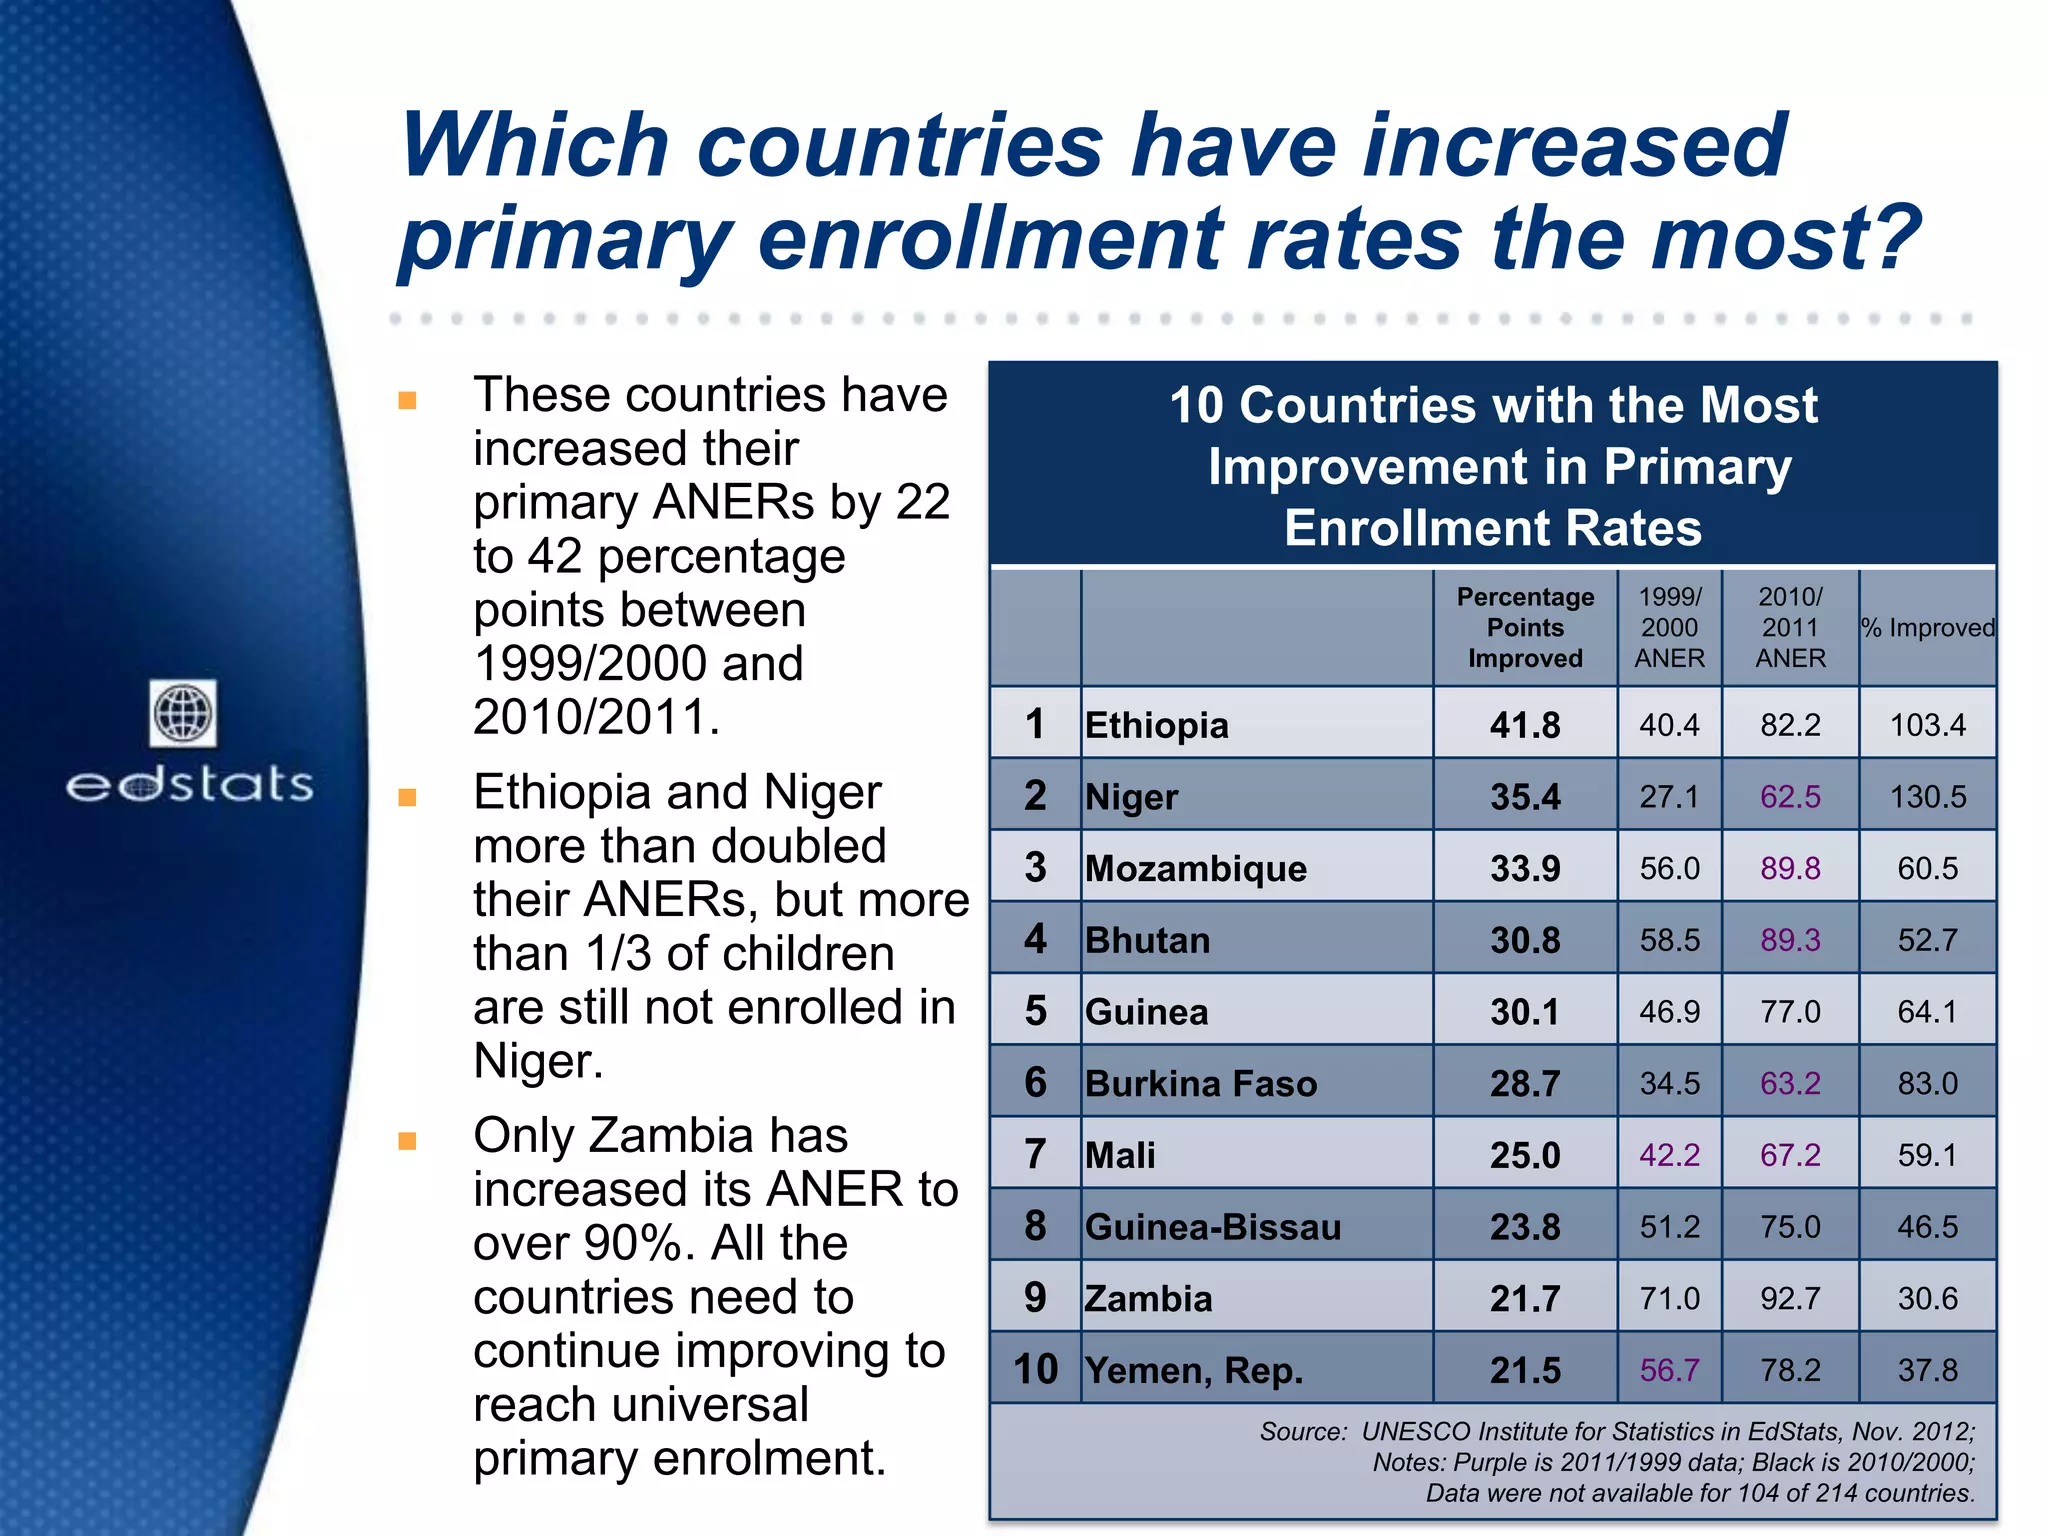
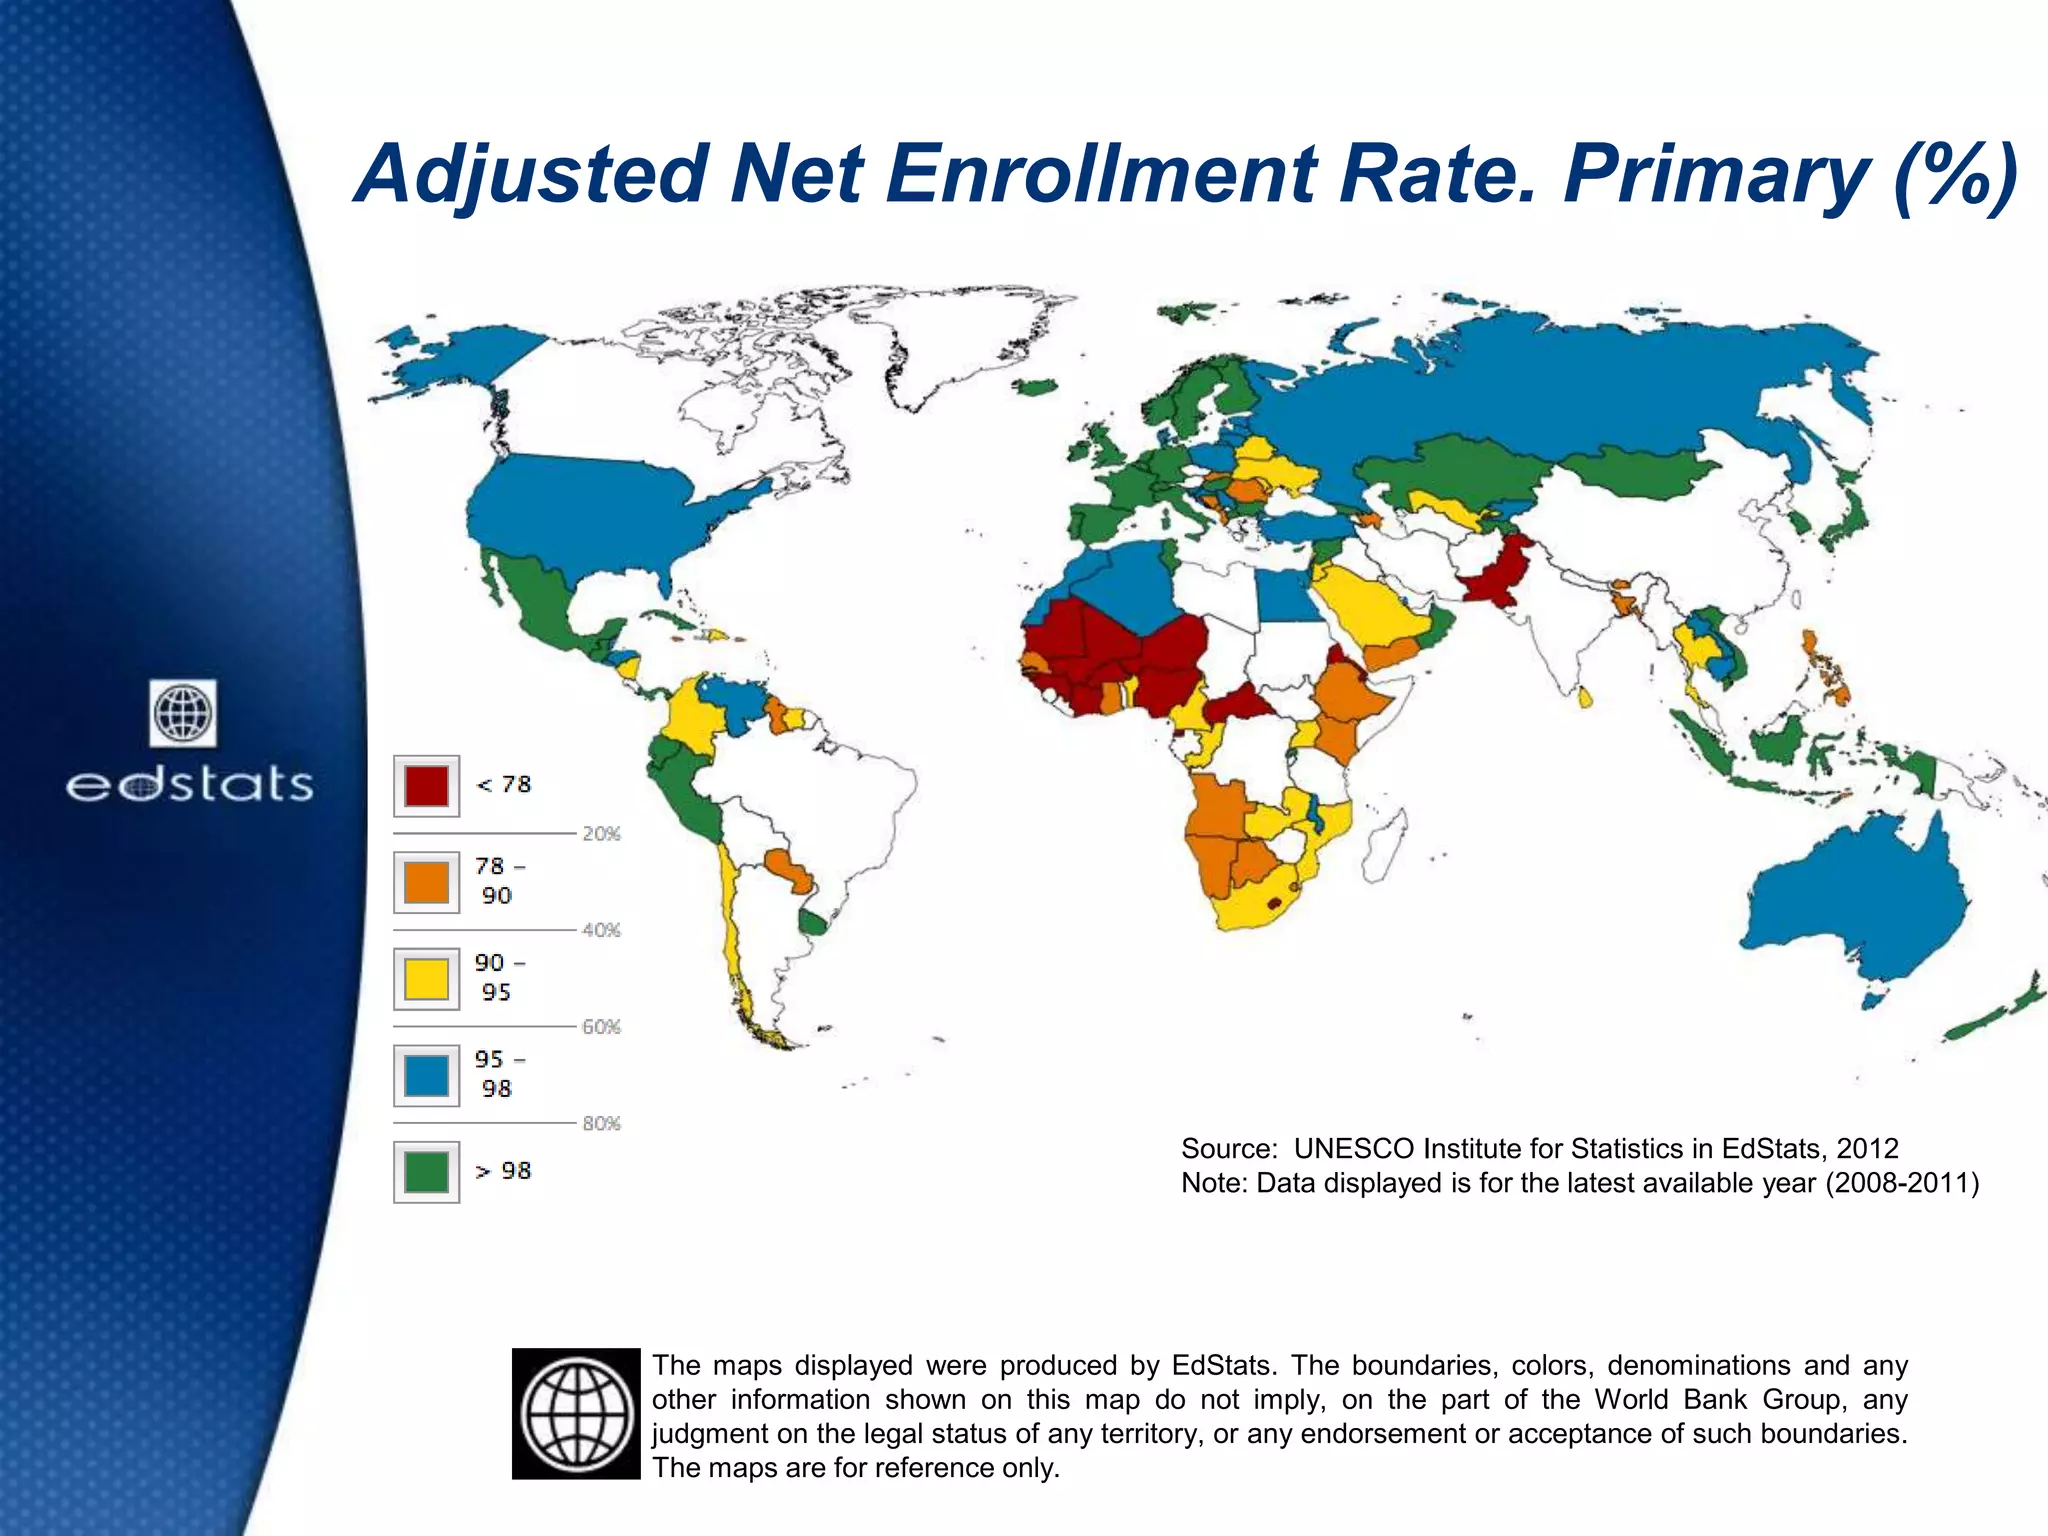
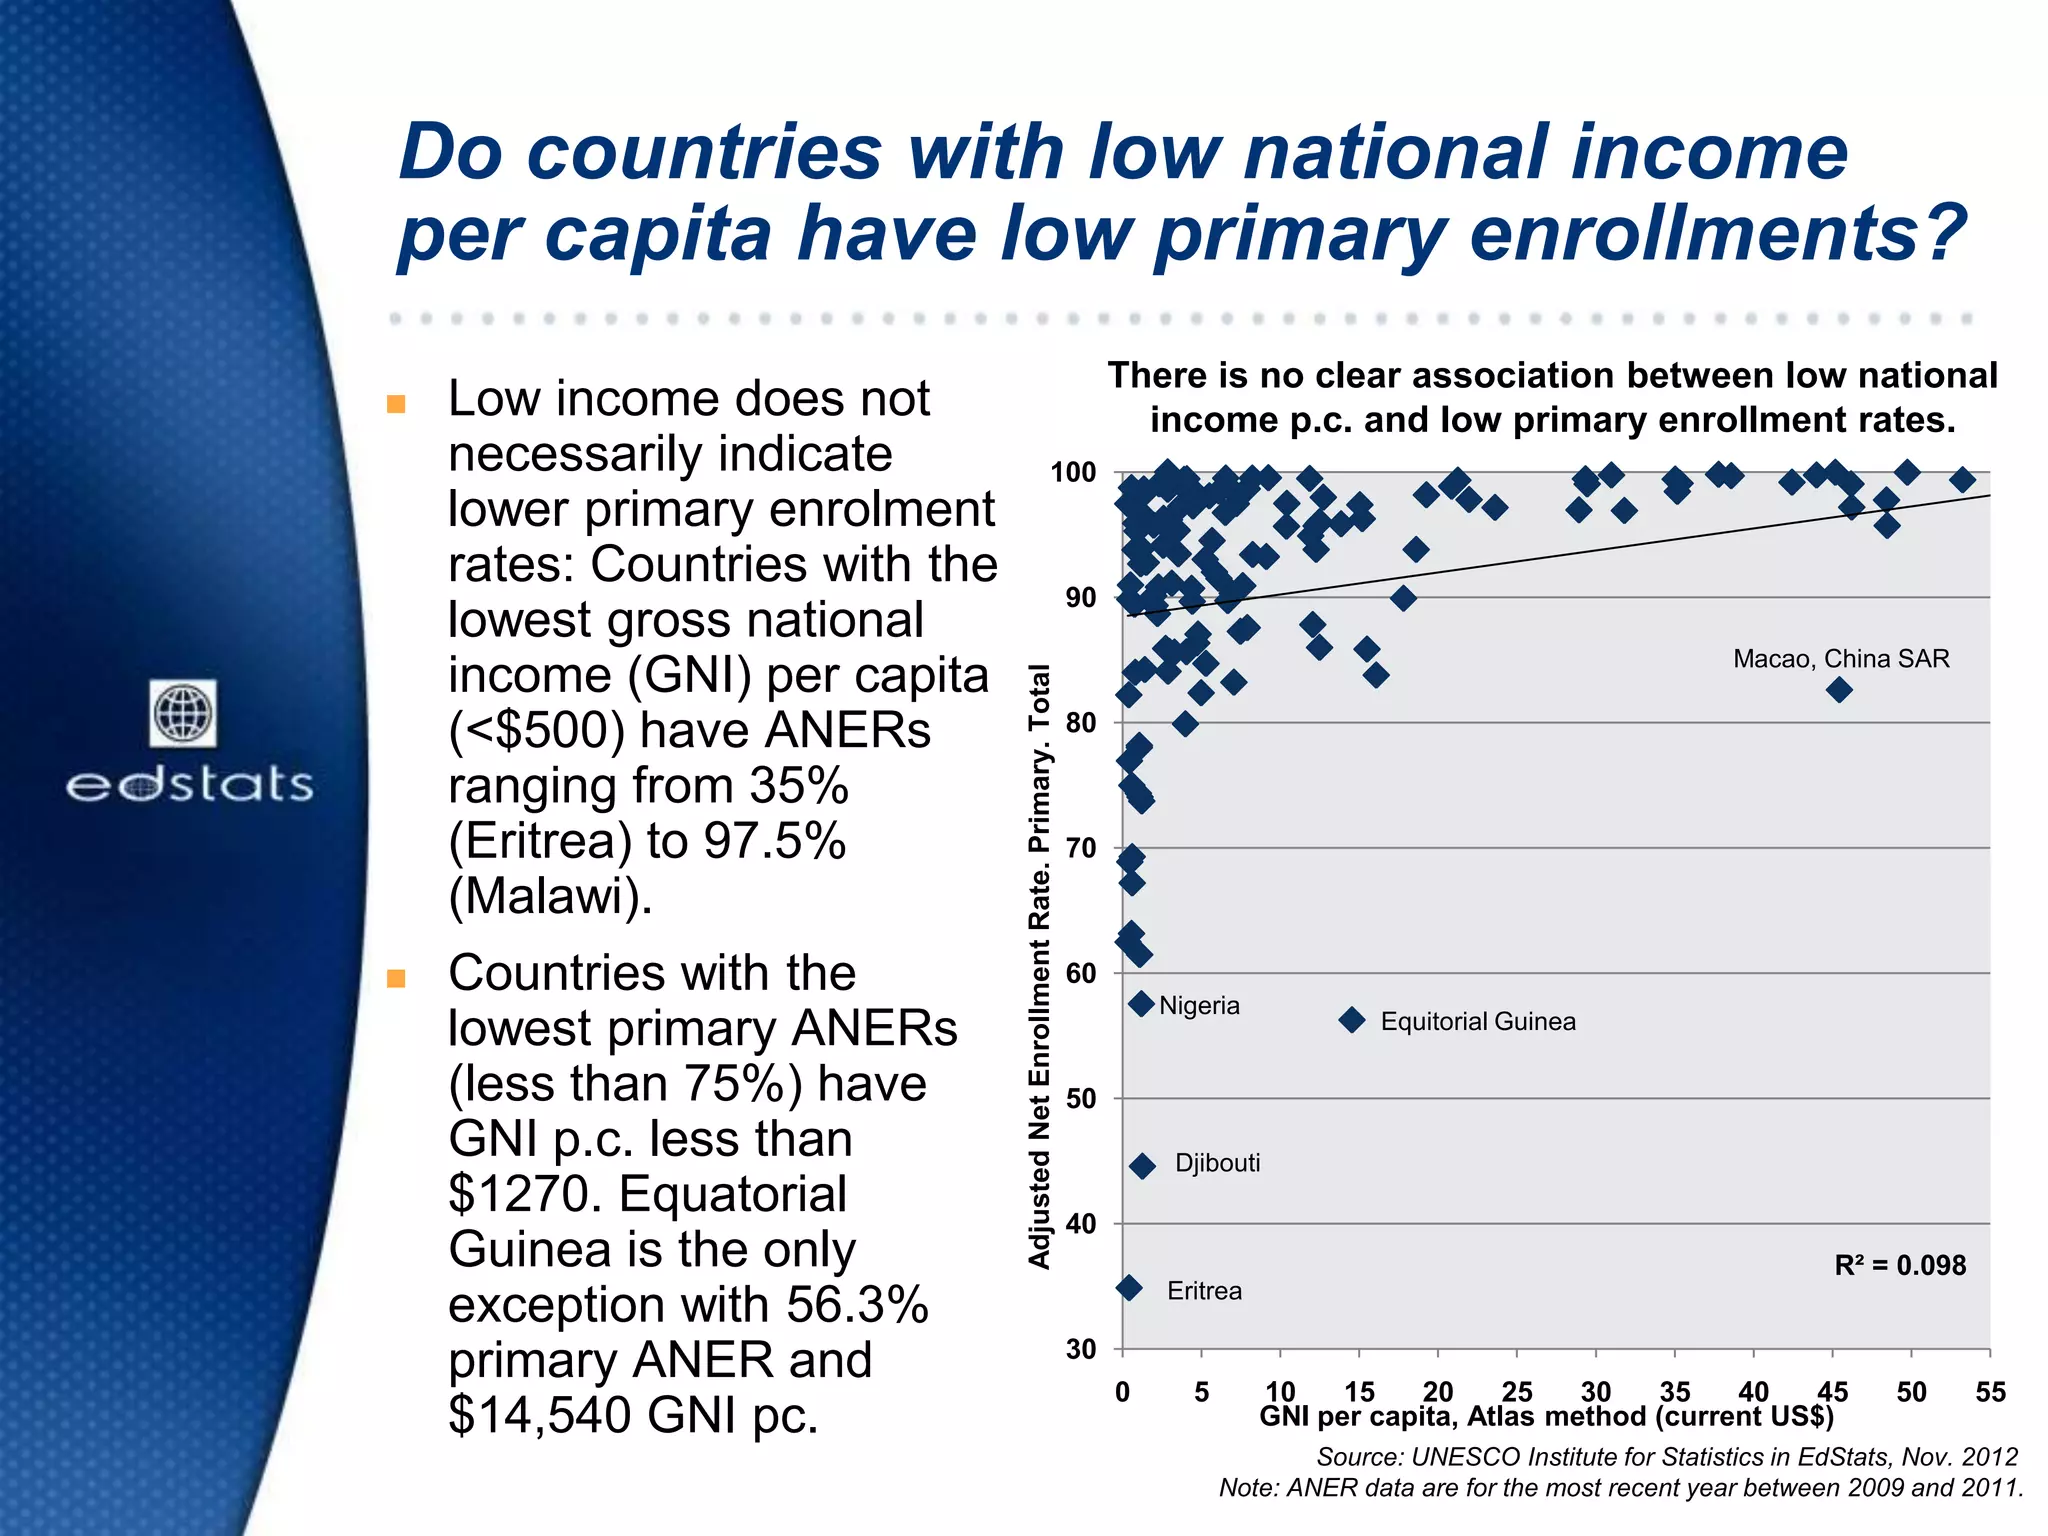
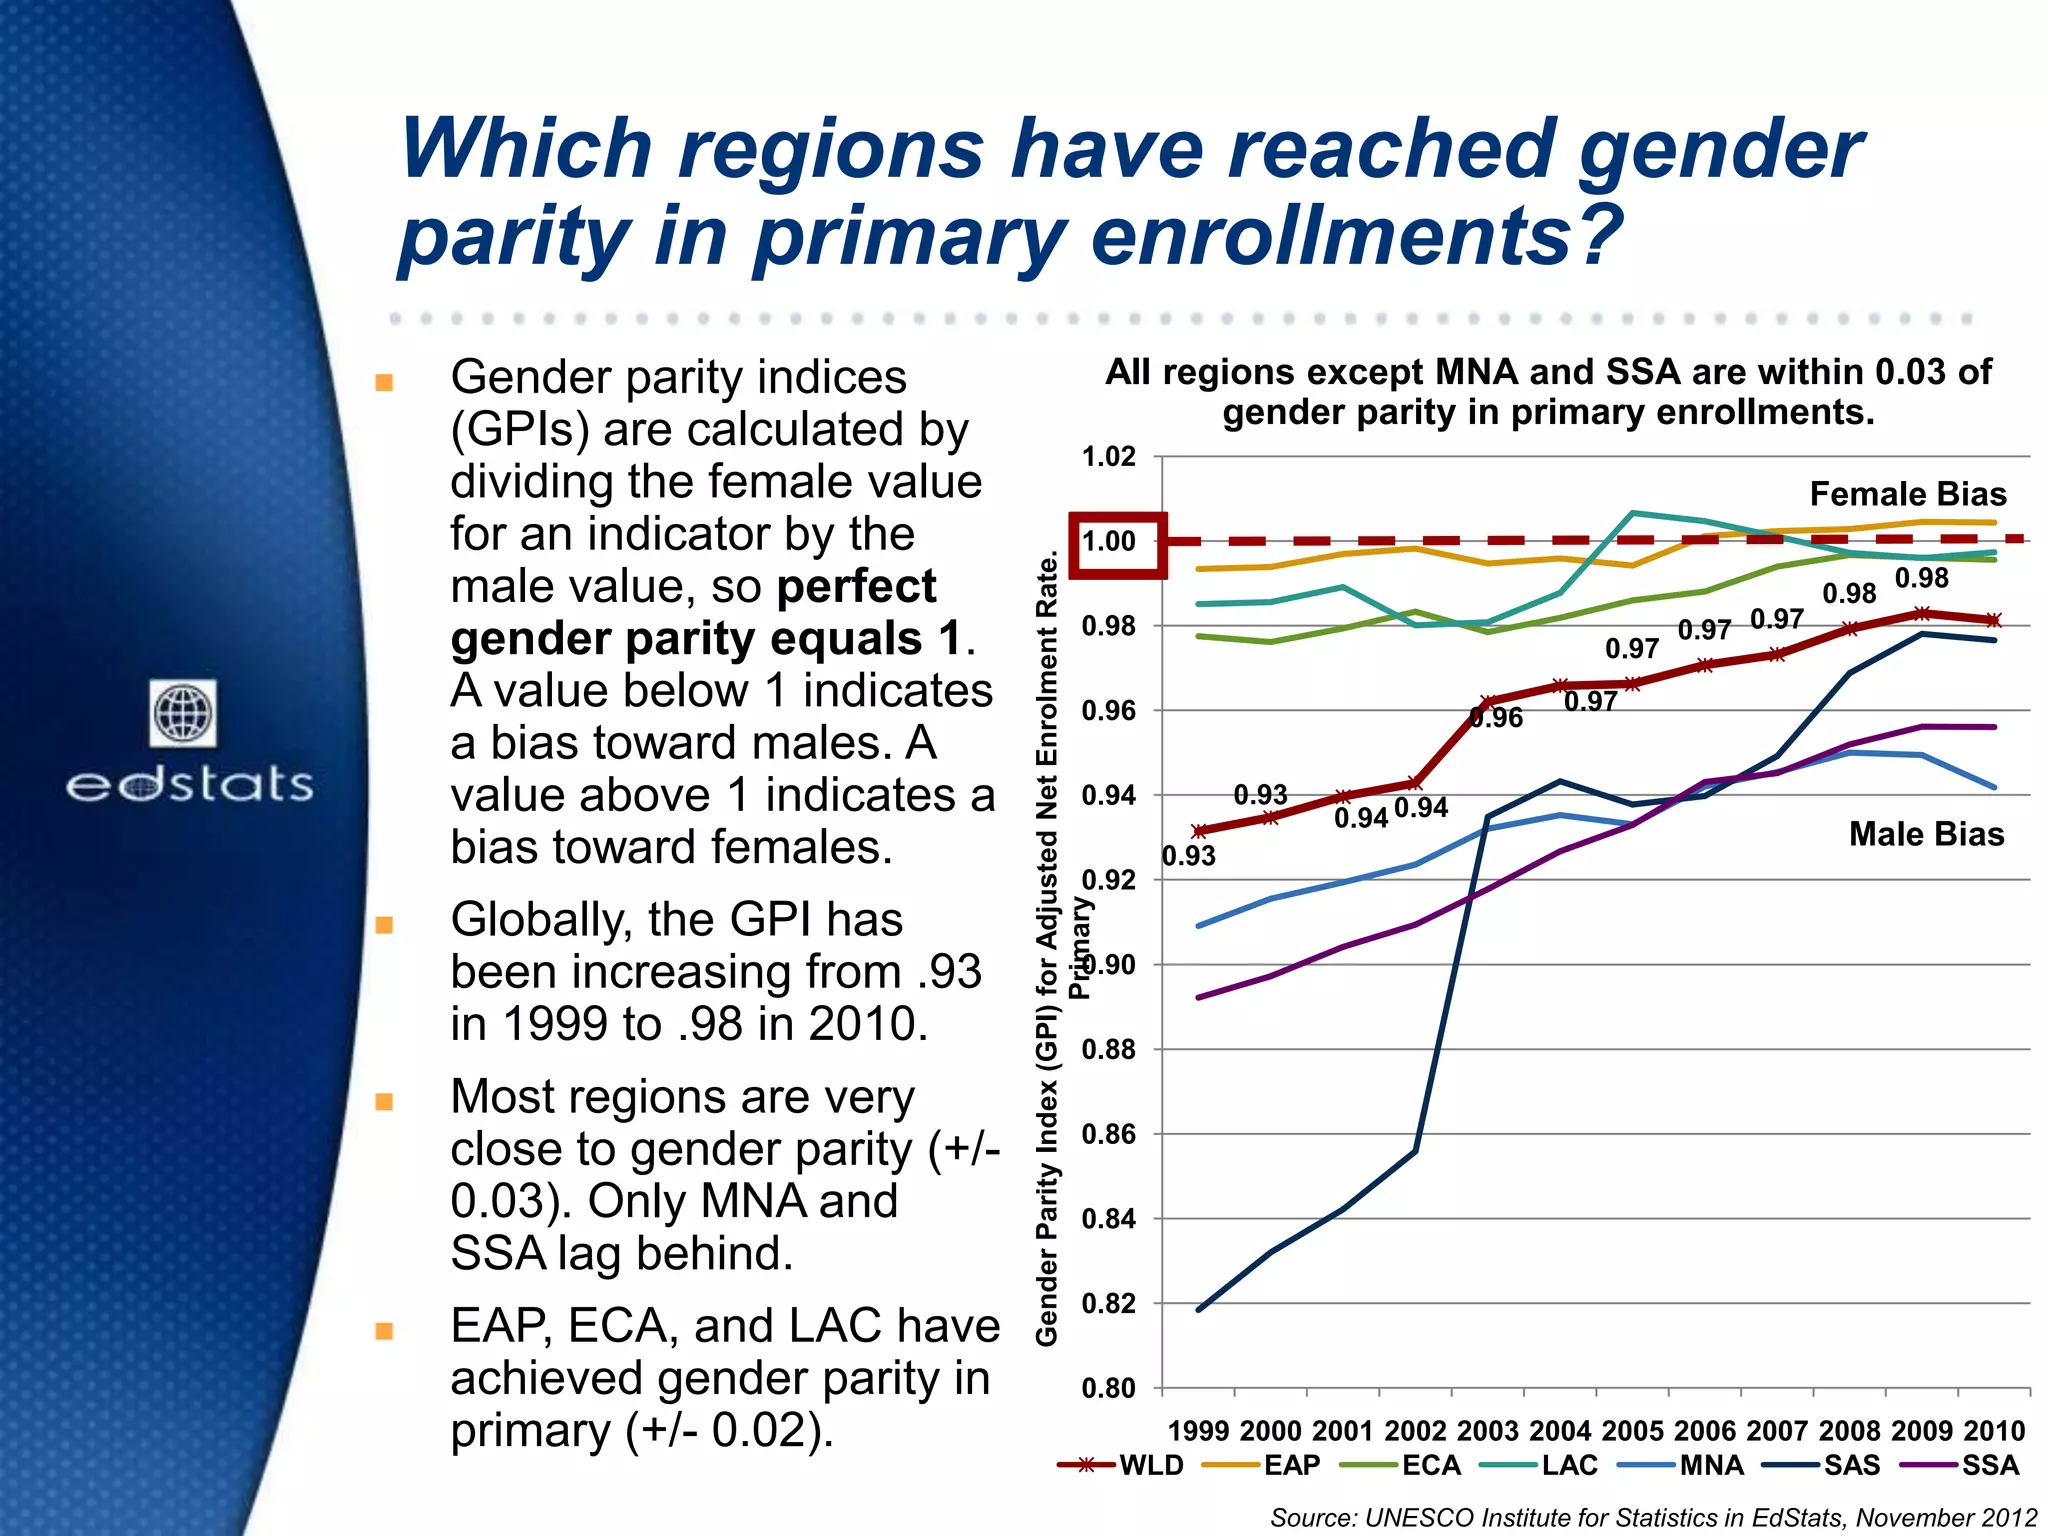
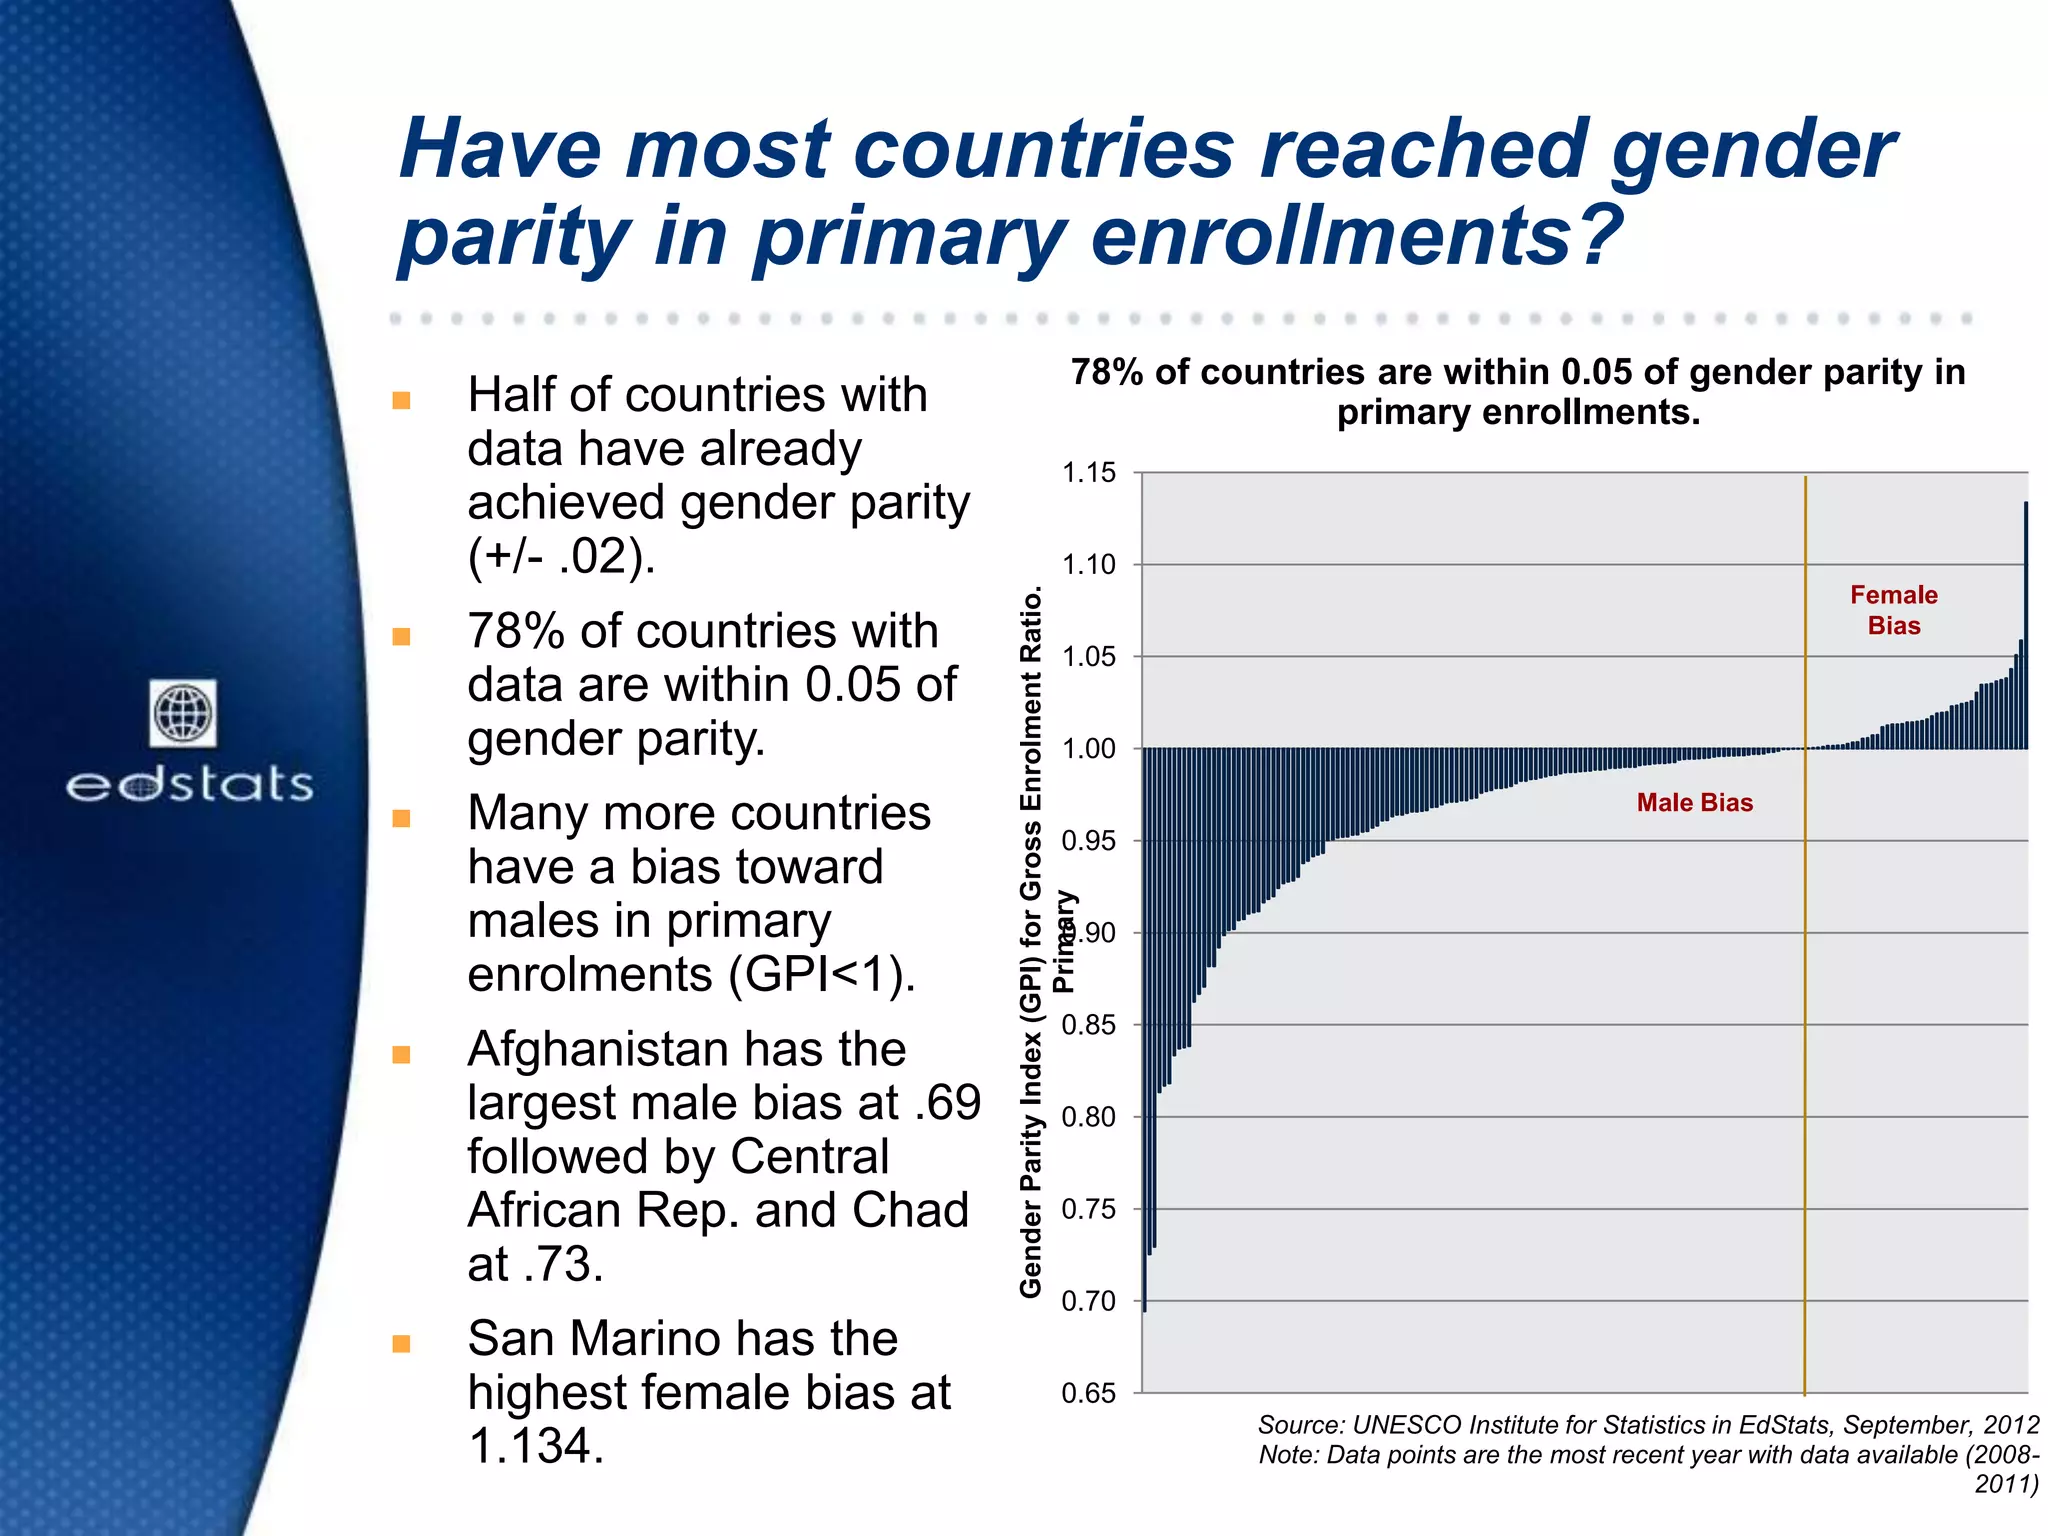

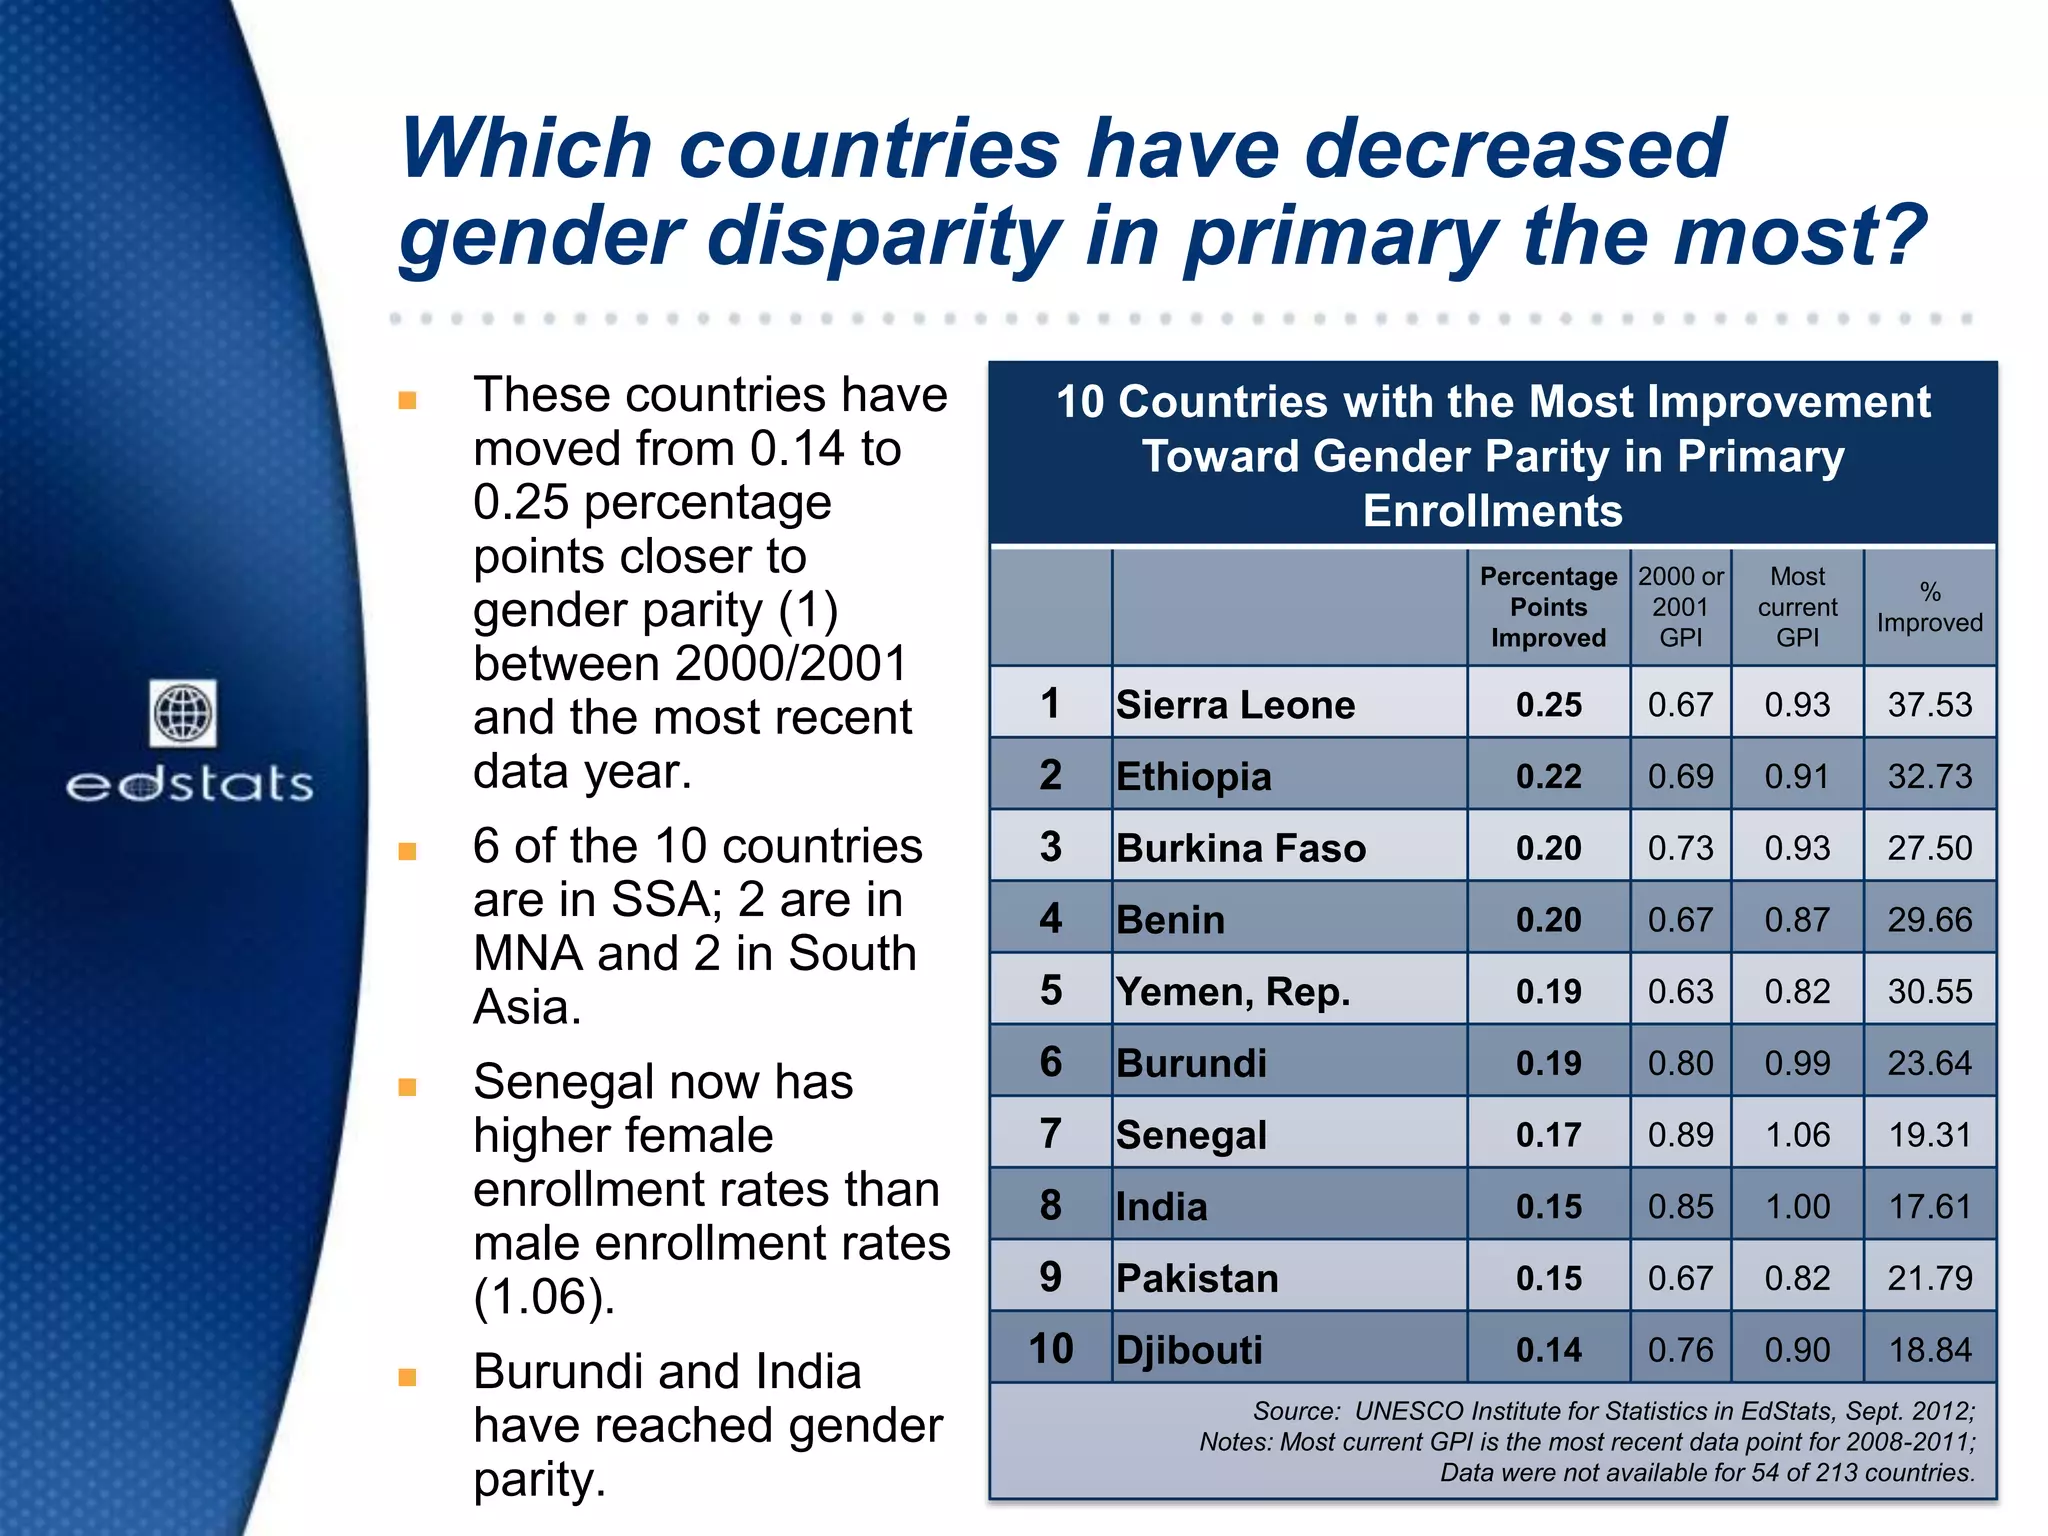
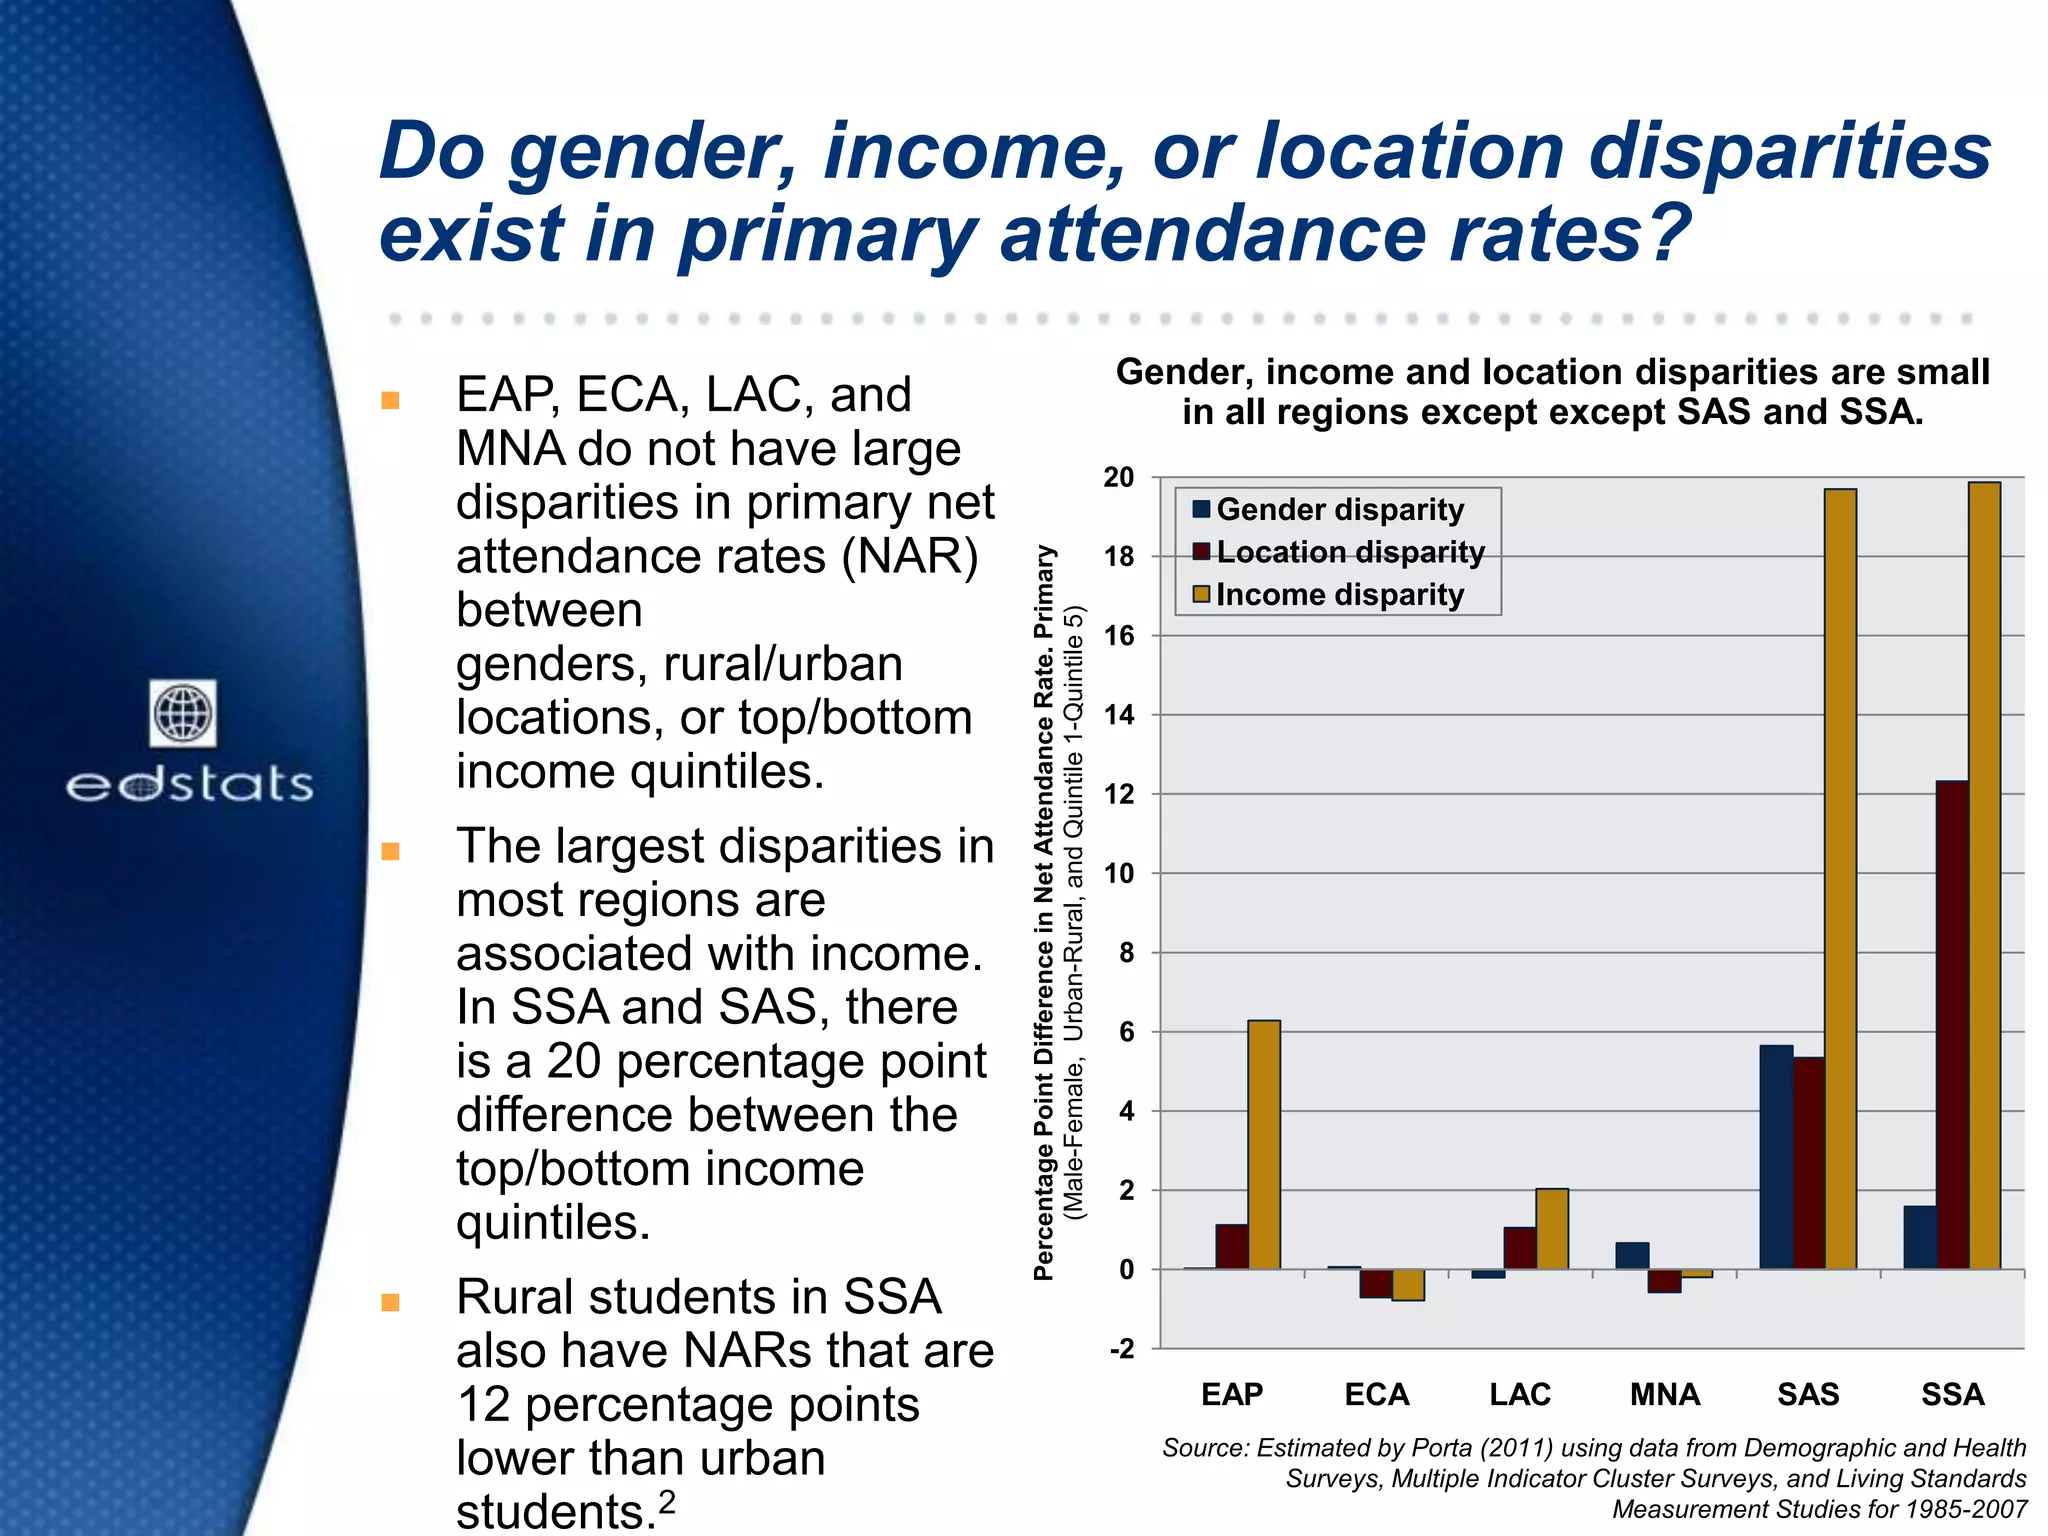


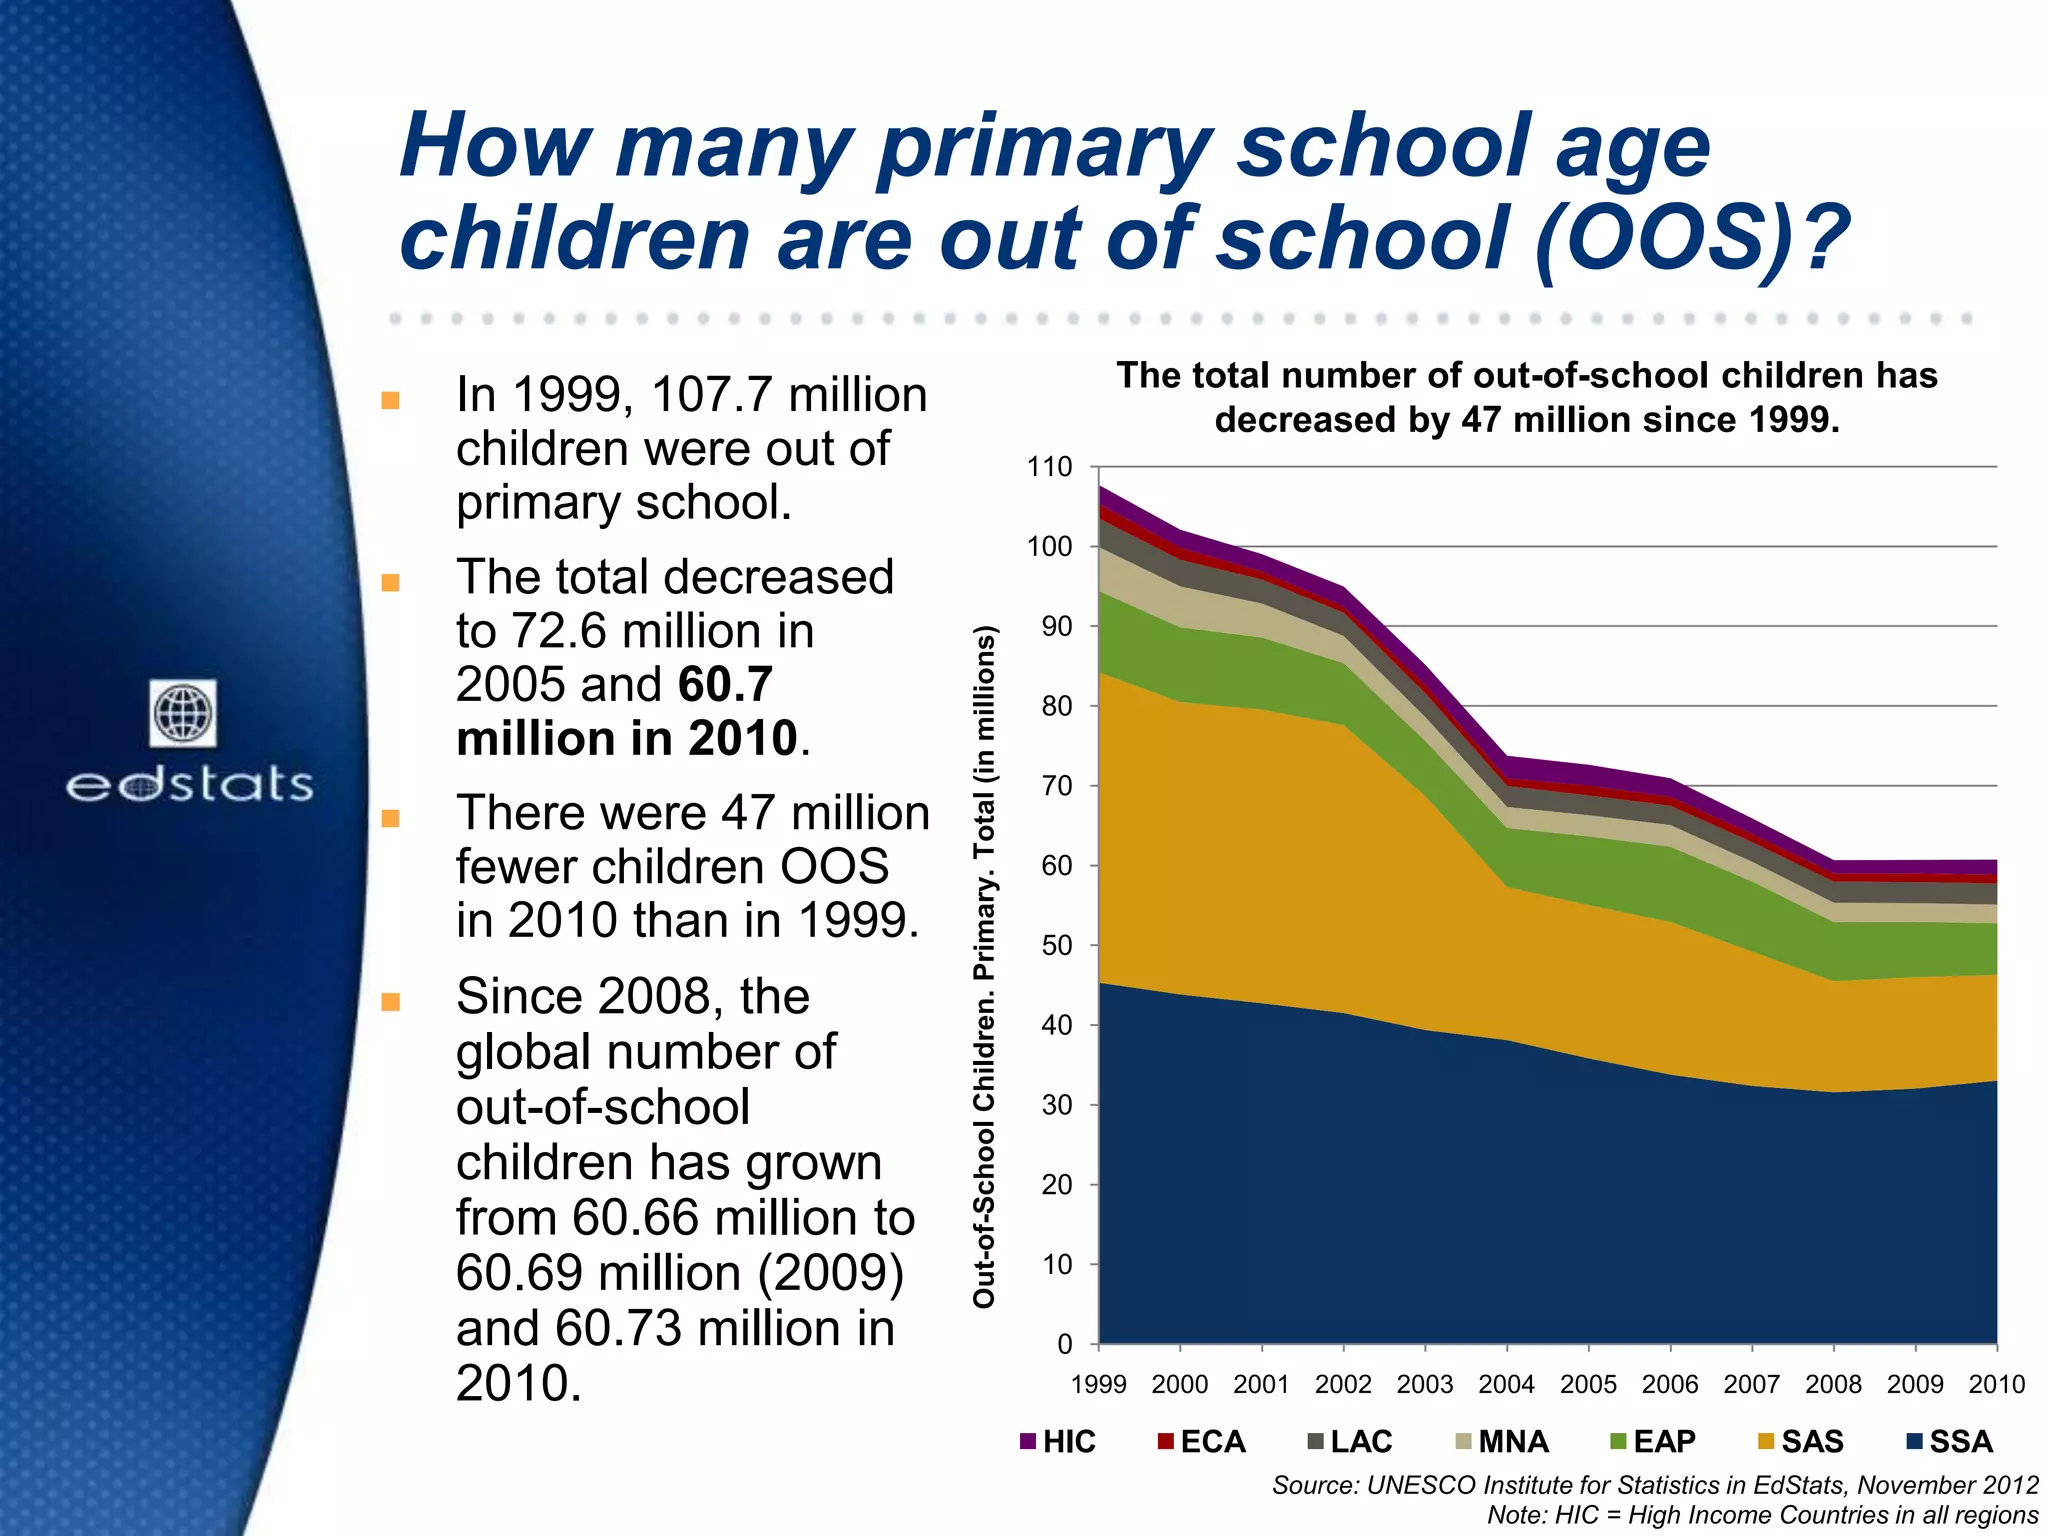
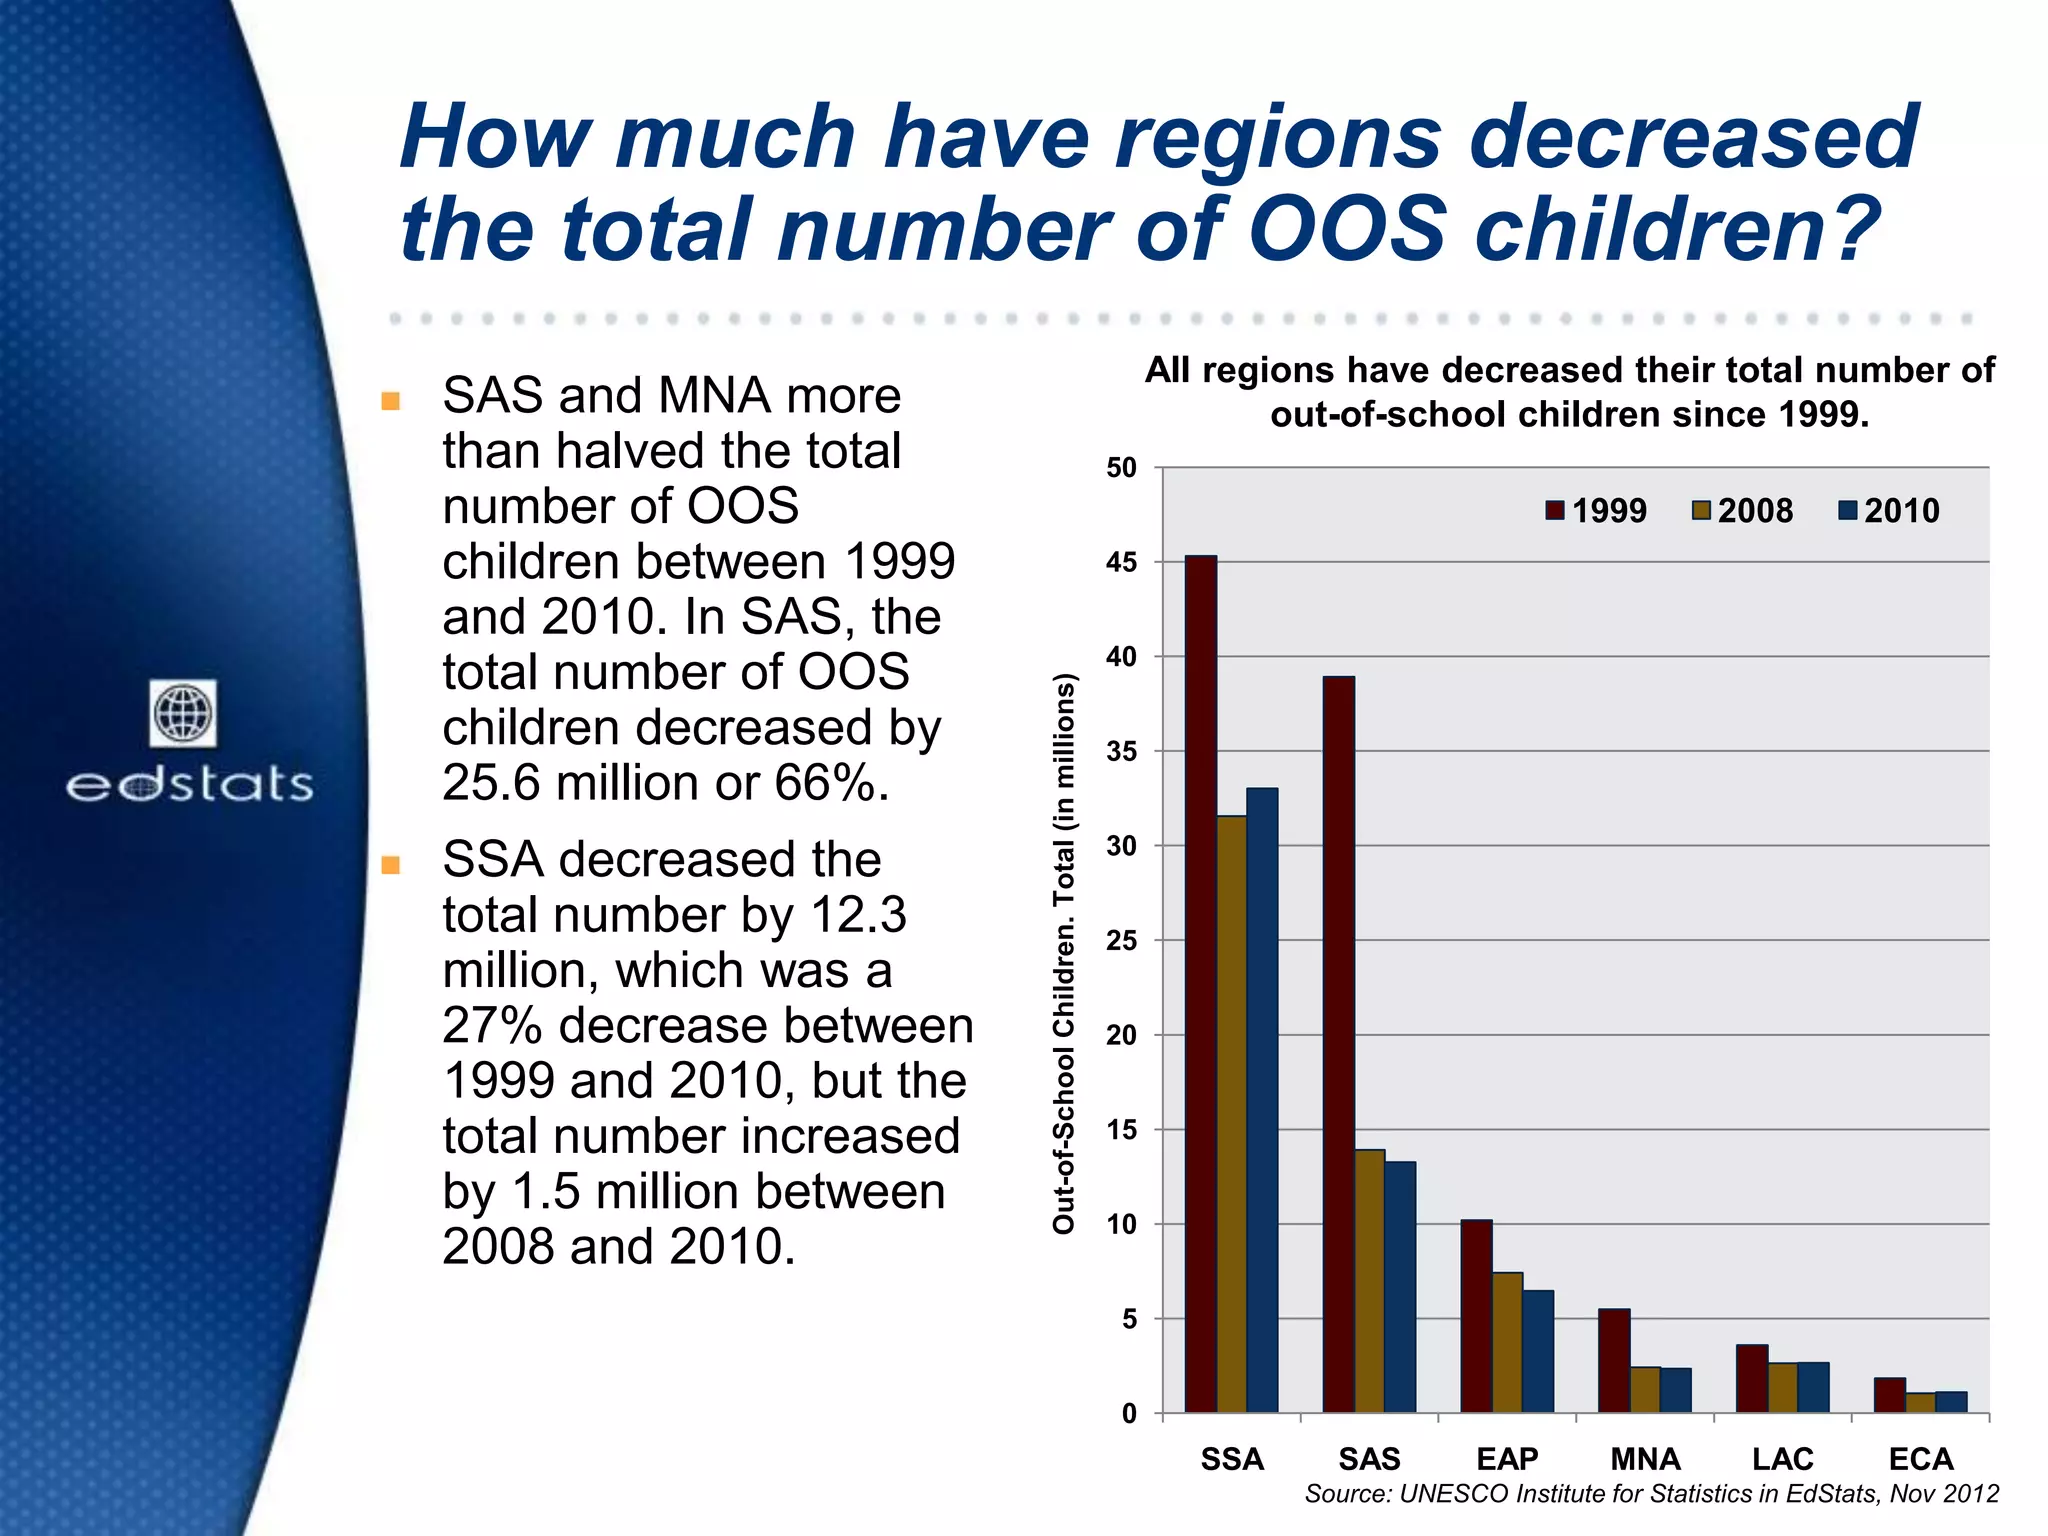
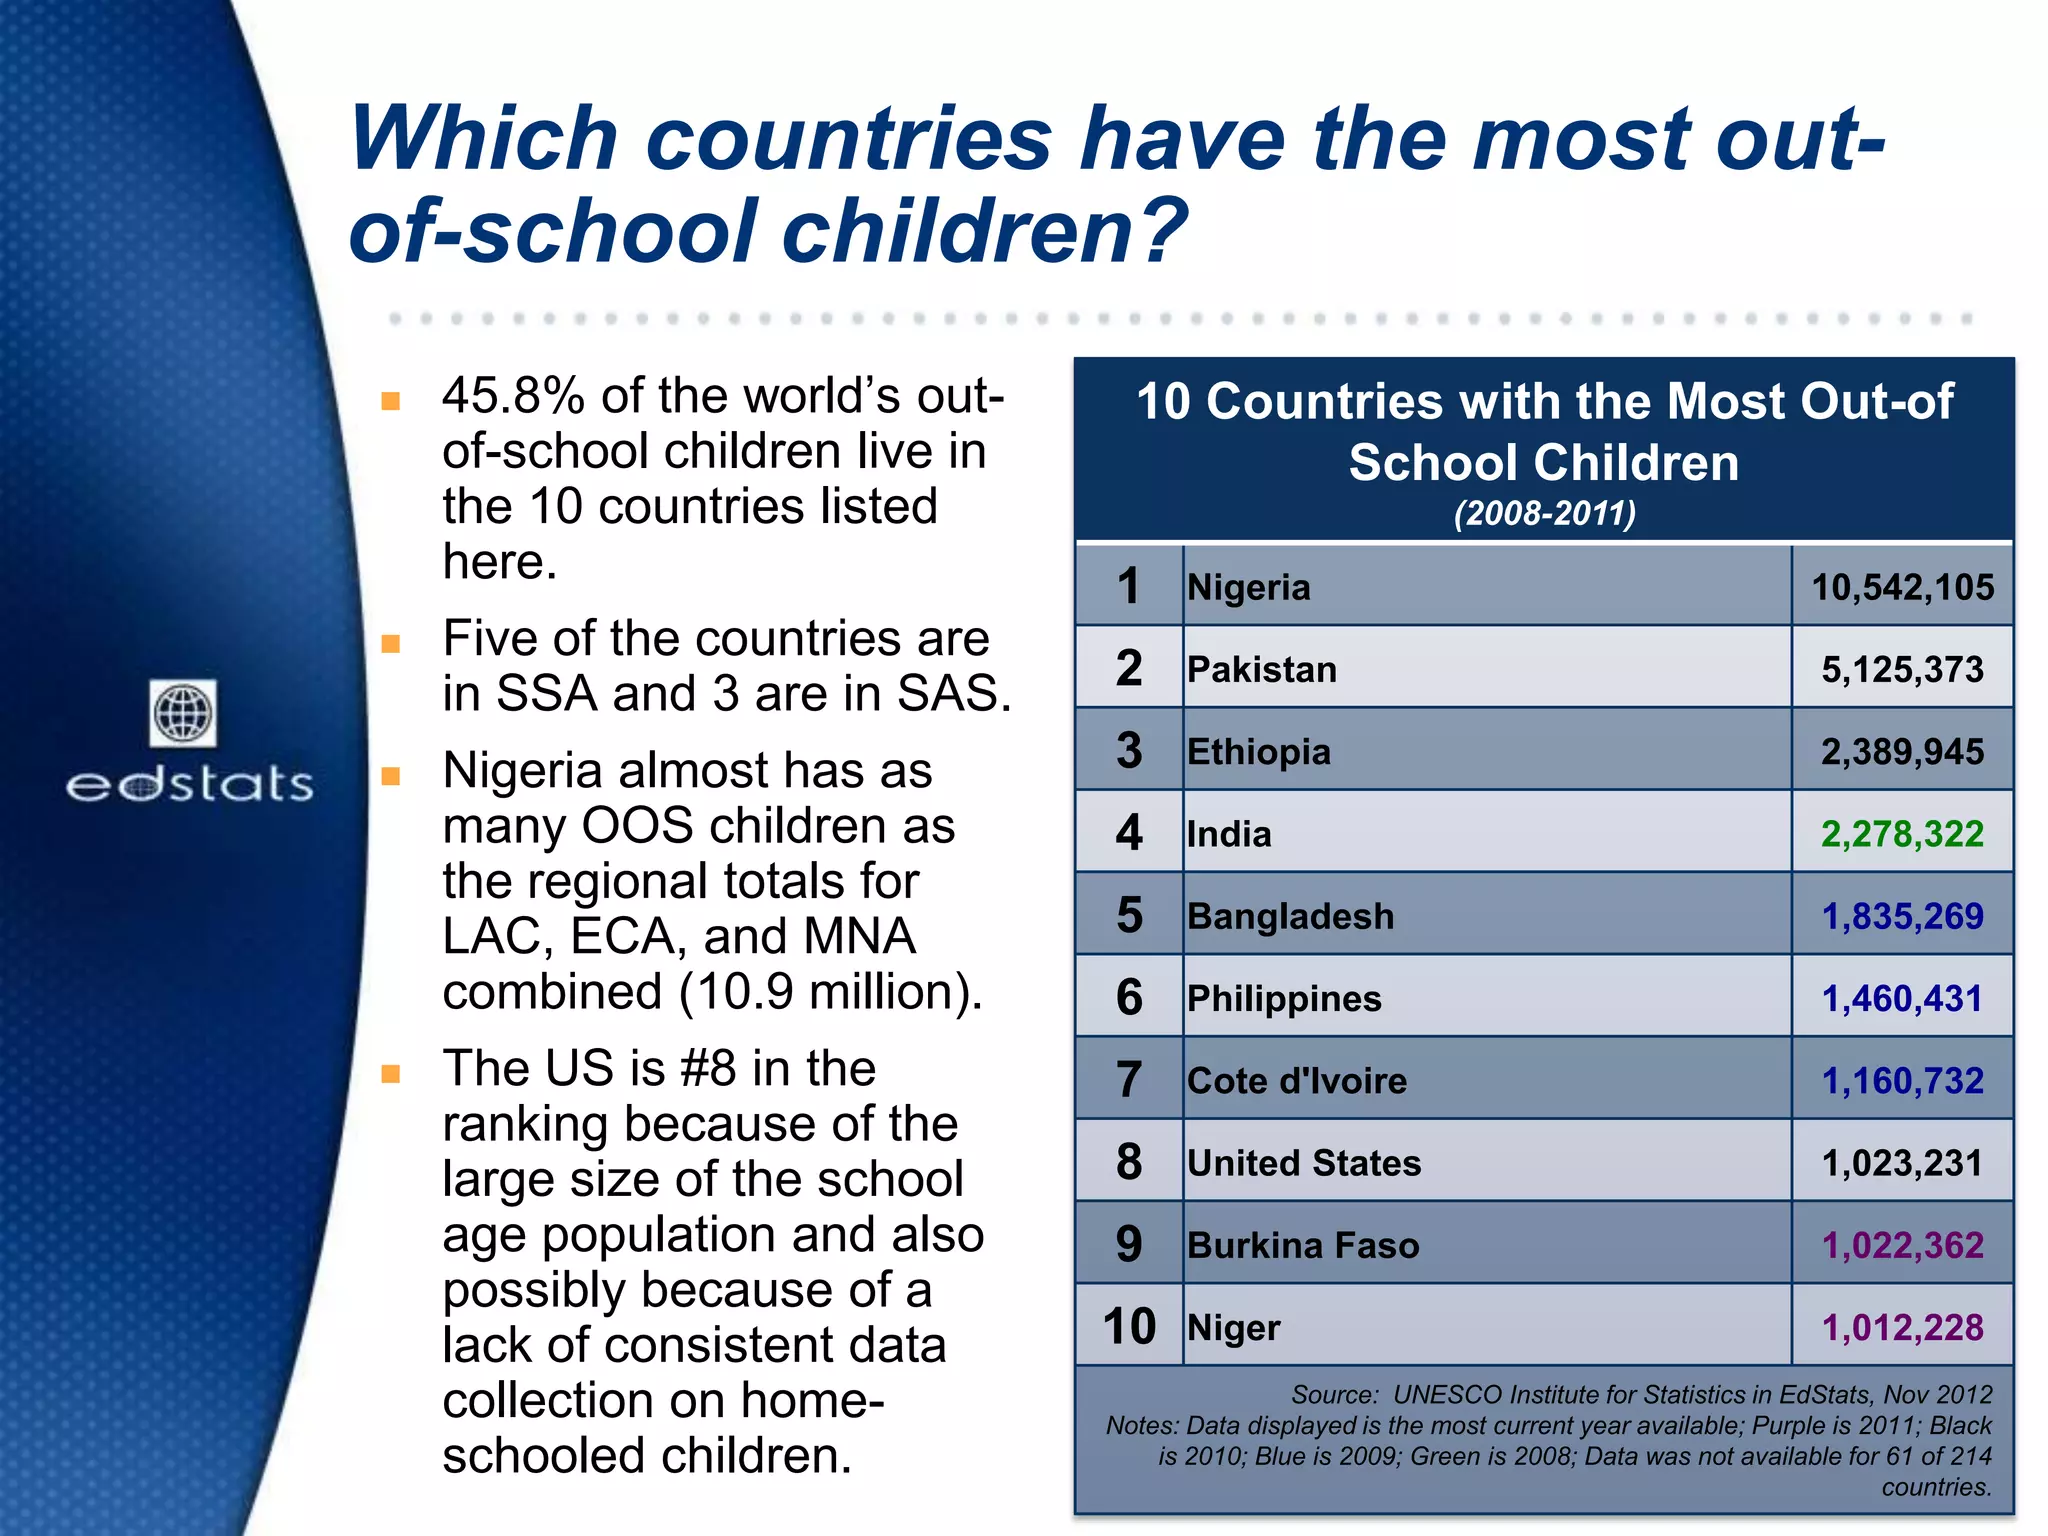

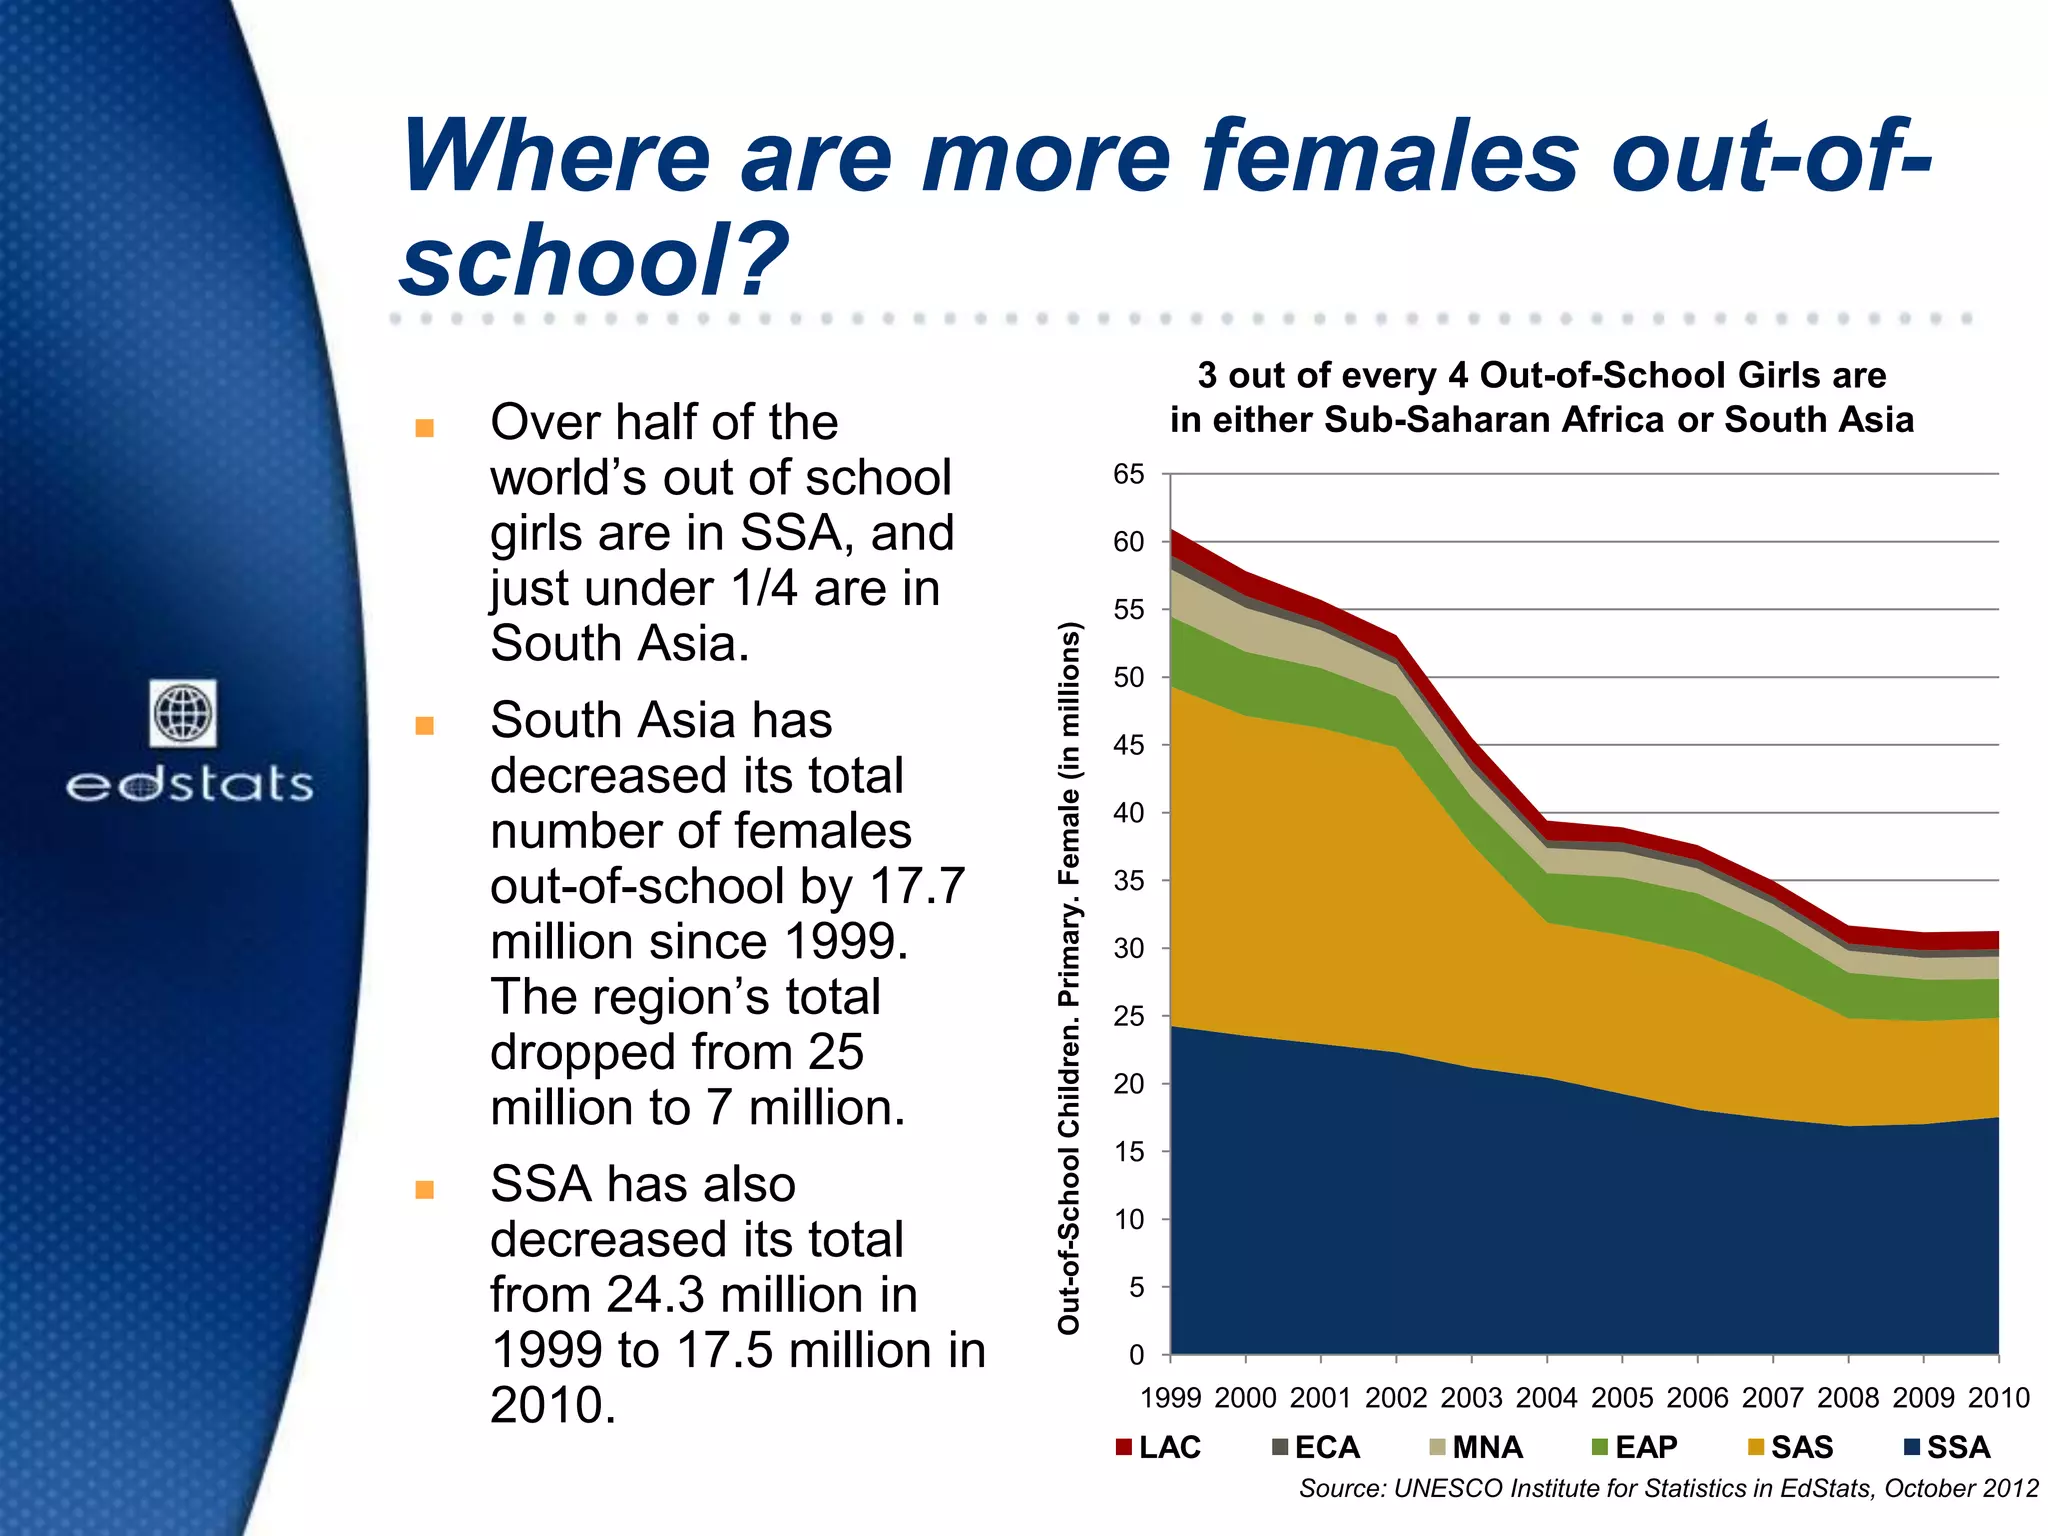

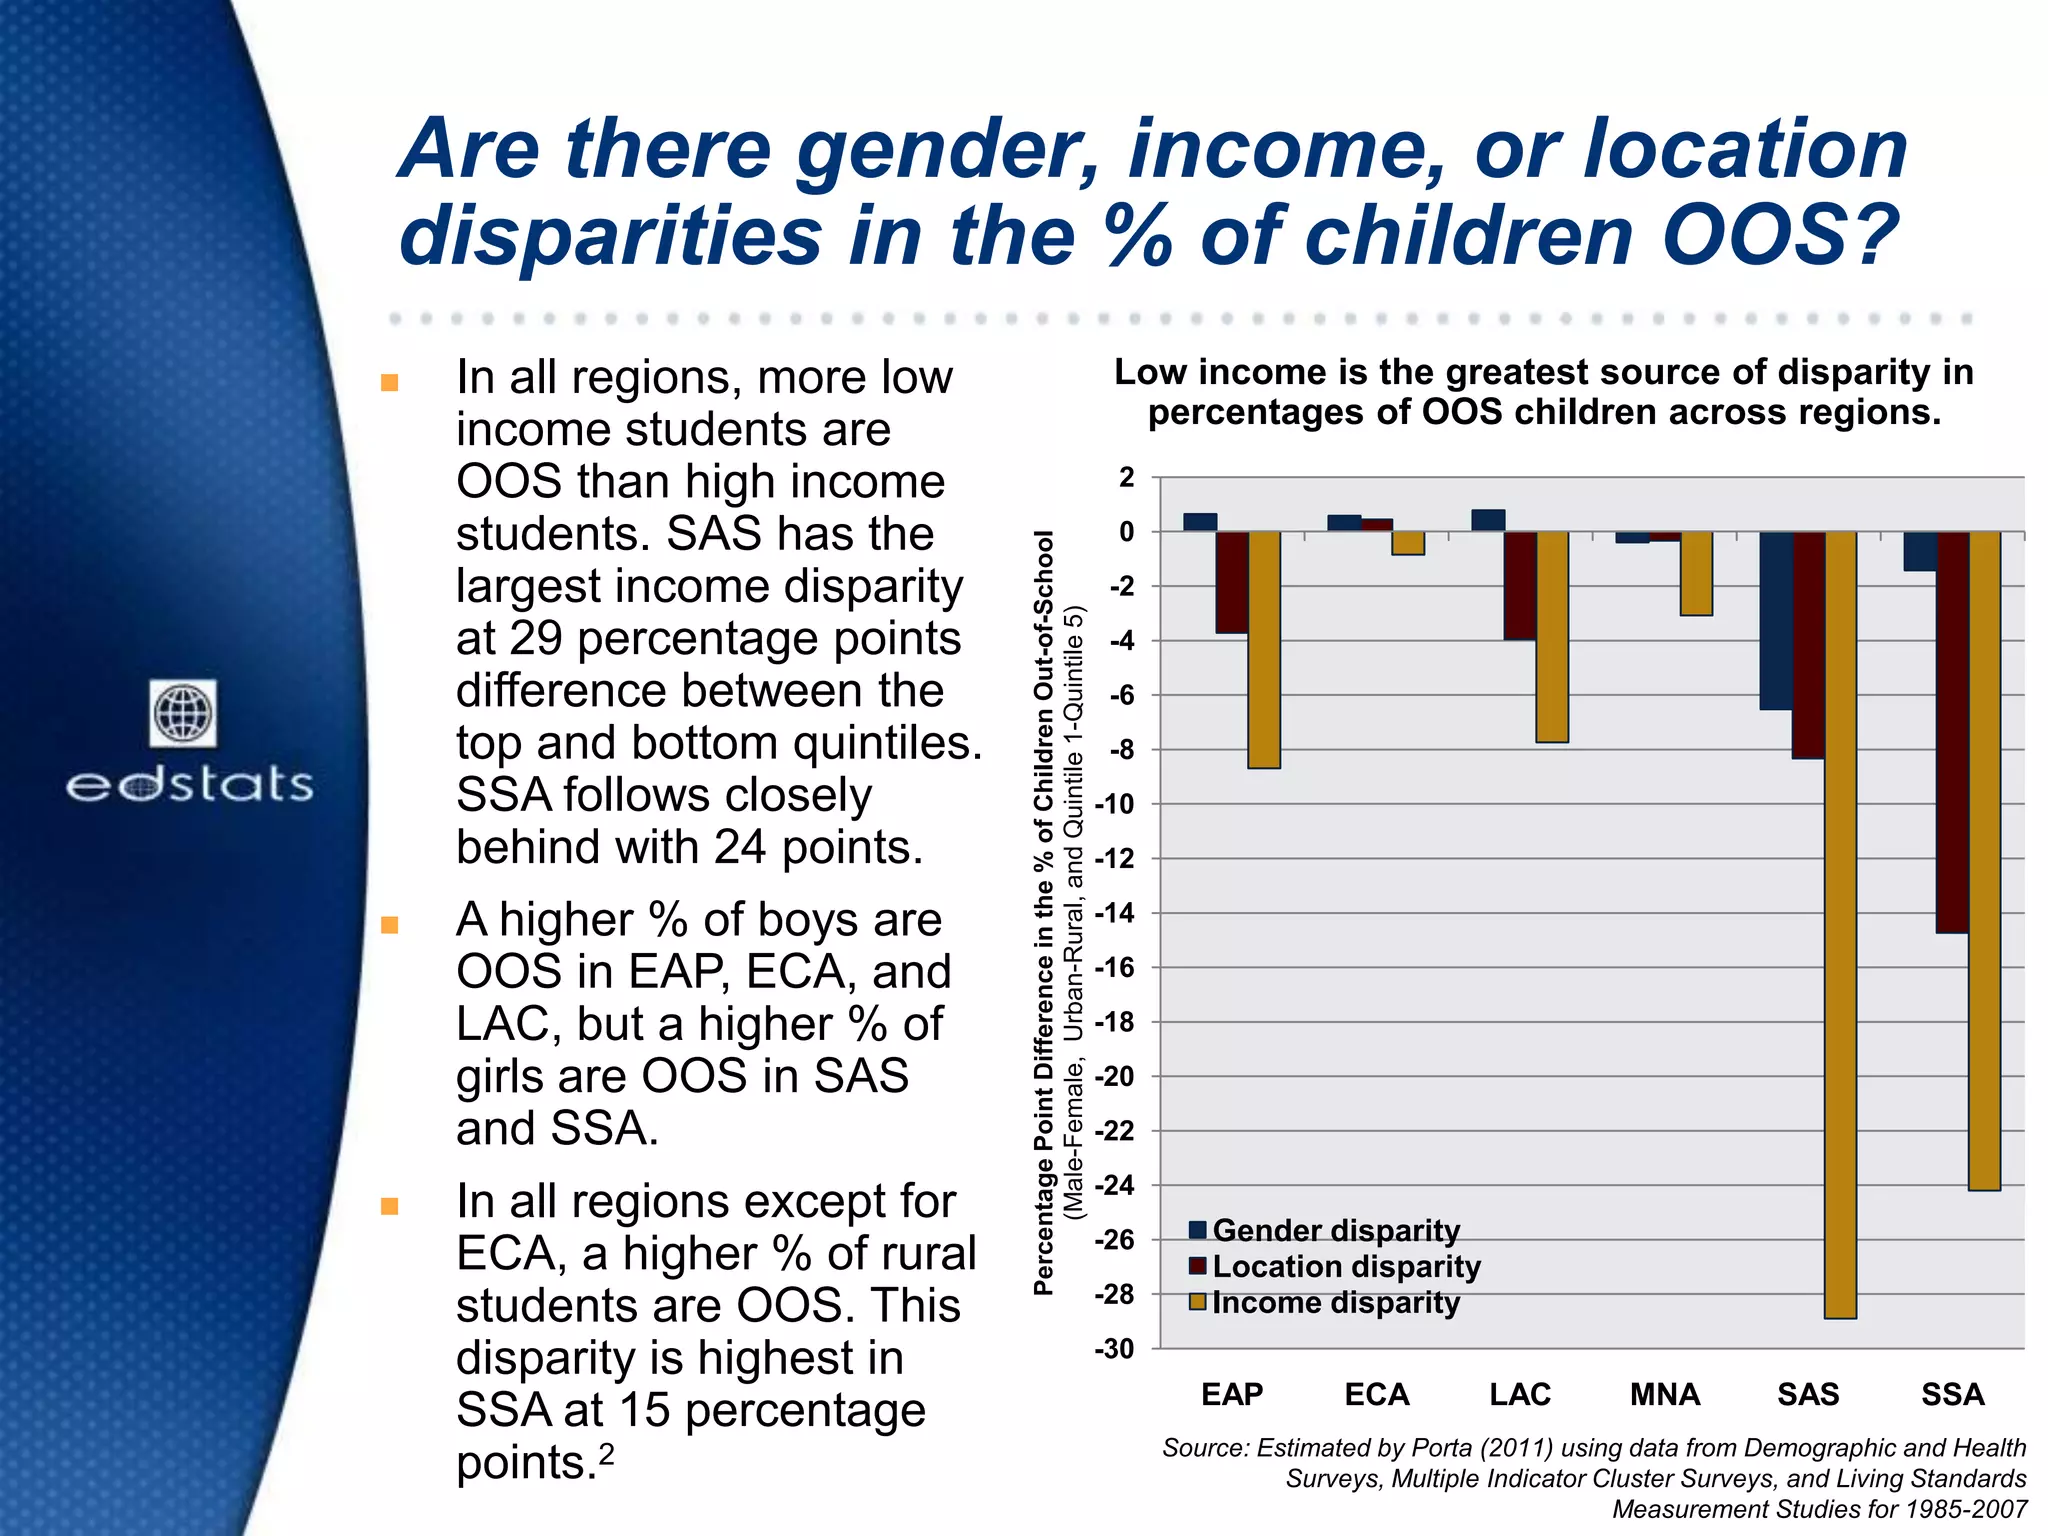
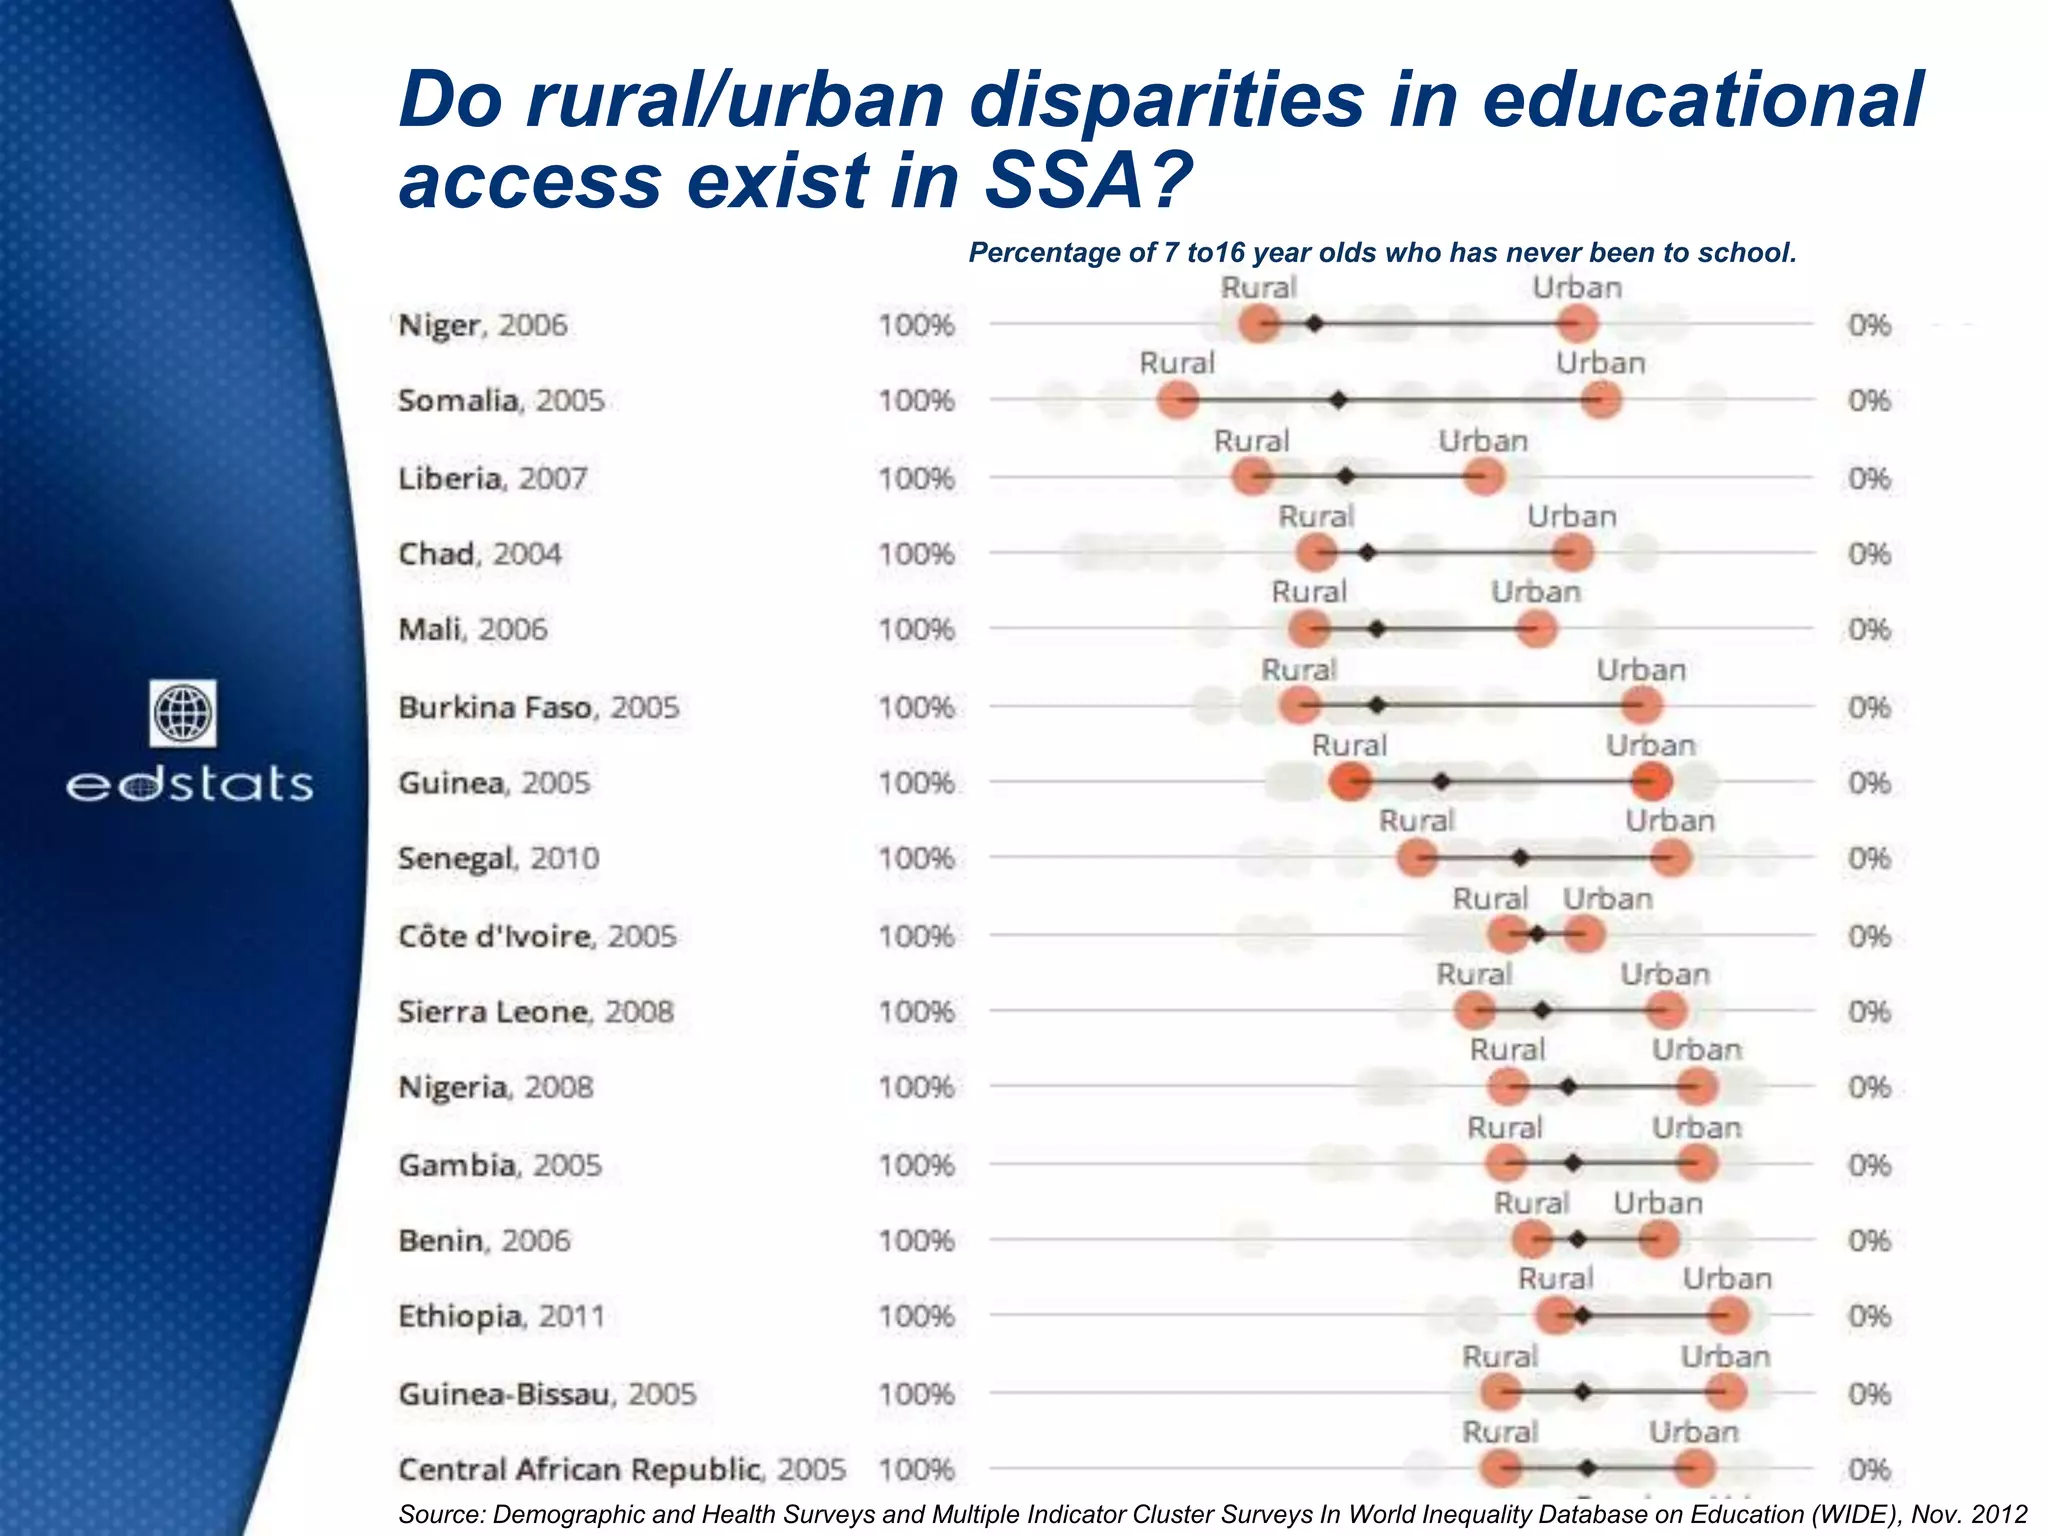


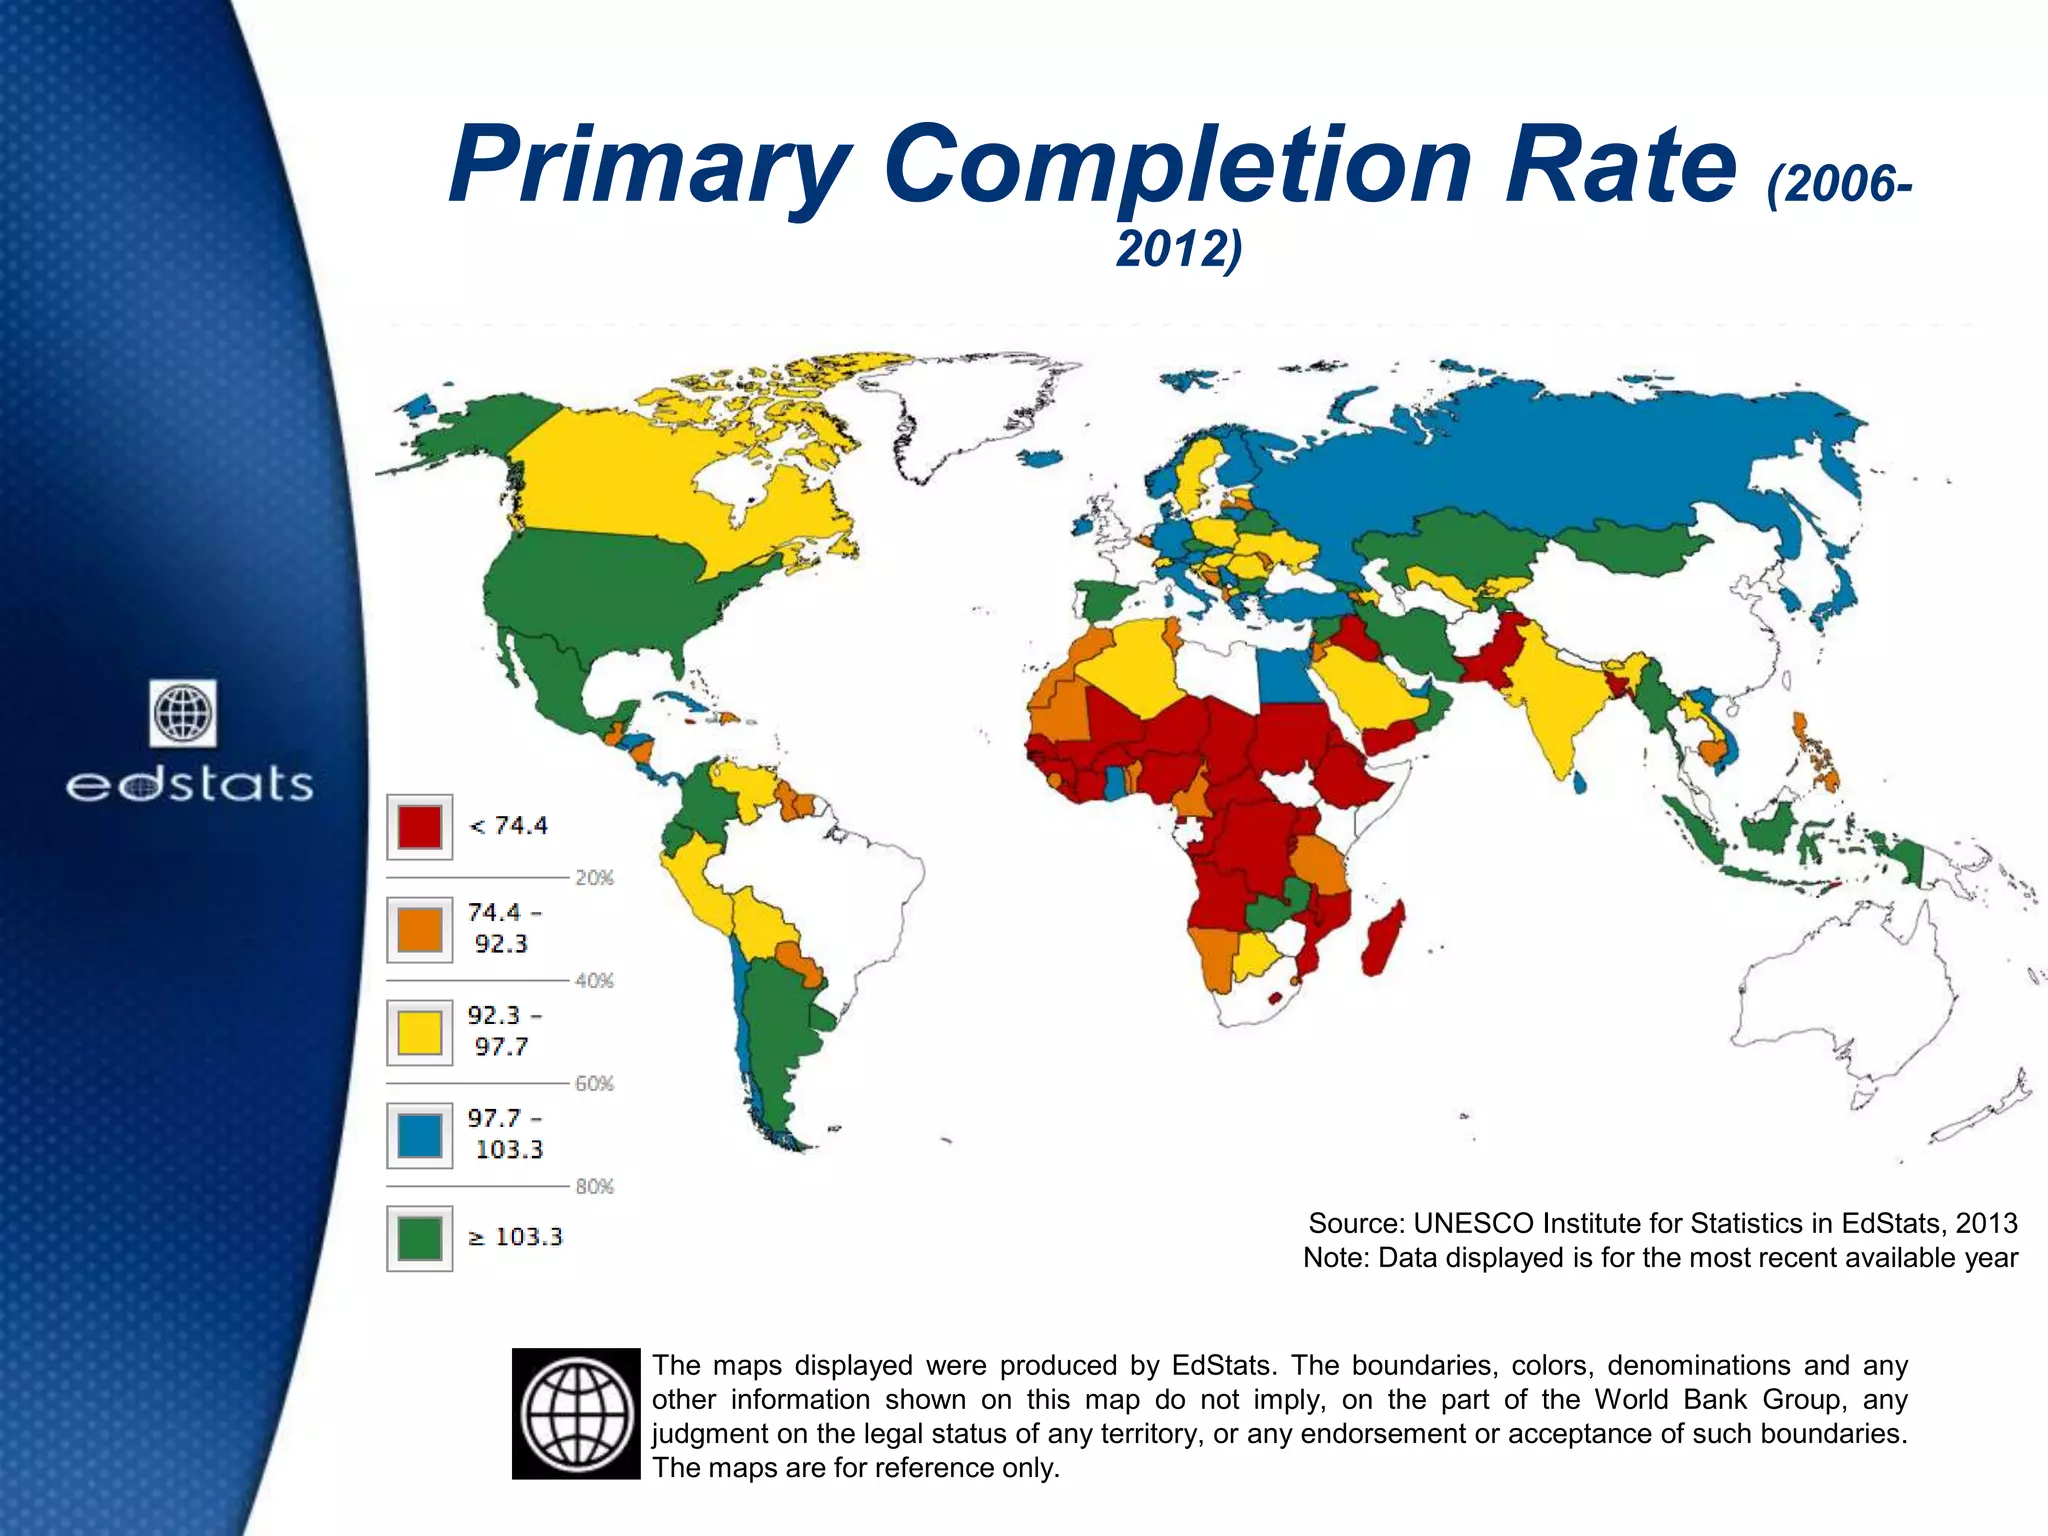


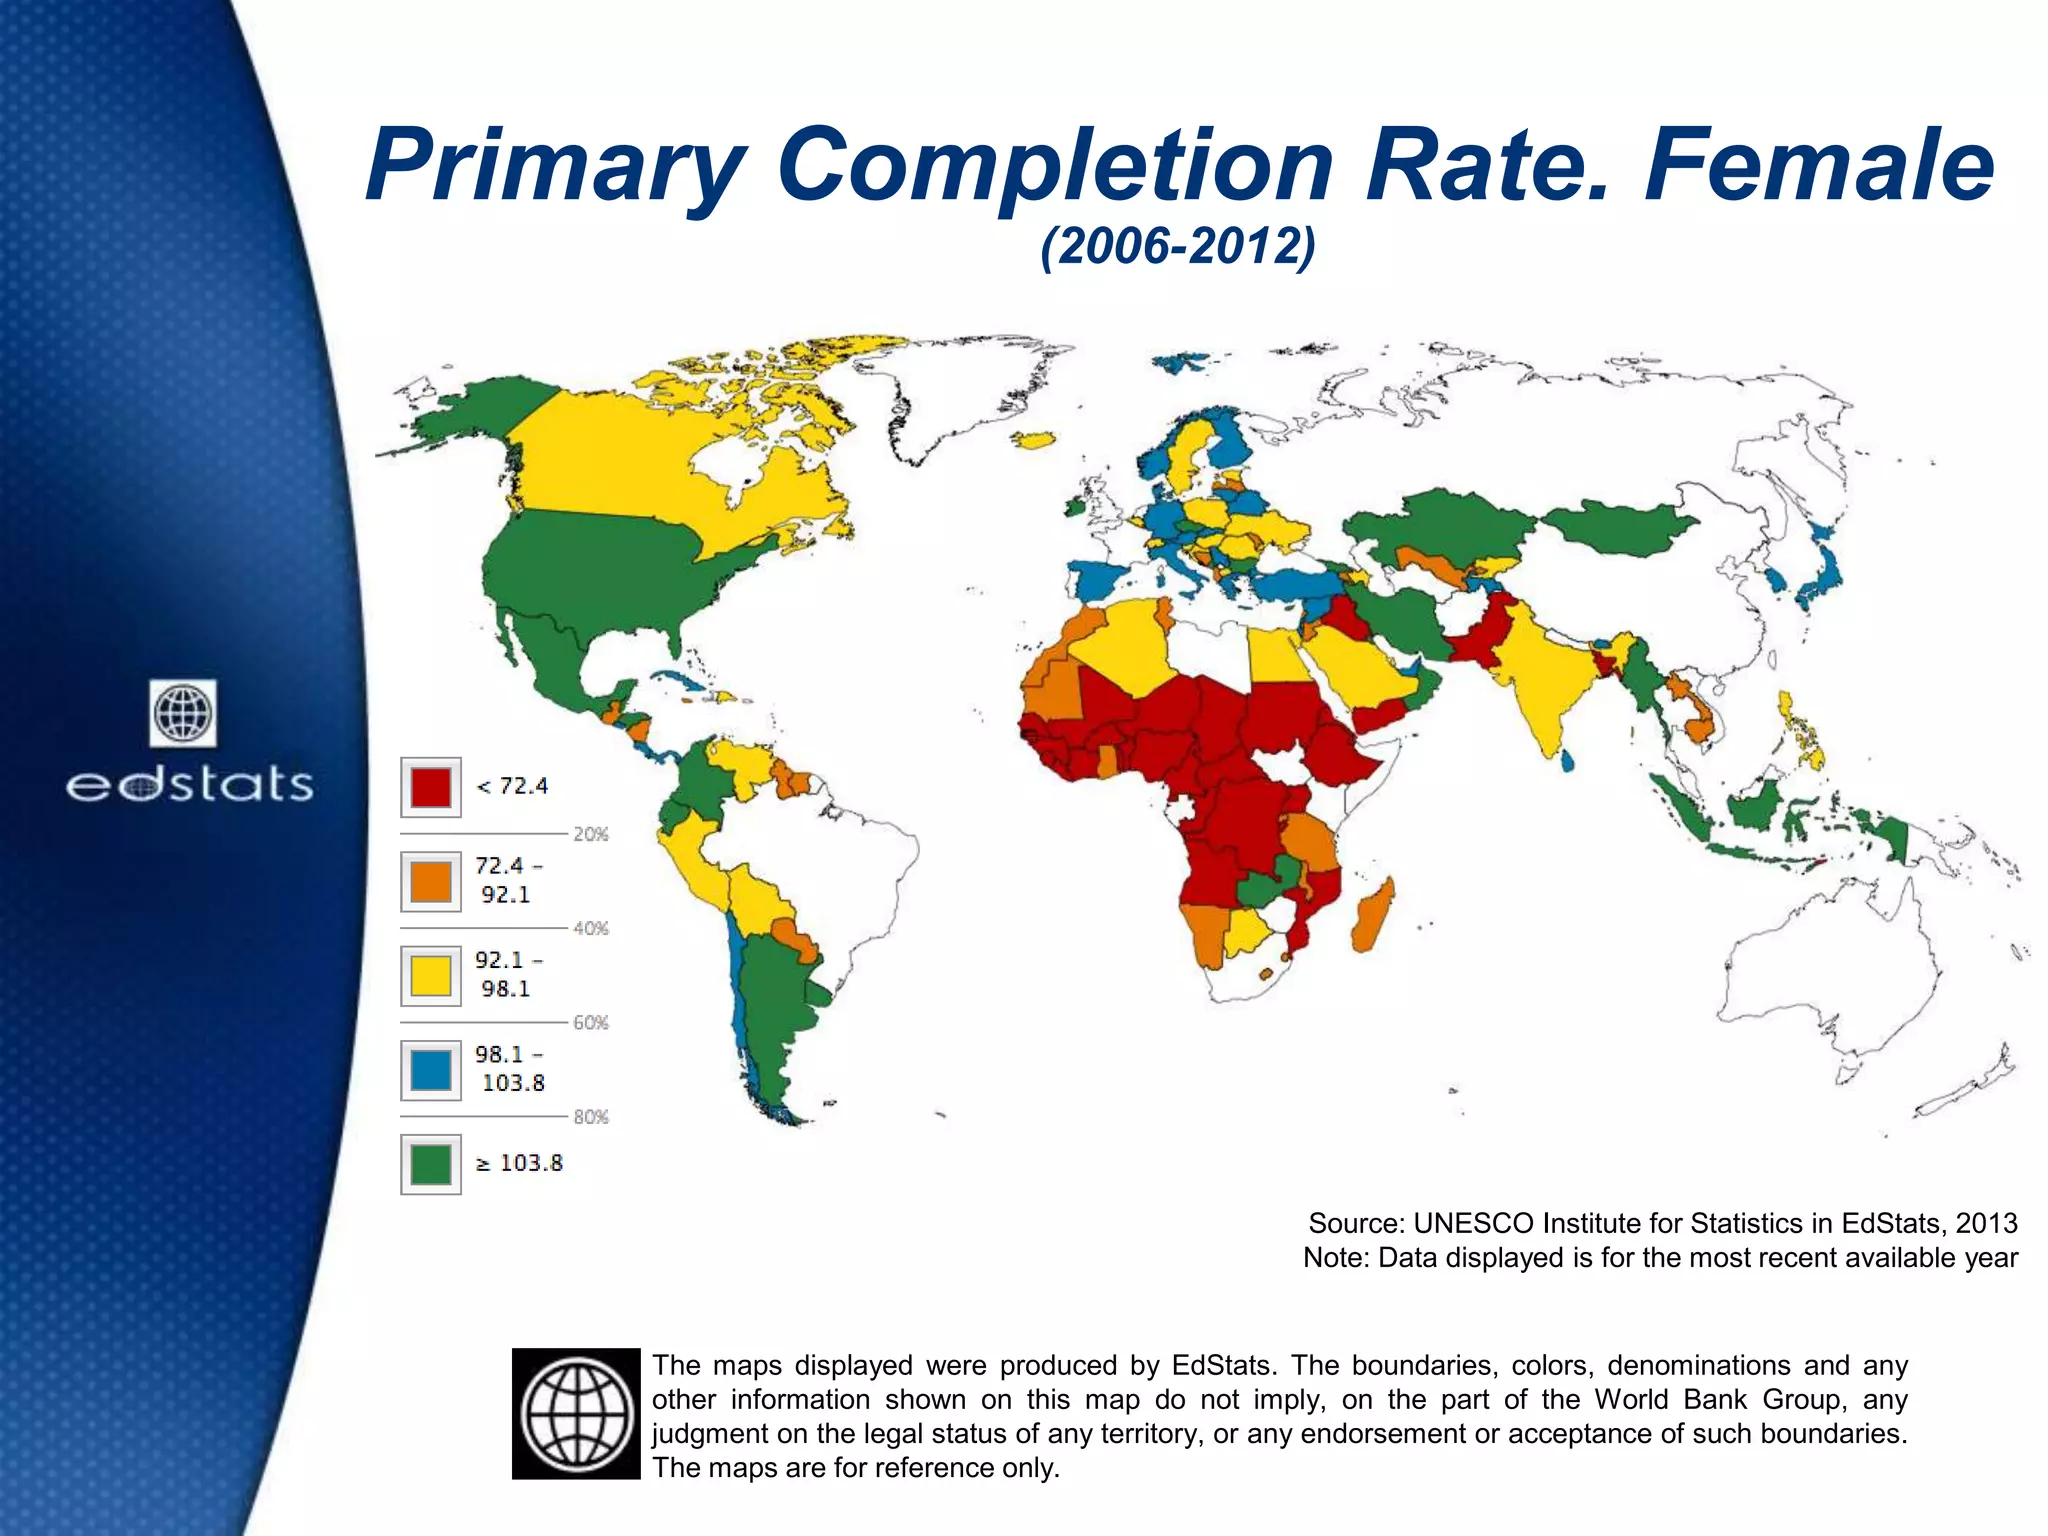
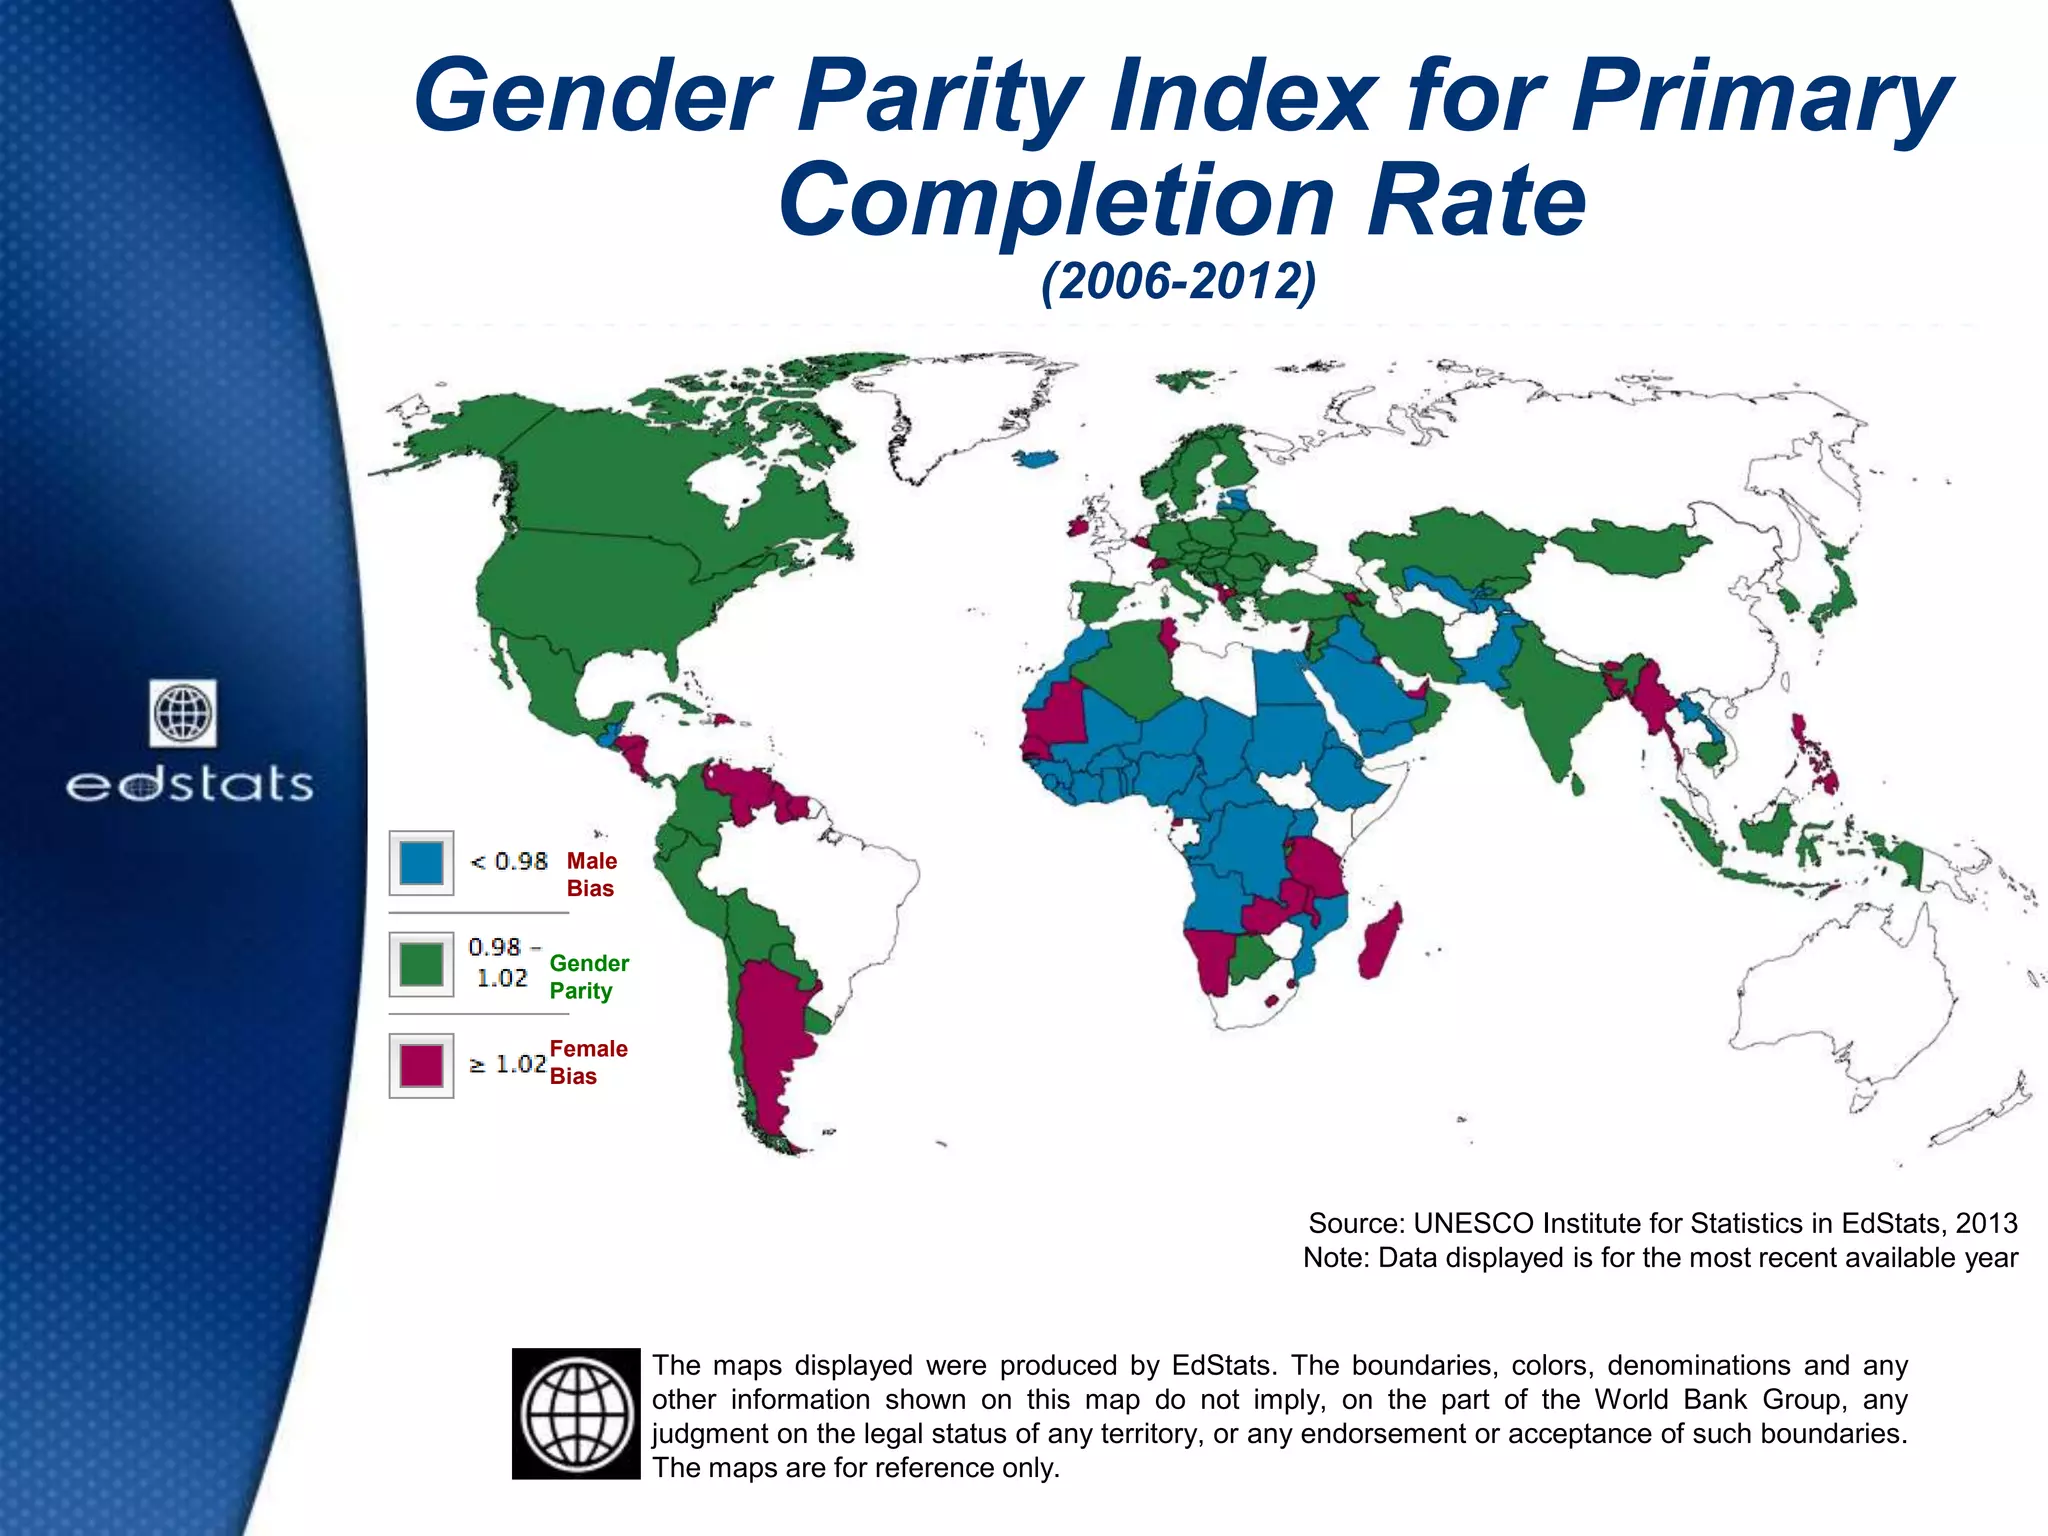


This document summarizes data on primary education from a global report. It includes information on enrollment rates, out of school children, gender and income disparities, pupil-teacher ratios, repetition rates, completion rates, learning outcomes, and education expenditures for primary education. The key findings are that primary enrollment has increased globally but progress has stalled since 2008, sub-Saharan Africa has the lowest enrollment rates and largest number of out of school children, and the biggest disparities in attendance rates exist across income levels in South Asia and sub-Saharan Africa.


