Downloaded 171 times


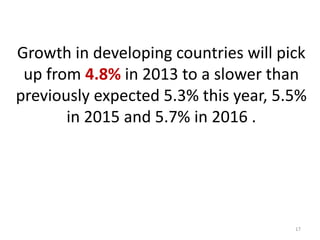


The document is a report from the World Bank that provides projections for the global economy. It forecasts that global GDP growth will increase from 2.4% in 2013 to 3.2% in 2014, and then stabilize at 3.4-3.5% in 2015-2016. Growth is expected to be led by high-income countries as their recoveries continue. Developing country growth will also increase but at a slower pace than previously expected, reaching 5.3% in 2014, 5.5% in 2015, and 5.7% in 2016. Acceleration will be limited in regions that have already fully recovered. Capital flows to developing countries are projected to decline only marginally from 4.6% to 4.


