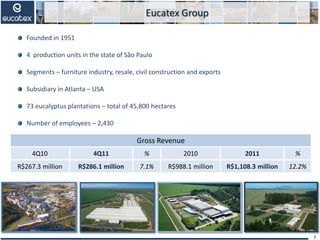
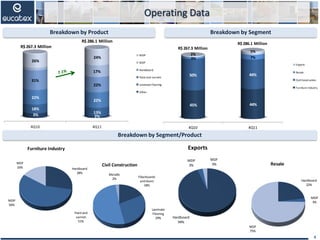
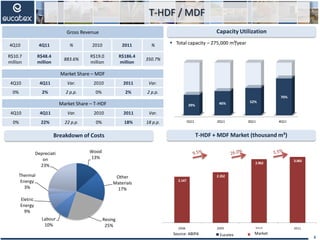
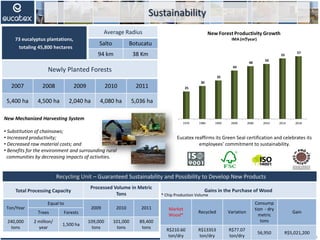
2. Eucatex Group
2
Founded in 1951
4 production units in the state of São Paulo
Segments – furniture industry, resale, civil construction and exports
Subsidiary in Atlanta – USA
73 eucalyptus plantations – total of 45,800 hectares
Number of employees – 2,430
Gross Revenue
4Q10 4Q11 % 2010 2011 %
R$267.3 million R$286.1 million 7.1% R$988.1 million R$1,108.3 million 12.2%
3. Production Units
3
Location – Salto-SP
Number of employees – 771
Hardboard – 240,000 m³
Fiberboards and doors – 4.8 million pieces
Painting capacity – 80 million m²
Paper printing – 45 million m²/year
Location – Botucatu-SP
Number of employees – 438
MDP – 430,000 m³
Flooring – 6 million m²
Finish Foil, BP and Lacca finishing – 40 million
m²
Location – Salto-SP
Number of employees– 184
T-HDF/MDF – 275,000 m³
Location – Salto-SP
Number of employees – 230
Paint and varnish – 36 million gallons/year
Fiberboard Unit T-HDF / MDF Unit
MDP and
Laminated Flooring Unit
Paint and Varnish Unit
4. Breakdown by Segment
Operating Data
Breakdown by Segment/Product
Breakdown by Product
4
Hardboard
28%
MDP
56%
MDF
16%
Furniture Industry
Fiberboards
anddoors
18%
Laminate
Flooring
29%
Paintand
varnish
51%
Metallic
2%
Civil Construction
Hardboard
94%
MDP
3%
MDF
3%
Exports
Hardboard
22%
MDP
3%
MDF
75%
Resale
4Q10 4Q11
3% 2%
18%
13%
22%
22%
31%
22%
17%
26%
24%
MDP
MDF
Handboard
Paint and varnish
Laminate Flooring
Other
R$ 267.3 Million
R$ 286.1 Million
4Q10 4Q11
45% 44%
50% 44%
3% 7%
2%
5%
Exports
Resale
Civil Construction
Furniture Industry
R$ 267.3 Million
R$ 286.1 Million
5. Breakdown of Costs Market (million m²)
Fiberboard
Capacity Utilization
Total capacity – 240,000 m³/year
5
Gross Revenue
4Q10 4Q11 % 2010 2011 %
R$81.5
million
R$63.3
million
-22.3%
R$298.5
million
R$237.8
million
-20.3%
Market Share
4Q10 4Q11 Var. 2010 2011 Var.
55% 48% -7 p.p. 54% 48% -6 p.p.
Source: ABIPA
1T06 1T07 1T08 1T09 1T10
100
110
120
106
114
100
118
130
104
139
Eucatex Mercado
171
146
134 129
2008 2009 2010 2011
4Q09 4Q10 4Q11
86% 91% 88%
Wood
15%
Coating
(Paperand
Paint)
19%
Other
Materials
25%
Labour
20%
Eletric
Energy
9%
Thermal
Energy
5%
Depreciation
7%
Market
6. T-HDF / MDF
Breakdown of Costs
Capacity Utilization
Total capacity – 275,000 m³/year
6
T-HDF + MDF Market (thousand m³)
Gross Revenue
4Q10 4Q11 % 2010 2011 %
R$10.7
million
R$48.4
million
883.6%
R$19.0
million
R$186.4
million
350.7%
Market Share – MDF
4Q10 4Q11 Var. 2010 2011 Var.
0% 2% 2 p.p. 0% 2% 2 p.p.
Market Share – T-HDF
4Q10 4Q11 Var. 2010 2011 Var.
0% 22% 22 p.p. 0% 18% 18 p.p.
Source: ABIPA
2.147
2.352
2.962
3.065
2008 2009 2010 2011
1T06 1T07 1T08 1T09 1T10
100
110
120
106
114
100
118
130
104
139
Eucatex Mercado
1Q11 2Q11 3Q11 4Q11
39% 46% 52%
70%
Wood
13%
Other
Materials
17%
Resing
25%
Labour
10%
Eletric
Energy
9%
Thermal
Energy
3%
Depreciati
on
23%
Market
7. MDP
Breakdown of Costs
Capacity Utilization
Capacity – 430,000 m³/year
7
Market (thousand m³)
Gross Revenue
4Q10 4Q11 % 2010 2011 %
R$59.4
million
R$68.4
million
15.1%
R$266.4
million
R$273.1
million
2.5%
Market Share
4Q10 4Q11 Var. 2010 2011 Var.
11% 11% - 11% 11% -
% of Coated
4Q10 4Q11 Var. 2010 2011 Var.
Eucatex 99% 100% 1pp 97% 97% -
Market 19% 23% 4 p.p. 22% 21%
-1
p.p.
Source: ABIPA
2.562
2.431
2.917 2.985
2008 2009 2010 2011
1T06 1T07 1T08 1T09 1T10
100
110
120
106
114
100
118
130
104
139
Eucatex Mercado
4Q09 4Q10 4Q11
76% 79% 79%
Wood
15%
Coating
(Paperand
Paint)
36%
Other
Materials
8%
Resing
17%
Labour
8%
Eletric
Energy
6%
Thermal
Energy
3%
Depreciation
7%
Market
8. Laminated Flooring
Breakdown of Costs
Capacity Utilization
Total capacity – 6 million m² /year
8
Market (thousand m²)
Gross Revenue
4Q10 4Q11 % 2010 2011 %
R$37.0
million
R$36.4
million
-1.7%
R$119.2
million
R$132.3
million
11%
Market Share
4Q10 4Q11 Var. 2010 2011 Var.
41% 38% -3 p.p. 38% 38% -
Source: ABIPLAR
8.192
8.729
10.370
11.167
2008 2009 2010 2011
1T06 1T07 1T08 1T09 1T10
100
110
120
106
114
100
118
130
104
139
Eucatex Mercado
Wood
7%
Coating
(Paper)
58%
Other
Materials
15%
Resing
12%
Labour
5%
Eletric
Energy
1%
Thermal
Energy
1%
Depreciation
1%
4Q09 4Q10 4Q11
59% 61%
76%
Market
9. Paint and Varnish
Breakdown of Costs
Capacity Utilization
Total capacity – 36 million gallons/ year
9
* Eucatex estimate
Market (million gallons)
Gross Revenue
4Q10 4Q11 Var. 2010 2011 Var.
R$60.1
million
R$64.2
million
6.8%
R$216.3
million
R$236.9
million
9.5%
Market Share *
4Q10 4Q11 Var. 2010 2011 Var.
7% 7% - 8% 8% -
Source: ABRAFATI and * Eucatex Estimate
780 816
916 939
2008 2009 2010 2011*
1T06 1T07 1T08 1T09 1T10
100
110
120
106
114
100
118
130
104
139
Eucatex Mercado
4Q09 4Q10 4Q11
51% 58% 64%
Row
Material
72%
Packging
17%
Labour
7%
Eletric Energy
1%
OtherCosts
2%
Depreciation
1%
Market
10. 73 eucalyptus plantations,
totaling 45,800 hectares
Average Radius
Salto Botucatu
94 km 38 Km
Sustainability
Newly Planted Forests
2007 2008 2009 2010 2011
5,400 ha 4,500 ha 2,040 ha 4,080 ha 5,036 ha
New Mechanized Harvesting System
• Substitution of chainsaws;
• Increased productivity;
• Decreased raw material costs; and
• Benefits for the environment and surrounding rural
communities by decreasing impacts of activities.
Eucatex reaffirms its Green Seal certification and celebrates its
employees’ commitment to sustainability.
10
Total Processing Capacity
Processed Volume in Metric
Tons
Ton/Year
Equal to
2009 2010 2011
Trees Forests
240,000
tons
2 million/
year
1,500 ha
109,000
tons
101,000
tons
89,400
tons
Gains in the Purchase of Wood
Market
Wood*
Recycled Variation
Consump
tion - dry
metric
tons
Gain
R$210.60
ton/dry
R$13353
ton/dry
R$77.07
ton/dry
56,950 R$5,021,200
Recycling Unit – Guaranteed Sustainability and Possibility to Develop New Products
* Chip Production Volume
1970 1980 1990 2000 2006 2010 2014 2018
25
30
35
44
48
50
55
57
New Forest Productivity Growth
IMA (m³/year)
11. Indicators
11
Evolution of Real Estate Credit as a % of GDP Real Estate Credit as a % of GDP
Source: ABECIP, FEBRABAN e BACEN
26,4 24,7
22,0
24,0 24,5
28,1
30,2
34,2
41,3
43,7 45,2
49,1
2000 2001 2002 2003 2004 2005 2006 2007 2008 2009 2010 2011
Fonte: Bacen
Brasil
China
México
Chile
Malásia
Africa do Sul
Alemanha
Estados Unidos
Holanda
4,7%
11,0%
13,0%
18,0%
30,0%
34,0%
48,0%
78,0%
106,0%
Analysis of Real Estate Credit
The rate of demographic growth will decrease in the next 12 years , from 1.3% to 0.6% p.a., however, the number of people over 26 years of age,
as a percentage of the total population, should increase from 55% to 63%. As a result, the rate of family growth in this period should be
approximately 3 times greater than the rate of population growth.
Between 2000 and 2010, the number of households in Brazil increased from 45 million to 56 million, up by 1.1 million per year. An FGV survey
shows that between 2010 and 2022, Brazil should see average household growth of 1.9 million per year; ¹
Real estate credit in Brazil, which accounted for 4.7% of GDP in 2011, should reach 11% in 2014.²
Sources: ¹ Secovi - 2. ABECIP SEMINAR – Overview of Real Estate Market Opportunities and Challenges
² Brazilian Central Bank and Abecip (Brazilian Association of Real Estate Credit and Savings Entities)
15. Financial Data
15
Net revenue reached R$899.1 million in 2011, up by 13.2% on 2010;
EBITDA of R$186.2 million in 2011, up by 17.2% on the 2010 total of R$158.9 million. The EBITDA margin stood at 20.7% in 2011, expanding 0.7 p.p.
from 20.0% in 2010;
Selling and administrative expenses corresponded to 19.9% of net operating revenue in 2011, down by 1.1 p.p. from 21.0% in 2010; and
Under “Non-Recurring Results,” in 2011, the Company recorded the reversal of tax contingencies in the amount of R$24.3 million and in 2010, the sale
of the Santa Luzia farm, in the city of Itu/SP, in the amount of R$49.9 million.
Highlights and Comments
Highlights (R$ MM) 4Q11 A.V. % 4Q10 A.V. % Var. (%) 2011 A.V. % 2010 A.V. % Var. (%)
Net Revenues 232.5 100.0% 214.3 100.0% 8.5% 899.1 100.0% 794.0 100.0% 13.2%
Cost of Goods Sold 11.7 5.0% 9.9 4.6% -17.9% 43.6 4.9% 36.1 4.5% -20.9%
Gross Profit (160.8) -69.2% (147.3) -68.7% 9.2% (624.2) -69.4% (538.6) -67.8% 15.9%
Operating Expenses 83.4 35.9% 76.9 35.9% 8.4% 318.6 35.4% 291.5 36.7% 9.3%
Gross Margin (%) 35.9% 35.9% 0 p.p. 35.4% 36.7% -1.3 p.p.
Administrative Expenses (13.4) -5.7% (12.5) -5.9% 6.6% (48.8) -5.4% (44.3) -5.6% 10.1%
Comercial Expenses (35.1) -15.1% (32.7) -15.3% 7.4% (130.5) -14.5% (117.7) -14.8% 10.9%
Others Operational Costs (0.7) -0.3% 1.3 0.6% -157.6% (7.0) -0.8% (11.0) -1.4% -36.5%
EBITDA 55.9 24.1% 35.7 16.7% 56.5% 210.4 23.4% 208.8 26.3% 0.8%
EBITDA Margin (%) 24.1% 16.7% 7.4 p.p. 23.4% 26.3% -2.9 p.p.
Recurring EBITDA 46.0 19.8% 43.3 20.2% 6.2% 186.2 20.7% 158.9 20.0% 17.2%
EBITDA Margin (%) 19.8% 20.2% -0.4 p.p. 20.7% 20.0% 0.7 p.p.
Net Financial Results (9.4) -4.0% (11.5) -5.4% -18.7% (58.8) -6.5% (32.8) -4.1% -79.1%
Non-Recurring Results 9.9 4.3% (7.6) -3.5% 230.1% 24.3 2.7% 49.9 6.3% -51.4%
Provisions for taxes 2.6 1.1% 6.1 2.8% 57.9% (9.7) -1.1% (15.7) -2.0% 38.5%
Net Icome 37.2 16.0% 19.9 9.3% 86.9% 88.2 9.8% 120.0 15.1% -26.5%
16. CAPEX
Investments Planned for 2011
New Laminated Flooring Line – Botucatu/SP
Capacity Forecast
500,000 m² / month 1Q12
Paint Line – Salto/SP
Capacity Forecast
2.4 million m² / month Installed!
Low Pressure Press Line – Salto/SP
Capacity Forecast
600,000 m² / month Installed!
Doors and Fiberboards Line – Salto/SP
Capacity Forecast
300,000 pieces / month 1Q12
New Paint Plant – Ribeirão/PE
Capacity Forecast
444,000 gallons / month 3Q12
Expansion of Recycled Material Cleaning Capacity of the Recycling
Line
Additional Equipment for T-HDF/MDF
Forest and Production Sustainability
Investments in 2011
2012 CAPEX
R$90 million
16
R$ Million %
1Q11 37.3 25%
2Q11 37.5 26%
3Q11 44.2 30%
4Q11 27.6 19%
Total 146.7
New T-
HDF/MDF
Line / Other
Projects
44%
Forest
28%
Sustentation
28%
17. Net Debt x EBITDA Debt Profile
Debt
17
Short
Term
63%
Long
Term
37%
2006 2007 2008 2009 2010 2011
0,8 x
0,7 x
0,6 x
1,0 x 1,0 x
1,2 x
Debt (R$ Million) 2011 2010 Var. (%)
Short Term Debt 146.7 100.7 45.6%
Long Term Debt 85.9 60.4 42.1%
Gross Debt 232.6 161.2 44.3%
Cash and Cash Equivalents 17.0 7.8 117.2%
Net Debt 215.5 153.3 40.6%
% Short Term Debt 63% 62% 0.6 p.p.
Net Casth (Debt)/EBITDA 1.2 1.0 20.0%
20. José Antonio G. de Carvalho
Vice-CEO and Investor Relations Officer
Sergio Henrique Ribeiro
Controller
Waneska Bandeira
Investor Relations
(11) 3049-2473
ri@eucatex.com.br
www.eucatex.com.br/ri
IR Contacts
20
21. This presentation includes forward-looking statements concerning the
business prospects, projections and operating and financial targets of Eucatex
S.A. Indústria e Comércio, which are based on the beliefs and assumptions of
management and on the information currently available to the Company.
Forward‐looking statements are not guarantees of performance and involve
risks, uncertainties and assumptions, since they refer to future events and
therefore depend on circumstances that may or may not occur.
Investors should understand that overall economic and industry conditions
and other operating factors may affect the company’s future results and lead
to results that differ materially from those expressed in these forward‐looking
statements.
21
Disclaimer