Download to read offline

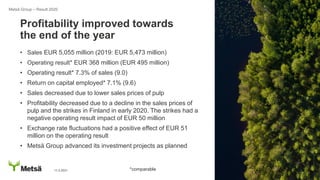
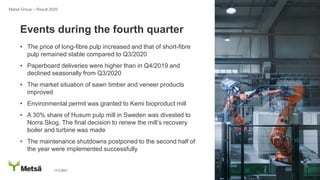

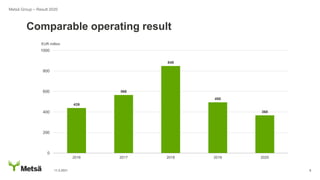


The document summarizes Metsä Group's financial results for 2020. Key points include: - Sales decreased to EUR 5.055 billion due to lower pulp prices, while operating result fell to EUR 368 million due to lower pulp prices and strikes in early 2020. - Profitability improved towards the end of the year as pulp and sawn timber prices increased. - The company advanced major investment projects and was granted an environmental permit for its new Kemi bioproduct mill.


