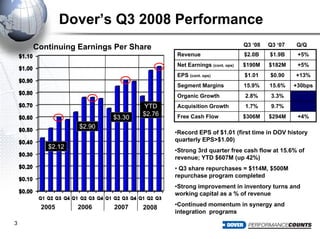
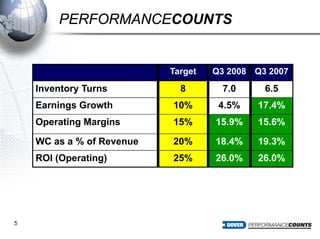
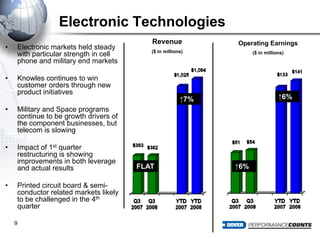
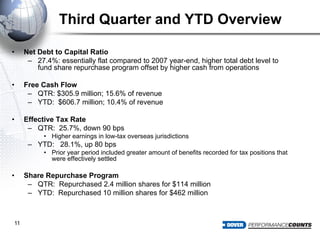
Dover Corporation reported third quarter 2008 results with revenue increasing 5% year-over-year to $2 billion and earnings per share increasing 13% to $1.01. Free cash flow was up 4% to $306 million for the quarter. Segment margins increased slightly to 15.9% while organic growth was 2.8% and acquisition growth was 1.7%. The company completed its $500 million share repurchase program for the quarter, repurchasing $114 million in shares. Integration and synergy programs contributed $0.05 per share for the quarter and $0.11 per share year-to-date.
2. Forward Looking Statements
We want to remind everyone that our comments
may contain forward-looking statements that are
inherently subject to uncertainties. We caution
everyone to be guided in their analysis of Dover
Corporation by referring to our Form 10-K for a list
of factors that could cause our results to differ from
those anticipated in any such forward looking
statements.
We would also direct your attention to our internet
site, www.dovercorporation.com, where
considerably more information can be found.
2
3. Dover’s Q3 2008 Performance
Q3 ‘08 Q3 ‘07 Q/Q
Continuing Earnings Per Share
Revenue $2.0B $1.9B +5%
Net Earnings (cont. ops) $190M $182M +5%
EPS (cont. ops) $1.01 $0.90 +13%
Segment Margins 15.9% 15.6% +30bps
Organic Growth 2.8% 3.3%
Acquisition Growth 1.7% 9.7%
YTD
$2.76 Free Cash Flow $306M $294M +4%
$3.30
$2.90
•Record EPS of $1.01 (first time in DOV history
quarterly EPS>$1.00)
$2.12
•Strong 3rd quarter free cash flow at 15.6% of
revenue; YTD $607M (up 42%)
• Q3 share repurchases = $114M, $500M
repurchase program completed
•Strong improvement in inventory turns and
working capital as a % of revenue
•Continued momentum in synergy and
2005 2006 2007 2008
integration programs
3
4. Revenue Growth (Q3 2008)
Industrial Engineered Fluid Electronic Total
Products Systems Management Technologies Dover
Organic 6.1% -5.9% 15.6% -2.9% 2.8%
Net -0.2% (A) 0.0% 4.0% 0.0% 0.8% (B)
Acquisitions
Currency 0.5% 3.2% 1.0% 2.7% 1.8%
Total 6.4% -2.7% 20.6% -0.2% 5.4%
(A) Acquisition growth was 2.7% before disposition of a line of business.
(B) Acquisition growth was 1.7% before disposition of a line of business.
4
5. PERFORMANCECOUNTS
Target Q3 2008 Q3 2007
Inventory Turns 8 7.0 6.5
Earnings Growth 10% 4.5% 17.4%
Operating Margins 15% 15.9% 15.6%
WC as a % of Revenue 20% 18.4% 19.3%
ROI (Operating) 25% 26.0% 26.0%
5
6. Industrial Products
Revenue Operating Earnings
($ in millions) ($ in millions)
• Revenue increases driven by
military, international, solid
waste and oil field service
markets, partially offset by
softness in construction and
auto service markets
Flat
↑ 5%
3rd quarter earnings impacted by
•
restructuring, cost containment
activities and moderating market
conditions
• Effective pricing initiatives offset
majority of material cost
increases
↑ 6% ↓ 4%
• Market trends should continue
for remainder of the year
6
7. Engineered Systems
Earnings
Revenue ( $ in millions)
($ in millions)
• Revenue decline impacted by
expected softness in refrigeration
equipment markets, partially
offset by steady performance in
Product ID and strong
performance in heat exchanger
business
• Product mix and softer demand
impacted earnings
• Earnings reflect cost efficiency
benefits from MARKEM•Imaje
integration, net of $2 million
related expense
• Direct Coding remains solid with
over 50% of revenue coming from
consumables
• End-market trends will continue in
4th quarter
7
8. Fluid Management
Revenue Operating Earnings
• Revenue increase driven by
($ in millions) ($ in millions)
growth in oil and gas drilling,
demand for power generation
and global demand for
pumps, slightly offset by
weakness in permanent well
monitoring
• Revenue growth, operational
improvements and product ↑26%
mix increased earnings and
↑18%
margins
• Business trends will
moderate during 4th quarter,
but results will be solid due to
positive trends in power gen ,
↑29%
↑21%
continued technology shifts,
healthy backlogs & profit
improvement programs
8
9. Electronic Technologies
Revenue Operating Earnings
• Electronic markets held steady
($ in millions) ($ in millions)
with particular strength in cell
phone and military end markets
• Knowles continues to win
customer orders through new
product initiatives
↑6%
↑7%
• Military and Space programs
continue to be growth drivers of
the component businesses, but
telecom is slowing
Impact of 1st quarter
•
restructuring is showing
improvements in both leverage
FLAT ↑6%
and actual results
• Printed circuit board & semi-
conductor related markets likely
to be challenged in the 4th
quarter
9
10. Geographic Revenue Mix (YTD September 2008)
Dover YTD Growth Rate: 8%
8.7%
16.2%
Growth in Asia was driven by
5.3%
increases in Electronic
7.9%
Technologies and Engineered
Systems
YTD
Growth Rate
10
11. Third Quarter and YTD Overview
Net Debt to Capital Ratio
•
– 27.4%: essentially flat compared to 2007 year-end, higher total debt level to
fund share repurchase program offset by higher cash from operations
Free Cash Flow
•
– QTR: $305.9 million; 15.6% of revenue
– YTD: $606.7 million; 10.4% of revenue
Effective Tax Rate
•
– QTR: 25.7%, down 90 bps
• Higher earnings in low-tax overseas jurisdictions
– YTD: 28.1%, up 80 bps
• Prior year period included greater amount of benefits recorded for tax positions that
were effectively settled
Share Repurchase Program
•
– QTR: Repurchased 2.4 million shares for $114 million
– YTD: Repurchased 10 million shares for $462 million
11
12. Integration and Synergy Programs
• Integration activities
– Markem•Imaje integration entering final phase
• Combine ERP systems & back-office functions
• Continue to post revenue growth during integration
– Norris & Alberta Oil Tool
• Reduced costs, improved yield, improved production capacity
– Pump Solutions Group
• Supply chain improvements, plant rationalization & significant revenue
synergy
– Other opportunities identified
3rd Quarter benefit : $0.05 EPS YTD 2008 benefit: $0.11 EPS
12
13. Integration and Synergy Programs
• Other Key Initiatives
– Global Procurement Program
• Comprehensive review of supply chain and procurement activities
• Building upon integration initiatives already underway
• Total incremental earnings improvement could be on a similar scale to
original synergy estimates
– Post Merger Integration Process (PMI)
• Using experience gained from past successful integrations
(Markem•Imaje, Vectron/CFC, etc.)
• Creating formal process and toolkit, and standardized measurement
process
• Program will enhance the success of our acquisition program
13
14. 2008 Outlook – Full Year
• Organic growth: low-to-mid single digits
• Margin improvement: Full year up 10 – 25 bps
• Capital expenditures: $150 – $165 million
• Interest expense: $100 - $103 million
• Full-year tax rate: 26% – 27%
• Free cash flow for full year: > 10% of revenue
• Corporate expenses: $110 - $115 million
– Driven by higher non-recurring professional fees and
discrete management transition costs
14