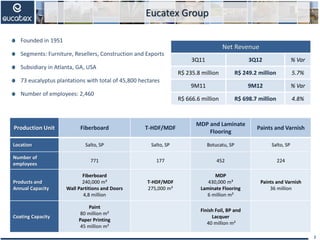
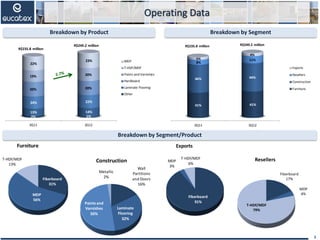
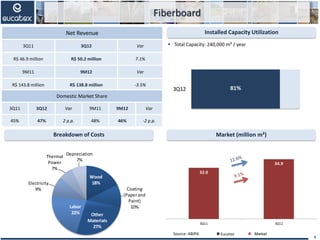
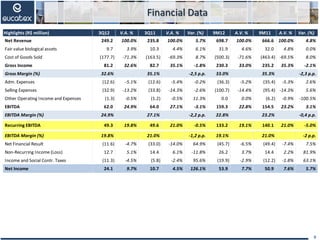
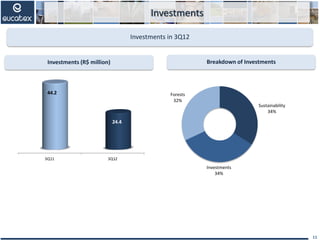
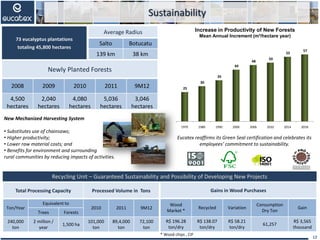
3Q12 Results
Eucatex Group
October 7, 2012
Eucatex Group
2
Founded in 1951
Segments: Furniture, Resellers, Construction and Exports
Subsidiary in Atlanta, GA, USA
73 eucalyptus plantations with total of 45,800 hectares
Number of employees: 2,460
Net Revenue
3Q11 3Q12 % Var
R$ 235.8 million R$ 249.2 million 5.7%
9M11 9M12 % Var
R$ 666.6 million R$ 698.7 million 4.8%
Production Unit Fiberboard T-HDF/MDF
MDP and Laminate
Flooring
Paints and Varnish
Location Salto, SP Salto, SP Botucatu, SP Salto, SP
Number of
employees
771 177 452 224
Products and
Annual Capacity
Fiberboard
240,000 m³
Wall Partitions and Doors
4,8 million
T-HDF/MDF
275,000 m³
MDP
430,000 m³
Laminate Flooring
6 million m²
Paints and Varnish
36 million
Coating Capacity
Paint
80 million m²
Paper Printing
45 million m²
Finish Foil, BP and
Lacquer
40 million m²
3Q11 3Q12
2% 1%
13% 14%
24% 22%
20% 20%
19% 20%
22%
23% MDP
T-HDF/MDF
Paints and Varnishes
Hardboard
Laminate Flooring
Other
R$235.8 million
R$249.2 million
Breakdown by Segment
Operating Data
Breakdown by Segment/Product
Breakdown by Product
3
3Q11 3Q12
41% 41%
46% 44%
8%
11%5%
4%
Exports
Resellers
Construction
Furniture
R$235.8 million R$249.2 million
Fiberboard
31%
MDP
56%
T-HDF/MDF
13%
Furniture
Wall
Partitions
and Doors
16%
Laminate
Flooring
32%
Paints and
Varnishes
50%
Metallic
2%
Construction
Fiberboard
91%
MDP
3%
T-HDF/MDF
6%
Exports
Fiberboard
17%
MDP
4%
T-HDF/MDF
79%
Resellers
81%3Q12
Breakdown of Costs Market (million m²)
Fiberboard
Installed Capacity Utilization
 Total Capacity: 240,000 m³ / year
4
Net Revenue
3Q11 3Q12 Var
R$ 46.9 million R$ 50.2 million 7.1%
9M11 9M12 Var
R$ 143.8 million R$ 138.8 million -3.5%
Domestic Market Share
3Q11 3Q12 Var 9M11 9M12 Var
45% 47% 2 p.p. 48% 46% -2 p.p.
Source: ABIPA
1T06 1T07 1T08 1T09 1T10
100
110
120
106
114
100
118
130
104
139
Eucatex Mercado
Wood
18%
Coating
(Paperand
Paint)
10%
Other
Materials
27%
Labor
22%
Electricity
9%
Thermal
Power
7%
Depreciation
7%
32.0
34.9
3Q11 3Q12
Market
48%3Q12
832.1
944.1
3Q11 3Q12
T-HDF / MDF
Breakdown of Costs
Installed Capacity Utilization
 Total Capacity: 275,000 m³ / year
5
Market ('000 m³)
Net Revenue
3Q11 3Q12 Var
R$ 44.7 million R$ 49.9 million 11.8%
9M11 9M12 Var
R$ 112.3 million R$ 148.3 million 32.1%
MDF Market Share
3Q11 3Q12 Var 9M11 9M12 Var
2% 3% 1 p.p. 2% 3% 1 p.p.
T-HDF Market Share
3Q11 3Q12 Var 9M11 9M12 Var
22% 20% -2 p.p. 16% 22% 6 p.p.
Source: ABIPA
1T06 1T07 1T08 1T09 1T10
100
110
120
106
114
100
118
130
104
139
Eucatex Mercado
Wood
21%
Other
Materials
12%
Resin
36%
Labor
9%
Electricity
8%
Thermal
Power
3%
Depreciation
11%
Market
80% 89%3Q12
MDP
Breakdown of Costs
Installed Capacity Utilization
 Capacity: 430,000 m³ / year
6
Market ('000 m³)
Net Revenue
3Q11 3Q12 Var
R$ 53.4 million R$ 58.0 million 8.6%
9M11 9M12 Var
R$ 161.8 million R$ 171.1 million 6.1%
Market Share
3Q11 3Q12 Var 9M11 9M12 Var
10% 10% - 11% 10% -1pp
% of MDP Coated
3Q11 3Q12 Var 9M11 9M12 Var
Eucatex 99% 100% 1 p.p. 95% 100% 5 p.p.
Market 19% 21% 2 p.p. 20% 22% 2 p.p.
Source: ABIPA
1T06 1T07 1T08 1T09 1T10
100
110
120
106
114
100
118
130
104
139
Eucatex Mercado
Wood
12%
Coating
(Paper + Paint)
28%
Other
Materials
15%
Resin
21%
Labor
7%
Electricity
6% Thermal Power
5%
Depreciation
6%
807.5 814.5
3Q11 3Q12
Market
94%3Q12
3,173.9
3,350.8
3Q11 3Q12
Laminate Flooring
Breakdown of Costs
Installed Capacity Utilization
 Total Capacity: 6 million m² / year
7
Market ('000 m²)
Source: ABIPLAR
1T06 1T07 1T08 1T09 1T10
100
110
120
106
114
100
118
130
104
139
Eucatex Mercado
Net Revenue
3Q11 3Q12 Var
R$ 30.1 million R$ 34.8 million 15.7%
9M11 9M12 Var
R$ 77.9 million R$ 83.4 million 7.1%
Market Share
3Q11 3Q12 Var 9M11 9M12 Var
37% 39% 2 p.p. 38% 38% -
Wood
6%
Coating (Paper)
53%
Other
Materials
19%
Resin
16%
Labor
4%
Electricity
0%
Thermal Power
1%
Depreciation
2%
Market
59%3Q12
Paints and Varnish
Breakdown of Costs
Installed Capacity Utilization
 Total Capacity: 36 million gallons / year
8
Market (million gallons)
Source: Eucatex
1T06 1T07 1T08 1T09 1T10
100
110
120
106
114
100
118
130
104
139
Eucatex Mercado
Net Revenue
3Q11 3Q12 Var
R$ 56.2 million R$ 54.4 million -3.2%
9M11 9M12 Var
R$ 143.4 million R$ 148.6 million 3.6%
Market Share
3Q11 3Q12 Var 9M11 9M12 Var
7% 7% - 7% 7% -
309.9
287.8
3Q11 3Q12
Raw Materials
72%
Packaging
17%
Labor
7%
Electricity
1%
Other Costs
2%
Depreciation
1%
Market
Financial Data
9
Highlights (R$ million) 3Q12 V.A. % 3Q11 V.A. % Var. (%) 9M12 A.V. % 9M11 A.V. % Var. (%)
Net Revenue 249.2 100.0% 235.8 100.0% 5.7% 698.7 100.0% 666.6 100.0% 4.8%
Fair value biological assets 9.7 3.9% 10.3 4.4% 6.1% 31.9 4.6% 32.0 4.8% 0.0%
Cost of Goods Sold (177.7) -71.3% (163.5) -69.3% 8.7% (500.3) -71.6% (463.4) -69.5% 8.0%
Gross Income 81.2 32.6% 82.7 35.1% -1.8% 230.3 33.0% 235.2 35.3% -2.1%
Gross Margin (%) 32.6% 35.1% -2,5 p.p. 33.0% 35.3% -2,3 p.p.
Adm. Expenses (12.6) -5.1% (12.6) -5.4% -0.2% (36.3) -5.2% (35.4) -5.3% 2.6%
Selling Expenses (32.9) -13.2% (33.8) -14.3% -2.6% (100.7) -14.4% (95.4) -14.3% 5.6%
Other Operating Income and Expenses (1.3) -0.5% (1.2) -0.5% 11.3% 0.0 0.0% (6.2) -0.9% -100.5%
EBITDA 62.0 24.9% 64.0 27.1% -3.1% 159.3 22.8% 154.5 23.2% 3.1%
EBITDA Margin (%) 24.9% 27.1% -2,2 p.p. 22.8% 23.2% -0,4 p.p.
Recurring EBITDA 49.3 19.8% 49.6 21.0% -0.5% 133.2 19.1% 140.1 21.0% -5.0%
EBITDA Margin (%) 19.8% 21.0% -1,2 p.p. 19.1% 21.0% -2 p.p.
Net Financial Result (11.6) -4.7% (33.0) -14.0% 64.9% (45.7) -6.5% (49.4) -7.4% 7.5%
Non-Recurring Income (Loss) 12.7 5.1% 14.4 6.1% -11.8% 26.2 3.7% 14.4 2.2% 81.9%
Income and Social Contr. Taxes (11.3) -4.5% (5.8) -2.4% 95.6% (19.9) -2.9% (12.2) -1.8% 63.1%
Net Income 24.1 9.7% 10.7 4.5% 126.1% 53.9 7.7% 50.9 7.6% 5.7%
Net Debt / EBITDA Debt Profile
Debt
10
Debentures Issue
 Approved by ESM on April 18, 2012
 Public issue of 7,500 debentures
 Non-convertible
 Maturing in 5 years from issue date
 Total: R$ 75 million
Debt (R$ Million) 9M12 9M11 Var. (%)
Short Term Debt 132.0 136.5 -3.3%
Long Term Debt 135.8 95.6 42.1%
Gross Debt 267.8 232.1 15.4%
Cash and Cash Equivalents 7.3 41.2 -82.3%
Net Debt 260.5 190.9 36.4%
% Short Term Debt 49% 59% -9.5 p.p.
Net Debt/EBITDA 1.3 1.0 37.2%
2006 2007 2008 2009 2010 2011 9M12
0.8 x
0.7 x
0.6 x
1.0 x 1.0 x
1.2 x
1.5 x
Short
Term
49%
Long
Term
51%
Investments
Investments in 3Q12
11
3Q11 3Q12
44.2
24.4
Sustainability
34%
Investments
34%
Forests
32%
Investments (R$ million) Breakdown of Investments
1970 1980 1990 2000 2006 2010 2014 2018
25
30
35
44
48
50
55
57
Evolução da Produtividade em Novas Florestas
IMA (m³/haano)
73 eucalyptus plantations
totaling 45,800 hectares
Average Radius
Salto Botucatu
139 km 38 km
Sustainability
Newly Planted Forests
2008 2009 2010 2011 9M12
4,500
hectares
2,040
hectares
4,080
hectares
5,036
hectares
3,046
hectares
New Mechanized Harvesting System
• Substitutes use of chainsaws;
• Higher productivity;
• Lower raw material costs; and
• Benefits for environment and surrounding
rural communities by reducing impacts of activities.
Eucatex reaffirms its Green Seal certification and celebrates its
employees’ commitment to sustainability.
12
Total Processing Capacity Processed Volume in Tons
Ton/Year
Equivalent to
2010 2011 9M12
Trees Forests
240,000
ton
2 million /
year
1,500 ha
101,000
ton
89,4,000
ton
72,100
ton
Gains in Wood Purchases
Wood
Market *
Recycled Variation
Consumption
Dry Ton
Gain
R$ 196.28
ton/dry
R$ 138.07
ton/dry
R$ 58.21
ton/dry
61,257
R$ 3,565
thousand
Recycling Unit – Guaranteed Sustainability and Possibility of Developing New Projects
* Wood chips , CIF
Increase in Productivity of New Forests
Mean Annual Increment (m³/hectare year)
Ibovespa
Eucatex
Shareholders’ EquityMultiples
Capital Markets
Market Value / Book Value per Share 0.7
EV / EBITDA 5.4
Shareholders’ Equity 9.7
13
60%
EUCA4 vs. BOVESPA INDEX (base=100)
-18%
Sep/06 Dec/08 Dec/09 Dec/10 Dec/11 Sep/12
Shareholders' Equity (R$ million) 13.7 531.3 746.9 936.9 997.2 1,051.2
Book Value per Share (R$) 0.15 5.75 8.08 10.14 10.79 11.38
0
200
400
600
800
1000
1200
R$million
Sep 28
R$ 7.50
Oct 19
R$ 8.92
Capital Markets
14
July/1/10
Listing on
Level 1
Corporate
Governance
segment
May/10/12
Notice of
Start of
Studies for
Migrating to
Novo
Mercado
Jul/1/12
Creation of
ECTX S/A
Oct/15/12
Material Fact
Meeting
with
Investors
Adaptation
of Bylaws
Obtaining
Documents
for Listing
D+0-120
Listing of ECTX
as Publicly
Held Company
Authorization
from exchange
for trading on
Novo Mercado
Creation of
PNA and PNB
shares to allow
exchange of
Eucatex PNB
shares for
ECTX ON
shares
D+120-165
Period of
Commitment
to Migration
by Preferred
Shareholders
D+165
Migration of
ECTX to
Novo
Mercado
Novo Mercado Migration Journey
 Greater transparency
 100% tag-along rights
 30% independent directors
 Increased analyst coverage
 Higher liquidity
 Flexibility for growth
José Antonio G. de Carvalho
Executive VP and IRO
Sergio Henrique Ribeiro
Controller
Waneska Bandeira
Investor Relations
+55 (11) 3049-2473
ri@eucatex.com.br
www.eucatex.com.br/ri
IR Contacts
15
This presentation includes forward-looking statements concerning the
business prospects, projections and operating and financial targets of Eucatex
S.A. Indústria e Comércio, which are based on the beliefs and assumptions of
management and on the information currently available to the Company.
Forward‐looking statements are not guarantees of performance and involve
risks, uncertainties and assumptions, since they refer to future events and
therefore depend on circumstances that may or may not occur.
Investors should understand that overall economic and industry conditions
and other operating factors may affect the company’s future results and lead
to results that differ materially from those expressed in these forward‐looking
statements.
16
Disclaimer

Presentations

  • 1.
  • 2.
    Eucatex Group 2 Founded in1951 Segments: Furniture, Resellers, Construction and Exports Subsidiary in Atlanta, GA, USA 73 eucalyptus plantations with total of 45,800 hectares Number of employees: 2,460 Net Revenue 3Q11 3Q12 % Var R$ 235.8 million R$ 249.2 million 5.7% 9M11 9M12 % Var R$ 666.6 million R$ 698.7 million 4.8% Production Unit Fiberboard T-HDF/MDF MDP and Laminate Flooring Paints and Varnish Location Salto, SP Salto, SP Botucatu, SP Salto, SP Number of employees 771 177 452 224 Products and Annual Capacity Fiberboard 240,000 m³ Wall Partitions and Doors 4,8 million T-HDF/MDF 275,000 m³ MDP 430,000 m³ Laminate Flooring 6 million m² Paints and Varnish 36 million Coating Capacity Paint 80 million m² Paper Printing 45 million m² Finish Foil, BP and Lacquer 40 million m²
  • 3.
    3Q11 3Q12 2% 1% 13%14% 24% 22% 20% 20% 19% 20% 22% 23% MDP T-HDF/MDF Paints and Varnishes Hardboard Laminate Flooring Other R$235.8 million R$249.2 million Breakdown by Segment Operating Data Breakdown by Segment/Product Breakdown by Product 3 3Q11 3Q12 41% 41% 46% 44% 8% 11%5% 4% Exports Resellers Construction Furniture R$235.8 million R$249.2 million Fiberboard 31% MDP 56% T-HDF/MDF 13% Furniture Wall Partitions and Doors 16% Laminate Flooring 32% Paints and Varnishes 50% Metallic 2% Construction Fiberboard 91% MDP 3% T-HDF/MDF 6% Exports Fiberboard 17% MDP 4% T-HDF/MDF 79% Resellers
  • 4.
    81%3Q12 Breakdown of CostsMarket (million m²) Fiberboard Installed Capacity Utilization  Total Capacity: 240,000 m³ / year 4 Net Revenue 3Q11 3Q12 Var R$ 46.9 million R$ 50.2 million 7.1% 9M11 9M12 Var R$ 143.8 million R$ 138.8 million -3.5% Domestic Market Share 3Q11 3Q12 Var 9M11 9M12 Var 45% 47% 2 p.p. 48% 46% -2 p.p. Source: ABIPA 1T06 1T07 1T08 1T09 1T10 100 110 120 106 114 100 118 130 104 139 Eucatex Mercado Wood 18% Coating (Paperand Paint) 10% Other Materials 27% Labor 22% Electricity 9% Thermal Power 7% Depreciation 7% 32.0 34.9 3Q11 3Q12 Market
  • 5.
    48%3Q12 832.1 944.1 3Q11 3Q12 T-HDF /MDF Breakdown of Costs Installed Capacity Utilization  Total Capacity: 275,000 m³ / year 5 Market ('000 m³) Net Revenue 3Q11 3Q12 Var R$ 44.7 million R$ 49.9 million 11.8% 9M11 9M12 Var R$ 112.3 million R$ 148.3 million 32.1% MDF Market Share 3Q11 3Q12 Var 9M11 9M12 Var 2% 3% 1 p.p. 2% 3% 1 p.p. T-HDF Market Share 3Q11 3Q12 Var 9M11 9M12 Var 22% 20% -2 p.p. 16% 22% 6 p.p. Source: ABIPA 1T06 1T07 1T08 1T09 1T10 100 110 120 106 114 100 118 130 104 139 Eucatex Mercado Wood 21% Other Materials 12% Resin 36% Labor 9% Electricity 8% Thermal Power 3% Depreciation 11% Market
  • 6.
    80% 89%3Q12 MDP Breakdown ofCosts Installed Capacity Utilization  Capacity: 430,000 m³ / year 6 Market ('000 m³) Net Revenue 3Q11 3Q12 Var R$ 53.4 million R$ 58.0 million 8.6% 9M11 9M12 Var R$ 161.8 million R$ 171.1 million 6.1% Market Share 3Q11 3Q12 Var 9M11 9M12 Var 10% 10% - 11% 10% -1pp % of MDP Coated 3Q11 3Q12 Var 9M11 9M12 Var Eucatex 99% 100% 1 p.p. 95% 100% 5 p.p. Market 19% 21% 2 p.p. 20% 22% 2 p.p. Source: ABIPA 1T06 1T07 1T08 1T09 1T10 100 110 120 106 114 100 118 130 104 139 Eucatex Mercado Wood 12% Coating (Paper + Paint) 28% Other Materials 15% Resin 21% Labor 7% Electricity 6% Thermal Power 5% Depreciation 6% 807.5 814.5 3Q11 3Q12 Market
  • 7.
    94%3Q12 3,173.9 3,350.8 3Q11 3Q12 Laminate Flooring Breakdownof Costs Installed Capacity Utilization  Total Capacity: 6 million m² / year 7 Market ('000 m²) Source: ABIPLAR 1T06 1T07 1T08 1T09 1T10 100 110 120 106 114 100 118 130 104 139 Eucatex Mercado Net Revenue 3Q11 3Q12 Var R$ 30.1 million R$ 34.8 million 15.7% 9M11 9M12 Var R$ 77.9 million R$ 83.4 million 7.1% Market Share 3Q11 3Q12 Var 9M11 9M12 Var 37% 39% 2 p.p. 38% 38% - Wood 6% Coating (Paper) 53% Other Materials 19% Resin 16% Labor 4% Electricity 0% Thermal Power 1% Depreciation 2% Market
  • 8.
    59%3Q12 Paints and Varnish Breakdownof Costs Installed Capacity Utilization  Total Capacity: 36 million gallons / year 8 Market (million gallons) Source: Eucatex 1T06 1T07 1T08 1T09 1T10 100 110 120 106 114 100 118 130 104 139 Eucatex Mercado Net Revenue 3Q11 3Q12 Var R$ 56.2 million R$ 54.4 million -3.2% 9M11 9M12 Var R$ 143.4 million R$ 148.6 million 3.6% Market Share 3Q11 3Q12 Var 9M11 9M12 Var 7% 7% - 7% 7% - 309.9 287.8 3Q11 3Q12 Raw Materials 72% Packaging 17% Labor 7% Electricity 1% Other Costs 2% Depreciation 1% Market
  • 9.
    Financial Data 9 Highlights (R$million) 3Q12 V.A. % 3Q11 V.A. % Var. (%) 9M12 A.V. % 9M11 A.V. % Var. (%) Net Revenue 249.2 100.0% 235.8 100.0% 5.7% 698.7 100.0% 666.6 100.0% 4.8% Fair value biological assets 9.7 3.9% 10.3 4.4% 6.1% 31.9 4.6% 32.0 4.8% 0.0% Cost of Goods Sold (177.7) -71.3% (163.5) -69.3% 8.7% (500.3) -71.6% (463.4) -69.5% 8.0% Gross Income 81.2 32.6% 82.7 35.1% -1.8% 230.3 33.0% 235.2 35.3% -2.1% Gross Margin (%) 32.6% 35.1% -2,5 p.p. 33.0% 35.3% -2,3 p.p. Adm. Expenses (12.6) -5.1% (12.6) -5.4% -0.2% (36.3) -5.2% (35.4) -5.3% 2.6% Selling Expenses (32.9) -13.2% (33.8) -14.3% -2.6% (100.7) -14.4% (95.4) -14.3% 5.6% Other Operating Income and Expenses (1.3) -0.5% (1.2) -0.5% 11.3% 0.0 0.0% (6.2) -0.9% -100.5% EBITDA 62.0 24.9% 64.0 27.1% -3.1% 159.3 22.8% 154.5 23.2% 3.1% EBITDA Margin (%) 24.9% 27.1% -2,2 p.p. 22.8% 23.2% -0,4 p.p. Recurring EBITDA 49.3 19.8% 49.6 21.0% -0.5% 133.2 19.1% 140.1 21.0% -5.0% EBITDA Margin (%) 19.8% 21.0% -1,2 p.p. 19.1% 21.0% -2 p.p. Net Financial Result (11.6) -4.7% (33.0) -14.0% 64.9% (45.7) -6.5% (49.4) -7.4% 7.5% Non-Recurring Income (Loss) 12.7 5.1% 14.4 6.1% -11.8% 26.2 3.7% 14.4 2.2% 81.9% Income and Social Contr. Taxes (11.3) -4.5% (5.8) -2.4% 95.6% (19.9) -2.9% (12.2) -1.8% 63.1% Net Income 24.1 9.7% 10.7 4.5% 126.1% 53.9 7.7% 50.9 7.6% 5.7%
  • 10.
    Net Debt /EBITDA Debt Profile Debt 10 Debentures Issue  Approved by ESM on April 18, 2012  Public issue of 7,500 debentures  Non-convertible  Maturing in 5 years from issue date  Total: R$ 75 million Debt (R$ Million) 9M12 9M11 Var. (%) Short Term Debt 132.0 136.5 -3.3% Long Term Debt 135.8 95.6 42.1% Gross Debt 267.8 232.1 15.4% Cash and Cash Equivalents 7.3 41.2 -82.3% Net Debt 260.5 190.9 36.4% % Short Term Debt 49% 59% -9.5 p.p. Net Debt/EBITDA 1.3 1.0 37.2% 2006 2007 2008 2009 2010 2011 9M12 0.8 x 0.7 x 0.6 x 1.0 x 1.0 x 1.2 x 1.5 x Short Term 49% Long Term 51%
  • 11.
    Investments Investments in 3Q12 11 3Q113Q12 44.2 24.4 Sustainability 34% Investments 34% Forests 32% Investments (R$ million) Breakdown of Investments
  • 12.
    1970 1980 19902000 2006 2010 2014 2018 25 30 35 44 48 50 55 57 Evolução da Produtividade em Novas Florestas IMA (m³/haano) 73 eucalyptus plantations totaling 45,800 hectares Average Radius Salto Botucatu 139 km 38 km Sustainability Newly Planted Forests 2008 2009 2010 2011 9M12 4,500 hectares 2,040 hectares 4,080 hectares 5,036 hectares 3,046 hectares New Mechanized Harvesting System • Substitutes use of chainsaws; • Higher productivity; • Lower raw material costs; and • Benefits for environment and surrounding rural communities by reducing impacts of activities. Eucatex reaffirms its Green Seal certification and celebrates its employees’ commitment to sustainability. 12 Total Processing Capacity Processed Volume in Tons Ton/Year Equivalent to 2010 2011 9M12 Trees Forests 240,000 ton 2 million / year 1,500 ha 101,000 ton 89,4,000 ton 72,100 ton Gains in Wood Purchases Wood Market * Recycled Variation Consumption Dry Ton Gain R$ 196.28 ton/dry R$ 138.07 ton/dry R$ 58.21 ton/dry 61,257 R$ 3,565 thousand Recycling Unit – Guaranteed Sustainability and Possibility of Developing New Projects * Wood chips , CIF Increase in Productivity of New Forests Mean Annual Increment (m³/hectare year)
  • 13.
    Ibovespa Eucatex Shareholders’ EquityMultiples Capital Markets MarketValue / Book Value per Share 0.7 EV / EBITDA 5.4 Shareholders’ Equity 9.7 13 60% EUCA4 vs. BOVESPA INDEX (base=100) -18% Sep/06 Dec/08 Dec/09 Dec/10 Dec/11 Sep/12 Shareholders' Equity (R$ million) 13.7 531.3 746.9 936.9 997.2 1,051.2 Book Value per Share (R$) 0.15 5.75 8.08 10.14 10.79 11.38 0 200 400 600 800 1000 1200 R$million Sep 28 R$ 7.50 Oct 19 R$ 8.92
  • 14.
    Capital Markets 14 July/1/10 Listing on Level1 Corporate Governance segment May/10/12 Notice of Start of Studies for Migrating to Novo Mercado Jul/1/12 Creation of ECTX S/A Oct/15/12 Material Fact Meeting with Investors Adaptation of Bylaws Obtaining Documents for Listing D+0-120 Listing of ECTX as Publicly Held Company Authorization from exchange for trading on Novo Mercado Creation of PNA and PNB shares to allow exchange of Eucatex PNB shares for ECTX ON shares D+120-165 Period of Commitment to Migration by Preferred Shareholders D+165 Migration of ECTX to Novo Mercado Novo Mercado Migration Journey  Greater transparency  100% tag-along rights  30% independent directors  Increased analyst coverage  Higher liquidity  Flexibility for growth
  • 15.
    José Antonio G.de Carvalho Executive VP and IRO Sergio Henrique Ribeiro Controller Waneska Bandeira Investor Relations +55 (11) 3049-2473 ri@eucatex.com.br www.eucatex.com.br/ri IR Contacts 15
  • 16.
    This presentation includesforward-looking statements concerning the business prospects, projections and operating and financial targets of Eucatex S.A. Indústria e Comércio, which are based on the beliefs and assumptions of management and on the information currently available to the Company. Forward‐looking statements are not guarantees of performance and involve risks, uncertainties and assumptions, since they refer to future events and therefore depend on circumstances that may or may not occur. Investors should understand that overall economic and industry conditions and other operating factors may affect the company’s future results and lead to results that differ materially from those expressed in these forward‐looking statements. 16 Disclaimer