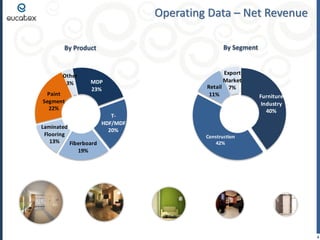
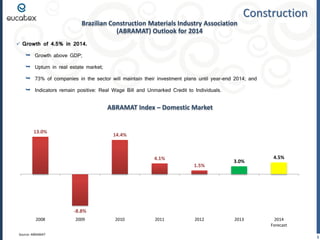
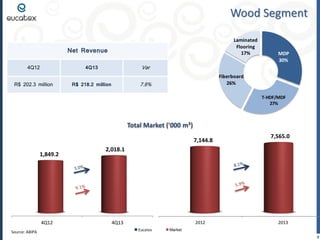
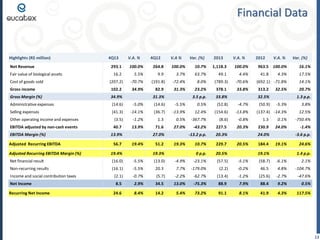
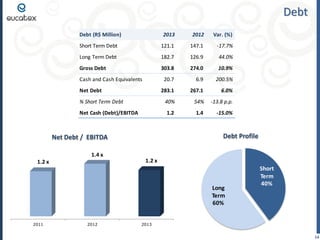
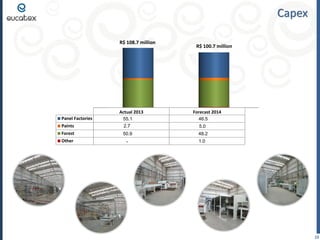
4Q13 Results
February 20, 2014
Eucatex Group
4Q13 General Highlights

Net Revenue – R$ 293.1 million, up 10.7%

Recurring EBITDA – R$ 56.7 million, up 10.7%

EBITDA Margin – 19.4%, stable.

Recurring Net Income – R$ 24.6 million, up 73.2%

2
Eucatex Group
Founded in 1951
Segments: Furniture, Retail, Construction and Exports
Subsidiary in Atlanta, USA

76 eucalyptus farms totaling 46,000 hectares
Number of employees – 2,490

Unit

Location

Employees

Products and Annual
Capacity

Coating Capacity
Paint
80 million m²
Paper Printing
45 million m²

FIBERBOARD

Salto/SP

839

Fiberboard
240,000 m³
Wall Partitions and
Doors
4.8 million

T-HDF/MDF

Salto/SP

166

T-HDF/MDF
275,000 m³

Lacquer
12 million m²
Finish Foil, BP and
Lacquer
40 million m²

MDP AND LAMINATED
FLOORING

Botucatu/SP

442

MDP
430,000 m³
Laminated Flooring
12 million m²

PAINTS AND VARNISHES

Salto/SP

227

Paints and Varnishes
36 million

Bofete/SP

157

Seedlings
10 million

SEEDLING NURSERY

3
Operating Data – Net Revenue
By Segment

By Product

Other
3%

Paint
Segment
22%

MDP
23%

Laminated
Flooring
13%
Fiberboard
19%

Export
Market
Retail 7%
11%

THDF/MDF
20%

Furniture
Industry
40%

Construction
42%

4
Construction
Brazilian Construction Materials Industry Association
(ABRAMAT) Outlook for 2014
 Growth of 4.5% in 2014.



Growth above GDP;



Upturn in real estate market;



73% of companies in the sector will maintain their investment plans until year-end 2014; and



Indicators remain positive: Real Wage Bill and Unmarked Credit to Individuals.

ABRAMAT Index – Domestic Market

13.0%

14.4%

4.1%
1.5%

3.0%

4.5%

-8.8%
2008
Source: ABRAMAT

2009

2010

2011

2012

2013

2014
Forecast
5
Real Estate Market
Minha Casa Minha Vida Housing Program
 Target of 3.75 million homes by 2014

3.750
million

 Household income of up to R$ 5,000.00
 3.2 million homes contracted – 86% of target achieved

3.240
million

3.240
million
86%

 1.5 million homes delivered – 47% of contracted homes

Target

Achieved

 Investments of R$ 198 billion by 2013

Source: CEF

1.510
million
47%
Contracted Units

Delivered Units

Other Indicators
 SBPE – For 2014, estimated +9.1% in units and +20.8% in value (R$)
 Resumption of real estate launches in 2014

Source: Tendências Consultoria

6
Furniture Industry
Effective Installed Capacity (Fiberboard + MDF + MDP) X Production

9,377
7,969
6,042
5,100

78%

2005

6,382

6,560
83%

5,300

84%

2006

8,386

8,787

81%
82%

82%

2008

2009

77%

2010

2011

81%

2007

84%

Effective installed capacity ('000 m³)

Production

2012

2013

GDP Estimate

(Tendências Consultoria)

Source: Eucatex Estimates

2013 – 2.2%
2014 – 2.1%

7
Minha Casa Melhor Program
CURRENT LIST
– After revision in October 2013

 Launched in June 2013
 Target: 3.75 million families
 Credit card with limit of R$ 5,000.00 for Purchases of
Furniture and Home Appliances

MAX. RETAIL
PRICE

FURNITURE
Wardrobe

R$ 700.00

 Potential Financed Volume – R$ 18.7 billion (equivalent to Double bed or bunk bed (with or without
mattress) or double bed box
25% of the gross revenue of the furniture and home
Single bed or cot (with or without mattress) or
appliances sector in 2012)
 According to Tendências Consultoria, with the launch of
the program, sales of furniture and home appliances
should grow 7.0% in 2014

R$ 500.00
R$ 400.00

single bed box

2013

R$ 400.00

Kitchen furniture

R$ 600.00

Shelving and racks

R$ 350.00

Couch

Estimate of Funds Injected by the Program into the
Retail Sector

Table with chairs

R$ 600.00

Sales of Furniture and Home Appliances
This credit is estimated to have accounted
for 1/3 of the growth in furniture and
home appliance sales in 2013!

12.2%

R$ 1.9
billion

7.0%
5.0%

R$ 4.2
billion

2014

Source: Tendências Consultoria

2012

2013

2014

8
Wood Segment
Laminated
Flooring
17%

Net Revenue
4Q12

Var

4Q13

R$ 202.3 million

MDP
30%

Fiberboard
26%

7.9%

R$ 218.2 million

T-HDF/MDF
27%
139

138

130
110
100

100

4Q12
Source: ABIPA

120
Total Market ('000 m³)

106

104

114

7,144.8

108

7,565.0

2,018.1

1,849.2

1T06

118

1T07

1T08

1T09

4Q13

1T10
2012

Eucatex

1T11
2013

Market
Mercado

9
Wood Segment
Installed Capacity Utilization – 4Q13

11%

84%

81%

12%

81%
59%

Fiberboard
(240,000m³/year)

T-HDF/MDF
(275,000 m³/year)

MDP and Flooring
(430,000 m³/year)

Laminated Flooring
(12 million m²/year)

Breakdown of Costs – 4Q13

Electricity
6%

Thermal
Power
4%

Labor
13%

Resin
17%
Other
Materials
18%

Depreciation
8%

Wood
16%

Coating
(Paper)
18%

Non-Resin Panels (Fiberboard)

Resin Panels

All Panels

Thermal
Electricity Power
Labor
5%
3%
7%

Resin
25%

Other
Materials
15%

Depreciation
8%

Wood
15%

Coating
(Paper)
22%

Electricity
8%

Thermal
Power
7%

Depreciation
10%

Wood
17%
Labor
25%
Other
Materials
25%

Coating
(Paper and
Paint)
8%

10
Paint Segment
Market – million gallons
304.6

306.0

Net Revenue
4Q12

4Q13

Var

R$ 55.4 million

R$ 65.7 million

18.8%

4Q12

4Q13

Source: Eucatex

Installed Capacity Utilization

Market

Breakdown of Costs – 4Q13
Labor
6%

65%

Packaging
15%

Electricity
Other Costs
0%
2%
Depreciation
1%

4Q13
 Total Capacity – 36 million gallons / year

Raw Material
75%
11
Financial Data
Net Revenue / Employee (R$)

Gross Income (R$ million) and Gross Margin (%)

SG&A (R$ million) and SG&A / Net Revenue (%)

EBITDA (R$ million) and EBITDA Margin (%)

12
Financial Data

Highlights (R$ million)
Net Revenue
Fair value of biological assets
Cost of goods sold

4Q13

V.A. %

4Q12

V.A %

Var. (%)

2013

V.A. %

293.1

100.0%

264.8

100.0%

10.7%

1,118.3

100.0%

16.2

5.5%

9.9

3.7%

63.7%

49.1

4.4%

2012

V.A. %

963.5 100.0%
41.8

Var. (%)
16.1%

4.3%

17.5%

(692.1) -71.8%

14.1%

(207.2)

-70.7%

(191.8)

-72.4%

8.0%

(789.3)

-70.6%

Gross income

102.2

34.9%

82.9

31.3%

23.2%

378.1

33.8%

Gross Margin (%)

34.9%

3.5 p.p.

33.8%

Administrative expenses

(14.6)

-5.0%

(14.6)

-5.5%

0.5%

(52.8)

-4.7%

Selling expenses

(41.3)

-14.1%

(36.7)

-13.9%

12.4%

(154.6)

-13.8%

Other operating income and expenses

(3.5)

-1.2%

1.3

0.5%

-367.7%

(8.6)

-0.8%

1.3

0.1%

-750.4%

EBITDA adjusted by non-cash events

40.7

13.9%

71.6

27.0%

-43.2%

227.5

20.3%

230.9

24.0%

-1.4%

-13.2 p.p.

20.3%

10.7%

229.7

0 p.p.

20.5%

EBITDA Margin (%)
Adjusted Recurring EBITDA

31.3%

13.9%
56.7

27.0%
19.4%

51.2

19.3%

32.5%

32.5%
(50.9)

1.3 p.p.
-5.3%

3.8%

(137.4) -14.3%

12.5%

24.0%
20.5%

20.7%

184.4

-3.6 p.p.
19.1%

19.4%

Net financial result

(16.0)

-5.5%

(13.0)

-4.9%

-23.1%

(57.5)

-5.1%

(58.7)

-6.1%

2.1%

Non-recurring results

(16.1)

-5.5%

20.3

7.7%

-179.0%

(2.2)

-0.2%

46.5

4.8%

-104.7%

(2.1)

-0.7%

(5.7)

-2.2%

-62.7%

(13.4)

-1.2%

(25.6)

-2.7%

-47.6%

8.5

2.9%

34.5

13.0%

-75.3%

88.9

7.9%

88.4

9.2%

0.5%

24.6

8.4%

14.2

5.4%

73.2%

91.1

8.1%

41.9

4.3%

117.5%

Net Income
Recurring Net Income

19.1%

24.6%

Adjusted Recurring EBITDA Margin (%)

Income and social contribution taxes

19.3%

313.2

1.4 p.p.

13
Debt
Debt (R$ Million)

2013

2012

Var. (%)

Short Term Debt

121.1

147.1

-17.7%

Long Term Debt

182.7

126.9

44.0%

Gross Debt

303.8

274.0

10.9%

20.7

6.9

200.5%

283.1

267.1

6.0%

40%

54%

-13.8 p.p.

1.2

1.4

-15.0%

Cash and Cash Equivalents
Net Debt
% Short Term Debt
Net Cash (Debt)/EBITDA

Debt Profile

Net Debt / EBITDA
1.4 x

1.2 x

1.2 x

Long
Term
60%
2011

2012

Short
Term
40%

2013

14
Capex
R$ 108.7 million

Panel Factories

Actual 2013
55,1230
55.1

R$ 100.7 million

Forecast 2014
46,5220
46.5

Paints

2.7
2,6870

5,00
5.0

Forest

50,8630
50.9

48,2070
48.2

Other

- ,00

1,00
1.0

15
Sustainability – Forests and Recycling
76 farms with
eucalyptus
Plantations,
totaling
46,000
hectares

Total Processing Capacity - Recycling

Average Radius
Salto

Botucatu

168 km

41 Km

Equivalent to

Ton/Year
240,000 ton

Trees

Forests

2 million / year

1,500 hectares

Volume Processed (ton) - Recycling

Newly Planted Forests (hectares)

113,773
99,808
89,383

5,036

4,603

4,579

4,080

2011

2012

2013

Gains in Wood Purchases – Recycling
2010

2011

2012

2013

Wood
Market *

Recycled

Variation

Consump.
Dry Ton

Gain

R$ 210.60
ton/dry

R$ 141.99
ton/dry

R$ 68.61
ton/dry

96,707

R$ 6,635
thousand

* Wood chips - CIF
16
IR Contacts
José Antonio G. de Carvalho
Executive VP and IRO
Waneska Bandeira
Investor Relations

(55 11) 3049-2473
ri@eucatex.com.br
www.eucatex.com.br/ri

Eucatex 4Q13

  • 1.
  • 2.
    Eucatex Group 4Q13 GeneralHighlights Net Revenue – R$ 293.1 million, up 10.7% Recurring EBITDA – R$ 56.7 million, up 10.7% EBITDA Margin – 19.4%, stable. Recurring Net Income – R$ 24.6 million, up 73.2% 2
  • 3.
    Eucatex Group Founded in1951 Segments: Furniture, Retail, Construction and Exports Subsidiary in Atlanta, USA 76 eucalyptus farms totaling 46,000 hectares Number of employees – 2,490 Unit Location Employees Products and Annual Capacity Coating Capacity Paint 80 million m² Paper Printing 45 million m² FIBERBOARD Salto/SP 839 Fiberboard 240,000 m³ Wall Partitions and Doors 4.8 million T-HDF/MDF Salto/SP 166 T-HDF/MDF 275,000 m³ Lacquer 12 million m² Finish Foil, BP and Lacquer 40 million m² MDP AND LAMINATED FLOORING Botucatu/SP 442 MDP 430,000 m³ Laminated Flooring 12 million m² PAINTS AND VARNISHES Salto/SP 227 Paints and Varnishes 36 million Bofete/SP 157 Seedlings 10 million SEEDLING NURSERY 3
  • 4.
    Operating Data –Net Revenue By Segment By Product Other 3% Paint Segment 22% MDP 23% Laminated Flooring 13% Fiberboard 19% Export Market Retail 7% 11% THDF/MDF 20% Furniture Industry 40% Construction 42% 4
  • 5.
    Construction Brazilian Construction MaterialsIndustry Association (ABRAMAT) Outlook for 2014  Growth of 4.5% in 2014.  Growth above GDP;  Upturn in real estate market;  73% of companies in the sector will maintain their investment plans until year-end 2014; and  Indicators remain positive: Real Wage Bill and Unmarked Credit to Individuals. ABRAMAT Index – Domestic Market 13.0% 14.4% 4.1% 1.5% 3.0% 4.5% -8.8% 2008 Source: ABRAMAT 2009 2010 2011 2012 2013 2014 Forecast 5
  • 6.
    Real Estate Market MinhaCasa Minha Vida Housing Program  Target of 3.75 million homes by 2014 3.750 million  Household income of up to R$ 5,000.00  3.2 million homes contracted – 86% of target achieved 3.240 million 3.240 million 86%  1.5 million homes delivered – 47% of contracted homes Target Achieved  Investments of R$ 198 billion by 2013 Source: CEF 1.510 million 47% Contracted Units Delivered Units Other Indicators  SBPE – For 2014, estimated +9.1% in units and +20.8% in value (R$)  Resumption of real estate launches in 2014 Source: Tendências Consultoria 6
  • 7.
    Furniture Industry Effective InstalledCapacity (Fiberboard + MDF + MDP) X Production 9,377 7,969 6,042 5,100 78% 2005 6,382 6,560 83% 5,300 84% 2006 8,386 8,787 81% 82% 82% 2008 2009 77% 2010 2011 81% 2007 84% Effective installed capacity ('000 m³) Production 2012 2013 GDP Estimate (Tendências Consultoria) Source: Eucatex Estimates 2013 – 2.2% 2014 – 2.1% 7
  • 8.
    Minha Casa MelhorProgram CURRENT LIST – After revision in October 2013  Launched in June 2013  Target: 3.75 million families  Credit card with limit of R$ 5,000.00 for Purchases of Furniture and Home Appliances MAX. RETAIL PRICE FURNITURE Wardrobe R$ 700.00  Potential Financed Volume – R$ 18.7 billion (equivalent to Double bed or bunk bed (with or without mattress) or double bed box 25% of the gross revenue of the furniture and home Single bed or cot (with or without mattress) or appliances sector in 2012)  According to Tendências Consultoria, with the launch of the program, sales of furniture and home appliances should grow 7.0% in 2014 R$ 500.00 R$ 400.00 single bed box 2013 R$ 400.00 Kitchen furniture R$ 600.00 Shelving and racks R$ 350.00 Couch Estimate of Funds Injected by the Program into the Retail Sector Table with chairs R$ 600.00 Sales of Furniture and Home Appliances This credit is estimated to have accounted for 1/3 of the growth in furniture and home appliance sales in 2013! 12.2% R$ 1.9 billion 7.0% 5.0% R$ 4.2 billion 2014 Source: Tendências Consultoria 2012 2013 2014 8
  • 9.
    Wood Segment Laminated Flooring 17% Net Revenue 4Q12 Var 4Q13 R$202.3 million MDP 30% Fiberboard 26% 7.9% R$ 218.2 million T-HDF/MDF 27% 139 138 130 110 100 100 4Q12 Source: ABIPA 120 Total Market ('000 m³) 106 104 114 7,144.8 108 7,565.0 2,018.1 1,849.2 1T06 118 1T07 1T08 1T09 4Q13 1T10 2012 Eucatex 1T11 2013 Market Mercado 9
  • 10.
    Wood Segment Installed CapacityUtilization – 4Q13 11% 84% 81% 12% 81% 59% Fiberboard (240,000m³/year) T-HDF/MDF (275,000 m³/year) MDP and Flooring (430,000 m³/year) Laminated Flooring (12 million m²/year) Breakdown of Costs – 4Q13 Electricity 6% Thermal Power 4% Labor 13% Resin 17% Other Materials 18% Depreciation 8% Wood 16% Coating (Paper) 18% Non-Resin Panels (Fiberboard) Resin Panels All Panels Thermal Electricity Power Labor 5% 3% 7% Resin 25% Other Materials 15% Depreciation 8% Wood 15% Coating (Paper) 22% Electricity 8% Thermal Power 7% Depreciation 10% Wood 17% Labor 25% Other Materials 25% Coating (Paper and Paint) 8% 10
  • 11.
    Paint Segment Market –million gallons 304.6 306.0 Net Revenue 4Q12 4Q13 Var R$ 55.4 million R$ 65.7 million 18.8% 4Q12 4Q13 Source: Eucatex Installed Capacity Utilization Market Breakdown of Costs – 4Q13 Labor 6% 65% Packaging 15% Electricity Other Costs 0% 2% Depreciation 1% 4Q13  Total Capacity – 36 million gallons / year Raw Material 75% 11
  • 12.
    Financial Data Net Revenue/ Employee (R$) Gross Income (R$ million) and Gross Margin (%) SG&A (R$ million) and SG&A / Net Revenue (%) EBITDA (R$ million) and EBITDA Margin (%) 12
  • 13.
    Financial Data Highlights (R$million) Net Revenue Fair value of biological assets Cost of goods sold 4Q13 V.A. % 4Q12 V.A % Var. (%) 2013 V.A. % 293.1 100.0% 264.8 100.0% 10.7% 1,118.3 100.0% 16.2 5.5% 9.9 3.7% 63.7% 49.1 4.4% 2012 V.A. % 963.5 100.0% 41.8 Var. (%) 16.1% 4.3% 17.5% (692.1) -71.8% 14.1% (207.2) -70.7% (191.8) -72.4% 8.0% (789.3) -70.6% Gross income 102.2 34.9% 82.9 31.3% 23.2% 378.1 33.8% Gross Margin (%) 34.9% 3.5 p.p. 33.8% Administrative expenses (14.6) -5.0% (14.6) -5.5% 0.5% (52.8) -4.7% Selling expenses (41.3) -14.1% (36.7) -13.9% 12.4% (154.6) -13.8% Other operating income and expenses (3.5) -1.2% 1.3 0.5% -367.7% (8.6) -0.8% 1.3 0.1% -750.4% EBITDA adjusted by non-cash events 40.7 13.9% 71.6 27.0% -43.2% 227.5 20.3% 230.9 24.0% -1.4% -13.2 p.p. 20.3% 10.7% 229.7 0 p.p. 20.5% EBITDA Margin (%) Adjusted Recurring EBITDA 31.3% 13.9% 56.7 27.0% 19.4% 51.2 19.3% 32.5% 32.5% (50.9) 1.3 p.p. -5.3% 3.8% (137.4) -14.3% 12.5% 24.0% 20.5% 20.7% 184.4 -3.6 p.p. 19.1% 19.4% Net financial result (16.0) -5.5% (13.0) -4.9% -23.1% (57.5) -5.1% (58.7) -6.1% 2.1% Non-recurring results (16.1) -5.5% 20.3 7.7% -179.0% (2.2) -0.2% 46.5 4.8% -104.7% (2.1) -0.7% (5.7) -2.2% -62.7% (13.4) -1.2% (25.6) -2.7% -47.6% 8.5 2.9% 34.5 13.0% -75.3% 88.9 7.9% 88.4 9.2% 0.5% 24.6 8.4% 14.2 5.4% 73.2% 91.1 8.1% 41.9 4.3% 117.5% Net Income Recurring Net Income 19.1% 24.6% Adjusted Recurring EBITDA Margin (%) Income and social contribution taxes 19.3% 313.2 1.4 p.p. 13
  • 14.
    Debt Debt (R$ Million) 2013 2012 Var.(%) Short Term Debt 121.1 147.1 -17.7% Long Term Debt 182.7 126.9 44.0% Gross Debt 303.8 274.0 10.9% 20.7 6.9 200.5% 283.1 267.1 6.0% 40% 54% -13.8 p.p. 1.2 1.4 -15.0% Cash and Cash Equivalents Net Debt % Short Term Debt Net Cash (Debt)/EBITDA Debt Profile Net Debt / EBITDA 1.4 x 1.2 x 1.2 x Long Term 60% 2011 2012 Short Term 40% 2013 14
  • 15.
    Capex R$ 108.7 million PanelFactories Actual 2013 55,1230 55.1 R$ 100.7 million Forecast 2014 46,5220 46.5 Paints 2.7 2,6870 5,00 5.0 Forest 50,8630 50.9 48,2070 48.2 Other - ,00 1,00 1.0 15
  • 16.
    Sustainability – Forestsand Recycling 76 farms with eucalyptus Plantations, totaling 46,000 hectares Total Processing Capacity - Recycling Average Radius Salto Botucatu 168 km 41 Km Equivalent to Ton/Year 240,000 ton Trees Forests 2 million / year 1,500 hectares Volume Processed (ton) - Recycling Newly Planted Forests (hectares) 113,773 99,808 89,383 5,036 4,603 4,579 4,080 2011 2012 2013 Gains in Wood Purchases – Recycling 2010 2011 2012 2013 Wood Market * Recycled Variation Consump. Dry Ton Gain R$ 210.60 ton/dry R$ 141.99 ton/dry R$ 68.61 ton/dry 96,707 R$ 6,635 thousand * Wood chips - CIF 16
  • 17.
    IR Contacts José AntonioG. de Carvalho Executive VP and IRO Waneska Bandeira Investor Relations (55 11) 3049-2473 ri@eucatex.com.br www.eucatex.com.br/ri