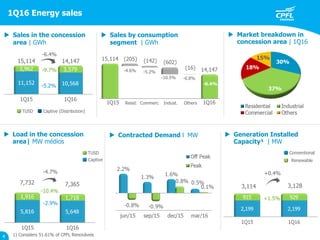
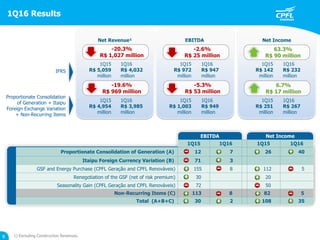
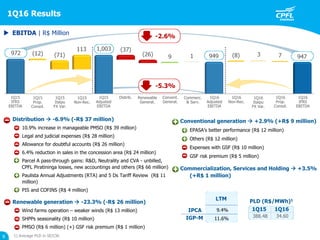
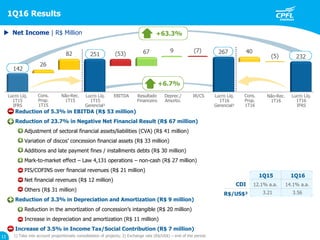
1Q16 Results
Disclaimer
2
This presentation may contain statements that represent expectations about future events or results according to
Brazilian and international securities regulators. These statements are based on certain assumptions and analyses
made by the Company pursuant to its experience and the economic environment, market conditions and expected
future events, many of which are beyond the Company's control. Important factors that could lead to significant
differences between actual results and expectations about future events or results include the Company's business
strategy, Brazilian and international economic conditions, technology, financial strategy, developments in the utilities
industry, hydrological conditions, financial market conditions, uncertainty regarding the results of future operations,
plans, objectives, expectations and intentions, among others. Considering these factors, the Company's actual
results may differ materially from those indicated or implied in forward-looking statements about future events or
results.
The information and opinions contained herein should not be construed as a recommendation to potential investors
and no investment decision should be based on the truthfulness, timeliness or completeness of such information or
opinions. None of the advisors to the company or parties related to them or their representatives shall be liable for
any losses that may result from the use or contents of this presentation.
This material includes forward-looking statements subject to risks and uncertainties, which are based on current
expectations and projections about future events and trends that may affect the Company's business.
These statements may include projections of economic growth, demand, energy supply, as well as information
about its competitive position, the regulatory environment, potential growth opportunities and other matters. Many
factors could adversely affect the estimates and assumptions on which these statements are based.
Highlights 1Q16
3
 Sales dropped 6.4% in the concession area - residential (-4.6%), commercial (-5.2%) and
industrial (-10.5%)
 Stability in contracted demand: +0.5% Off Peak and +0.1% Peak (Mar-16 x Mar-15)
 Decrease of 56% in CVA balance – from R$ 1.7 billion in Dec-15 to R$ 0.7 billion in Mar-161
 CPFL Paulista tariff adjustment, in Apr-16, with an average effect of 7.55% on
consumer billings
 Approval of periodic tariff review of 5 discos, with an average effect on consumer Billings
of: CPFL Jaguari (13.25%), CPFL Mococa (9.02%), CPFL Leste Paulista (13.32%),
CPFL Santa Cruz (7.15%) and CPFL Sul Paulista (12.82%)
 Commercial start-up of Mata Velha SHPP (24 MW) and of 4 UGs in Campo dos Ventos
and São Benedito wind complex (8 MW), in May-16
 Renegotiation of the hydrological risk of Baesa HPP (26 MW average), bringing up
an additional benefit of R$ 8 million
 Decrease of R$ 143 million in GSF expenses
 Announcement of CEO succession process, with a transition phase until
July 1st , 2016
 Investments of R$ 446 million
 Approval of the proposal of capital increase through stock
dividend; new shares distributed to shareholders
on May 5, 2016
 2015 Annual Report released on
Mar 31, 2016
1) Balance of sectoral financial assets and liabilities, excluding tariff
flags not approved by Aneel up to the date special obligations
accounted under 4th Tariff Review Cycle methodology.
Resid.
-5.2%
-10.5% -0.8%
-6.4%
Commerc Indust. Others1Q15 1Q16
-4.6%
 Sales in the concession
area | GWh
 Sales by consumption
segment | GWh
 Load in the concession
area| MW médios
15,114 14,147
-9.7%
TUSD Captive (Distribution)
-6.4%
-5.2%
 Generation Installed
Capacity¹ | MW
 Market breakdown in
concession area | 1Q16
1Q16 Energy sales
 Contracted Demand l MW
3,114 3,128
+0.4%
+1.5%
Renewable
Conventional
-2.9%
TUSD
Captive
4
-4.7%
7,732 7,365
-10.4%
1) Considers 51.61% of CPFL Renováveis
Payroll1 and Consumption per residential customer (kWh/customer)
1) Source: LCA. Index number (Jan/14=100), with seasonal adjustment; 2) Source: IBGE 3) Source: LCA 4) Source: Abilux
Residential Segment
5
 IPCA inflation (Accumulated 12 months)2
In %
Superfluous consumption
reduction
Forecast 2016³
7.0%
Context 2016
• Lower and negative expected real tariff adjustments
• Energy: essential good, without direct substitute
• Considerable efficiency gains (lamp replacement) occurred
in 2015 – potential is lower
• LED lamp sales4 – 2014: 27 million|2015: 81
million
• The adjustments of 2015 were in superfluous
consumption – Additional reductions will affect the
costumer comfort and tend not to happen in the same
proportion
Migration of delinquency from D30 customer to
D90  change in collection actions
Strengthening of Collection Actions
(
• Tariff increase 1Q16 vs 1Q15: 51.5 %
• Deteriorated Macroeconomic Scenario (1Q16)
- Unemployment rate :
- Payroll:
- Inflation rate:
Delinquency | Strengthening of PDA and D90 costumer focus
 Evolution of PDA
(1) March-16 with seasonal adjustment. Source: PNAD; (2) Compared to 1Q15. Source: PNAD; (3) IPCA: 12 months ended in Mar-16. Source: IBGE6
PDA as % of Gross Revenue is still low
 Total overdue bills | R$ million
This increase reflects , mainly due to:
- +1 day in load, not yet reflected in the billing schedule
in 1Q16
Such effects will be offset in the following quarters
In 1Q16, consolidated losses of CPFL Energia presented an increase, reaching 8.63%
1Q16 Losses
7
 Total Losses – Consolidated l last 12 months
Losses
12-month moving average 1
8.2%
8.1% 8.0% 8.0%
8.1%
1) The 12-month moving average is an indicator that mitigates the effect of unbilled on losses, indicating whether losses are out of control or it is
just an one-off effect of unbilled, to be offset in subsequent periods.
1Q16 Results
8
-2.6%
R$ 25 million
Net IncomeEBITDANet Revenue¹
EBITDA Net Income
1Q15 1Q16 1Q15 1Q16
Proportionate Consolidation of Generation (A) 12 7 26 40
Itaipu Foreign Currency Variation (B) 71 3
GSF and Energy Purchase (CPFL Geração and CPFL Renováveis) 155 8 112 5
Renegotiation of the GSF (net of risk premium) 30 20
Seasonality Gain (CPFL Geração and CPFL Renováveis) 72 50
Non-Recurring Items (C) 113 8 82 5
Total (A+B+C) 30 2 108 35
1Q16
R$ 232
million
1Q15
R$ 142
million
1Q16
R$ 947
million
1Q15
R$ 972
million
1Q16
R$ 4,032
million
1Q15
R$ 5,059
million
-20.3%
R$ 1,027 million
-19.6%
R$ 969 million
1Q16
R$ 267
million
1Q15
R$ 251
million
1Q16
R$ 949
million
1Q15
R$ 1,003
million
1Q16
R$ 3,985
million
1Q15
R$ 4,954
million
63.3%
R$ 90 million
Proportionate Consolidation
of Generation + Itaipu
Foreign Exchange Variation
+ Non-Recurring Items
-5.3%
R$ 53 million
1) Excluding Construction Revenues.
6.7%
R$ 17 million
IFRS
1Q16 Results
9
Distribution  -6.9% (-R$ 37 million)
10.9% increase in manageable PMSO (R$ 39 million)
Legal and judicial expenses (R$ 28 million)
Allowance for doubtful accounts (R$ 26 million)
6.4% reduction in sales in the concession area (R$ 24 million)
Parcel A pass-through gains: R&D, Neutrality and CVA - unbilled,
CPFL Piratininga losses, new accountings and others (R$ 66 million)
Paulista Annual Adjustments (RTA) and 5 Ds Tariff Review (R$ 11
million)
PIS and COFINS (R$ 4 million)
Renewable generation  -23.3% (-R$ 26 million)
Wind farms operation – weaker winds (R$ 13 million)
SHPPs seasonality (R$ 10 million)
PMSO (R$ 6 million) (+) GSF risk premium (R$ 1 million)
 EBITDA | R$ Million
PLD (R$/MWh)1
388.48 34.60
1Q15 1Q169.4%
LTM
IPCA
IGP-M 11.6%
Conventional generation  +2.9% (+R$ 9 million)
EPASA’s better performance (R$ 12 million)
Others (R$ 12 million)
Expenses with GSF (R$ 10 million)
GSF risk premium (R$ 5 million)
Commercialization, Services and Holding  +3.5%
(+R$ 1 million)
1) Average PLD in SE/CW.
1Q15
Adjusted
EBITDA
1Q16
Adjusted
EBITDA
1Q15
Non-Rec.
1Q16
Non-Rec.
1Q15
IFRS
EBITDA
1Q16
IFRS
EBITDA
1Q16
Prop.
Consol.
1Q15
Prop.
Consol.
Distrib. Convent.
Generat.
Renewable
Generat.
Commerc.
& Serv.
1Q16
Itaipu
FX Var.
1Q15
Itaipu
FX Var.
-5.3%
-2.6%
Manageable expenses | New approach - Productivity
10
P
MSO
1,377
1,248
1,346 1,330
 Nominal Adjusted PMSO | R$ Million
+0.7%
1,430 1,439
P
MSO
1,567
1,465
1,808
1,656
-2.2%
1,472 1,439
 Real Adjusted PMSO¹ | R$ Million
IGPM: 34.3%
2011 to 2014
Creation of decision
packages and
budget planning
according to ZBB
methodology

2015/2016
Productivity monitoring
Application of Technology to provide higher productivity in the
Distribution segment activities, such as:
 evolution and comparison through indicators created for productivity
measurement
 analysis of team’s unavailability
 Team’s daily management
 dashboards in real time
1) March/16. Variation of IGP-M in the period 1Q16LTM x 2011= 34.3%. PMSO disregarding Private Pension Fund. Excludes non-recurring items, acquisition of fuel oil for
EPASA power plants, PMSO of Services and CPFL Renováveis segments, Legal, Judicial and Indemnities and Personnel capitalization costs since January 2014, due to the
new methodology established by Aneel.
R$ 369 million
1Q16 Results
11
Reduction of 5.3% in EBITDA (R$ 53 million)
Reduction of 23.7% in Negative Net Financial Result (R$ 67 million)
Adjustment of sectoral financial assets/liabilities (CVA) (R$ 41 million)
Variation of discos’ concession financial assets (R$ 33 million)
Additions and late payment fines / installments debts (R$ 30 million)
Mark-to-market effect – Law 4,131 operations – non-cash (R$ 27 million)
PIS/COFINS over financial revenues (R$ 21 million)
Net financial revenues (R$ 12 million)
Others (R$ 31 million)
Reduction of 3.3% in Depreciation and Amortization (R$ 9 million)
Reduction in the amortization of concession’s intangible (R$ 20 million)
Increase in depreciation and amortization (R$ 11 million)
Increase of 3.5% in Income Tax/Social Contribution (R$ 7 million)
12.1% a.a. 14.1% a.a.
1Q15 1Q16
CDI
R$/US$² 3.21 3.56
 Net Income | R$ Million
Lucro Líq.
1T15
Gerencial¹
Deprec./
Amortiz.
Lucro Líq.
1T16
Gerencial¹
Não-Rec.
1T16
Lucro Líq.
1T15
IFRS
Lucro Líq.
1T16
IFRS
IR/CSEBITDA Resultado
Financeiro
Não-Rec.
1T15
Cons.
Prop.
1T16
Cons.
Prop.
1T15
+63.3%
+6.7%
1) Take into account proportionate consolidation of projects; 2) Exchange rate (R$/US$) – end of the period.
Annual Tariff Readjustment
Parcel
A
Parcel
B
Customer
Average
Effect
Parcel B
Gain1
Financial
Components
CFPL
Santa Cruz
-2.46% 6.43% 7.15% 7 43
CPFL
Leste Paulista
-2.79% 19.64% 13.32% 2 4
CPFL
Sul Paulista
-3.72% 18.26% 12.82% 3 11
CPFL
Jaguari
-1.43% 17.41% 13.25% 1 18
CPFL
Mococa
-3.53% 11.29% 9.02% 2 4
Consolidated effect 15 80
 Increase of Parcel B
 Increase in Net RAB
 Increase in WACC from 7.50% to 8.09%
 Increase in BAR remuneration
 Addition of special obligations
remuneration
 Pass-through of accumulated CVA and other financial components
 Pass-through of R$ 951 million in CVA and others financial
components
 Decrease of Parcel A
 Decrease in 2016 CDE Quota
 Decrease in Itaipu tariff (in US$)
 Addition of energy from quotas
12
 Pass through of accumulated CVA and
other financial components
 Pass-through of R$ 80 million in CVA
and others financial components
RTA
Parcel
A
Parcel
B
Customer
Average Effect
Financial
Components
CPFL
Paulista
-2.51% 10.06% 7.55% 951
4th Cycle of Periodic Tariff Review
Tariff events:
Accumulated CVA and Parcel B adjustments
CPFL Paulista ATR
R$ 951 million
5 Discos 4CPTR
R$ 80 million
 CVA Balance | R$ million
1) Reflecting 4th Cycle of Periodic Tariff Review new methodology.
Indebtedness | Financial Covenants Management
13
3,736 3,835 3,755 3,971 3,584 3,577
Adjusted EBITDA1,2
R$ Million
CPFL Energia received a significant amount related to CVA in 1Q16.
Adjusting the cash balance plus the CVA asset (until 1Q16), the Net Debt / EBITDA would reach 3.22x
Nominal
Real
1) Financial covenants criteria; 2) LTM recurring EBITDA; 3) Adjusted by the proportional consolidation since 2012; 4) Financial debt (+) private pension fund (-) hedge
CDI
Prefixed
(PSI)
IGP
TJLP
 Leverage1 l R$ Billion
 Gross Debt Cost3,4 l LTM  Gross Debt Breakdown by
Indexer| 1Q161,4
Adjusted Net Debt1
/Adjusted EBITDA2
Adjusted by CVA
cash in balance
Debt Profile | On March 31, 2016
14
Cash Coverage:
2,32x Short term
amortization (12M)
Average Tenor: 3.43 years
Short-term (12M): 11.2% of total
3
1) ) Considers Debt Principal, excluding servicing and including hedge; 2) Financial covenants criteria; 3) Amortization from April-2016 to March-2017
 Debt Amortization Schedule1,2 l Mar-16 | R$ Million
No impact for the consumer
CPFL
Exposure
Mitigation potential depends on the
possible deals with generators
The impact of special customers migration to the free market still need be better
discussed among agents and ANEEL
For CPFL Energia, migration in 2016 already represents approximately 1.8%
In the current context, PH 04 and PH 012 mitigate the over contracted position
issue for CPFL Energia in 2016
PH04 (March/16)
Recognition of involuntary
overplus deriving from energy
quotas
Mitigation ≈ 4%
Over contracted position | Measures to mitigate over contracted
positions of discos
15


Before
HP04
180
MWavg
Residual
(in function of the
macroeconomic
scenario and
temperature)
After
HP04
PH012 (April/16)
Simplify the process for
postponement of new
energy contracts
Some mitigation
potential
Actions to mitigate the
over contracted position
Commercial
Start-up
Installed
Capacity
Assured Energy PPA1
Location Financing
May-16 24.0 MW
13.1
average-MW
16th LEN 20132 R$
155,55/MWh until
2047
Unaí/MG
BNDES
(approved)
SHPP Mata Velha
16
Panoramic view
(substation and reservoir)
Dam axis
1) Constant currency (mar/16); 2) The power generated will be injected into the system and sold on the free market until the beginning of the energy
sales contract in January 2018.
CPFL Renováveis
anticipated the
operation in more
than 1 year and a
half
Commercial Start-up
2016-2020(e)
306 MW
of installed capacity
166
average-MW
of assured energy
1) Gradual commercial operation from 2Q16; 2) Gradual commercial operation from 1H18; 3) Constant Currency (Mar-16).
Campo dos Ventos and São
Benedito Wind Farms
Pedra Cheirosa Wind Farms Boa Vista II SHPP
Commercial Start-up 20161 20182 2020
Installed Capacity 231.0 MW 48.3 MW 26.5 MW
Assured Energy 125.2 average-MW 26.1 average-MW3 14.8 average-MW
PPA3 ACL 20 years
18º LEN 2014
R$ 138.39/MWh until 2037
21º LEN 2015
R$ 219.77/MWh
until 2049
Financing
BNDES
(approved)
BNDES
(being structured)
BNDES
(being structured)
17
Generation | Greenfield projects
Commercial start-up of 4
wind turbines (8,4 MW) in
May-16
 Savings: around 3,500 MWh/year (12% of total
consumption)
 Postponement of the construction of a substation
 More attractive prices in free market
 Sustainability
Benefits - Algar
CPFL Eficiência – Algar Tech
18
Participation in gains (estimated solar generation
+energy efficiency) in 10 years
BOT¹ Agreement - asset remuneration in 6 years
Energy commercialization by CPFL Brasil during 10
years
 Replacement of 15,023 lamps to tubular LED
technology
 Air conditioning system: Replacement of the
refrigerant fluid
 Construction of 2 solar power plants: Campinas
(198 kWp) and Uberlândia (increase of 409.2 kWp)
 27% saving with energy efficiency due to
photovoltaic generation
Initial Investment: R$ 6 million
Inauguration in March-2016












Project
First CPFL’s commercial case in solar distributed generation, through
the subsidiary CPFL Eficiência

Benefits - CPFL Energia
(1) Build, Operation, Transfer
Source: Economática; 1) Adjusted by dividends; 2) Up to 03/31/2016
 Daily average trading volume
on BM&FBovespa + NYSE2 | R$ Million
Bovespa NYSE Daily average number of
trades on BM&FBovespa
 Shares performance
on BM&F Bovespa | 1Q161,2
 Shares performance on NYSE | 1Q161,2
 CPFL Energia is included in the main indexes
19
Stock Market Performance
CPL
Dow Jones
Index
Dow Jones
Br20CPFE3 IEE IBOV
29.1%
12.3% 15.5%
46.8%
26.8%
1.5%
1T15 1T16
22.8 28.3
13.5
12.2
+52.2%
5,581
8,492
36.3
40.5
Entry in January - 16
 On April 2016, CPFL Energia announced the conclusion of the Chief
Executive Officer (CEO) Succession Plan
 The Succession Plan is part of a planned process, according
to the best practices of Corporate Governance
 After 18 years, Wilson Ferreira Jr. will step down from the
CEO position
 Andre Dorf, who joined the CPFL three years ago
as the CEO of CPFL Renováveis, will be the new CEO
 Both Executives are working together until July, 1st
to ensure a smooth and natural transition
Chief Executive Officer (CEO) Succession Plan
20
Wilson Ferreira Jr.
Andre Dorf
© CPFL 2015. Todos os direitos reservados.

Presentation 1Q16 - CPFL Energia

  • 1.
  • 2.
    Disclaimer 2 This presentation maycontain statements that represent expectations about future events or results according to Brazilian and international securities regulators. These statements are based on certain assumptions and analyses made by the Company pursuant to its experience and the economic environment, market conditions and expected future events, many of which are beyond the Company's control. Important factors that could lead to significant differences between actual results and expectations about future events or results include the Company's business strategy, Brazilian and international economic conditions, technology, financial strategy, developments in the utilities industry, hydrological conditions, financial market conditions, uncertainty regarding the results of future operations, plans, objectives, expectations and intentions, among others. Considering these factors, the Company's actual results may differ materially from those indicated or implied in forward-looking statements about future events or results. The information and opinions contained herein should not be construed as a recommendation to potential investors and no investment decision should be based on the truthfulness, timeliness or completeness of such information or opinions. None of the advisors to the company or parties related to them or their representatives shall be liable for any losses that may result from the use or contents of this presentation. This material includes forward-looking statements subject to risks and uncertainties, which are based on current expectations and projections about future events and trends that may affect the Company's business. These statements may include projections of economic growth, demand, energy supply, as well as information about its competitive position, the regulatory environment, potential growth opportunities and other matters. Many factors could adversely affect the estimates and assumptions on which these statements are based.
  • 3.
    Highlights 1Q16 3  Salesdropped 6.4% in the concession area - residential (-4.6%), commercial (-5.2%) and industrial (-10.5%)  Stability in contracted demand: +0.5% Off Peak and +0.1% Peak (Mar-16 x Mar-15)  Decrease of 56% in CVA balance – from R$ 1.7 billion in Dec-15 to R$ 0.7 billion in Mar-161  CPFL Paulista tariff adjustment, in Apr-16, with an average effect of 7.55% on consumer billings  Approval of periodic tariff review of 5 discos, with an average effect on consumer Billings of: CPFL Jaguari (13.25%), CPFL Mococa (9.02%), CPFL Leste Paulista (13.32%), CPFL Santa Cruz (7.15%) and CPFL Sul Paulista (12.82%)  Commercial start-up of Mata Velha SHPP (24 MW) and of 4 UGs in Campo dos Ventos and São Benedito wind complex (8 MW), in May-16  Renegotiation of the hydrological risk of Baesa HPP (26 MW average), bringing up an additional benefit of R$ 8 million  Decrease of R$ 143 million in GSF expenses  Announcement of CEO succession process, with a transition phase until July 1st , 2016  Investments of R$ 446 million  Approval of the proposal of capital increase through stock dividend; new shares distributed to shareholders on May 5, 2016  2015 Annual Report released on Mar 31, 2016 1) Balance of sectoral financial assets and liabilities, excluding tariff flags not approved by Aneel up to the date special obligations accounted under 4th Tariff Review Cycle methodology.
  • 4.
    Resid. -5.2% -10.5% -0.8% -6.4% Commerc Indust.Others1Q15 1Q16 -4.6%  Sales in the concession area | GWh  Sales by consumption segment | GWh  Load in the concession area| MW médios 15,114 14,147 -9.7% TUSD Captive (Distribution) -6.4% -5.2%  Generation Installed Capacity¹ | MW  Market breakdown in concession area | 1Q16 1Q16 Energy sales  Contracted Demand l MW 3,114 3,128 +0.4% +1.5% Renewable Conventional -2.9% TUSD Captive 4 -4.7% 7,732 7,365 -10.4% 1) Considers 51.61% of CPFL Renováveis
  • 5.
    Payroll1 and Consumptionper residential customer (kWh/customer) 1) Source: LCA. Index number (Jan/14=100), with seasonal adjustment; 2) Source: IBGE 3) Source: LCA 4) Source: Abilux Residential Segment 5  IPCA inflation (Accumulated 12 months)2 In % Superfluous consumption reduction Forecast 2016³ 7.0% Context 2016 • Lower and negative expected real tariff adjustments • Energy: essential good, without direct substitute • Considerable efficiency gains (lamp replacement) occurred in 2015 – potential is lower • LED lamp sales4 – 2014: 27 million|2015: 81 million • The adjustments of 2015 were in superfluous consumption – Additional reductions will affect the costumer comfort and tend not to happen in the same proportion
  • 6.
    Migration of delinquencyfrom D30 customer to D90  change in collection actions Strengthening of Collection Actions ( • Tariff increase 1Q16 vs 1Q15: 51.5 % • Deteriorated Macroeconomic Scenario (1Q16) - Unemployment rate : - Payroll: - Inflation rate: Delinquency | Strengthening of PDA and D90 costumer focus  Evolution of PDA (1) March-16 with seasonal adjustment. Source: PNAD; (2) Compared to 1Q15. Source: PNAD; (3) IPCA: 12 months ended in Mar-16. Source: IBGE6 PDA as % of Gross Revenue is still low  Total overdue bills | R$ million
  • 7.
    This increase reflects, mainly due to: - +1 day in load, not yet reflected in the billing schedule in 1Q16 Such effects will be offset in the following quarters In 1Q16, consolidated losses of CPFL Energia presented an increase, reaching 8.63% 1Q16 Losses 7  Total Losses – Consolidated l last 12 months Losses 12-month moving average 1 8.2% 8.1% 8.0% 8.0% 8.1% 1) The 12-month moving average is an indicator that mitigates the effect of unbilled on losses, indicating whether losses are out of control or it is just an one-off effect of unbilled, to be offset in subsequent periods.
  • 8.
    1Q16 Results 8 -2.6% R$ 25million Net IncomeEBITDANet Revenue¹ EBITDA Net Income 1Q15 1Q16 1Q15 1Q16 Proportionate Consolidation of Generation (A) 12 7 26 40 Itaipu Foreign Currency Variation (B) 71 3 GSF and Energy Purchase (CPFL Geração and CPFL Renováveis) 155 8 112 5 Renegotiation of the GSF (net of risk premium) 30 20 Seasonality Gain (CPFL Geração and CPFL Renováveis) 72 50 Non-Recurring Items (C) 113 8 82 5 Total (A+B+C) 30 2 108 35 1Q16 R$ 232 million 1Q15 R$ 142 million 1Q16 R$ 947 million 1Q15 R$ 972 million 1Q16 R$ 4,032 million 1Q15 R$ 5,059 million -20.3% R$ 1,027 million -19.6% R$ 969 million 1Q16 R$ 267 million 1Q15 R$ 251 million 1Q16 R$ 949 million 1Q15 R$ 1,003 million 1Q16 R$ 3,985 million 1Q15 R$ 4,954 million 63.3% R$ 90 million Proportionate Consolidation of Generation + Itaipu Foreign Exchange Variation + Non-Recurring Items -5.3% R$ 53 million 1) Excluding Construction Revenues. 6.7% R$ 17 million IFRS
  • 9.
    1Q16 Results 9 Distribution -6.9% (-R$ 37 million) 10.9% increase in manageable PMSO (R$ 39 million) Legal and judicial expenses (R$ 28 million) Allowance for doubtful accounts (R$ 26 million) 6.4% reduction in sales in the concession area (R$ 24 million) Parcel A pass-through gains: R&D, Neutrality and CVA - unbilled, CPFL Piratininga losses, new accountings and others (R$ 66 million) Paulista Annual Adjustments (RTA) and 5 Ds Tariff Review (R$ 11 million) PIS and COFINS (R$ 4 million) Renewable generation  -23.3% (-R$ 26 million) Wind farms operation – weaker winds (R$ 13 million) SHPPs seasonality (R$ 10 million) PMSO (R$ 6 million) (+) GSF risk premium (R$ 1 million)  EBITDA | R$ Million PLD (R$/MWh)1 388.48 34.60 1Q15 1Q169.4% LTM IPCA IGP-M 11.6% Conventional generation  +2.9% (+R$ 9 million) EPASA’s better performance (R$ 12 million) Others (R$ 12 million) Expenses with GSF (R$ 10 million) GSF risk premium (R$ 5 million) Commercialization, Services and Holding  +3.5% (+R$ 1 million) 1) Average PLD in SE/CW. 1Q15 Adjusted EBITDA 1Q16 Adjusted EBITDA 1Q15 Non-Rec. 1Q16 Non-Rec. 1Q15 IFRS EBITDA 1Q16 IFRS EBITDA 1Q16 Prop. Consol. 1Q15 Prop. Consol. Distrib. Convent. Generat. Renewable Generat. Commerc. & Serv. 1Q16 Itaipu FX Var. 1Q15 Itaipu FX Var. -5.3% -2.6%
  • 10.
    Manageable expenses |New approach - Productivity 10 P MSO 1,377 1,248 1,346 1,330  Nominal Adjusted PMSO | R$ Million +0.7% 1,430 1,439 P MSO 1,567 1,465 1,808 1,656 -2.2% 1,472 1,439  Real Adjusted PMSO¹ | R$ Million IGPM: 34.3% 2011 to 2014 Creation of decision packages and budget planning according to ZBB methodology  2015/2016 Productivity monitoring Application of Technology to provide higher productivity in the Distribution segment activities, such as:  evolution and comparison through indicators created for productivity measurement  analysis of team’s unavailability  Team’s daily management  dashboards in real time 1) March/16. Variation of IGP-M in the period 1Q16LTM x 2011= 34.3%. PMSO disregarding Private Pension Fund. Excludes non-recurring items, acquisition of fuel oil for EPASA power plants, PMSO of Services and CPFL Renováveis segments, Legal, Judicial and Indemnities and Personnel capitalization costs since January 2014, due to the new methodology established by Aneel. R$ 369 million
  • 11.
    1Q16 Results 11 Reduction of5.3% in EBITDA (R$ 53 million) Reduction of 23.7% in Negative Net Financial Result (R$ 67 million) Adjustment of sectoral financial assets/liabilities (CVA) (R$ 41 million) Variation of discos’ concession financial assets (R$ 33 million) Additions and late payment fines / installments debts (R$ 30 million) Mark-to-market effect – Law 4,131 operations – non-cash (R$ 27 million) PIS/COFINS over financial revenues (R$ 21 million) Net financial revenues (R$ 12 million) Others (R$ 31 million) Reduction of 3.3% in Depreciation and Amortization (R$ 9 million) Reduction in the amortization of concession’s intangible (R$ 20 million) Increase in depreciation and amortization (R$ 11 million) Increase of 3.5% in Income Tax/Social Contribution (R$ 7 million) 12.1% a.a. 14.1% a.a. 1Q15 1Q16 CDI R$/US$² 3.21 3.56  Net Income | R$ Million Lucro Líq. 1T15 Gerencial¹ Deprec./ Amortiz. Lucro Líq. 1T16 Gerencial¹ Não-Rec. 1T16 Lucro Líq. 1T15 IFRS Lucro Líq. 1T16 IFRS IR/CSEBITDA Resultado Financeiro Não-Rec. 1T15 Cons. Prop. 1T16 Cons. Prop. 1T15 +63.3% +6.7% 1) Take into account proportionate consolidation of projects; 2) Exchange rate (R$/US$) – end of the period.
  • 12.
    Annual Tariff Readjustment Parcel A Parcel B Customer Average Effect ParcelB Gain1 Financial Components CFPL Santa Cruz -2.46% 6.43% 7.15% 7 43 CPFL Leste Paulista -2.79% 19.64% 13.32% 2 4 CPFL Sul Paulista -3.72% 18.26% 12.82% 3 11 CPFL Jaguari -1.43% 17.41% 13.25% 1 18 CPFL Mococa -3.53% 11.29% 9.02% 2 4 Consolidated effect 15 80  Increase of Parcel B  Increase in Net RAB  Increase in WACC from 7.50% to 8.09%  Increase in BAR remuneration  Addition of special obligations remuneration  Pass-through of accumulated CVA and other financial components  Pass-through of R$ 951 million in CVA and others financial components  Decrease of Parcel A  Decrease in 2016 CDE Quota  Decrease in Itaipu tariff (in US$)  Addition of energy from quotas 12  Pass through of accumulated CVA and other financial components  Pass-through of R$ 80 million in CVA and others financial components RTA Parcel A Parcel B Customer Average Effect Financial Components CPFL Paulista -2.51% 10.06% 7.55% 951 4th Cycle of Periodic Tariff Review Tariff events: Accumulated CVA and Parcel B adjustments CPFL Paulista ATR R$ 951 million 5 Discos 4CPTR R$ 80 million  CVA Balance | R$ million 1) Reflecting 4th Cycle of Periodic Tariff Review new methodology.
  • 13.
    Indebtedness | FinancialCovenants Management 13 3,736 3,835 3,755 3,971 3,584 3,577 Adjusted EBITDA1,2 R$ Million CPFL Energia received a significant amount related to CVA in 1Q16. Adjusting the cash balance plus the CVA asset (until 1Q16), the Net Debt / EBITDA would reach 3.22x Nominal Real 1) Financial covenants criteria; 2) LTM recurring EBITDA; 3) Adjusted by the proportional consolidation since 2012; 4) Financial debt (+) private pension fund (-) hedge CDI Prefixed (PSI) IGP TJLP  Leverage1 l R$ Billion  Gross Debt Cost3,4 l LTM  Gross Debt Breakdown by Indexer| 1Q161,4 Adjusted Net Debt1 /Adjusted EBITDA2 Adjusted by CVA cash in balance
  • 14.
    Debt Profile |On March 31, 2016 14 Cash Coverage: 2,32x Short term amortization (12M) Average Tenor: 3.43 years Short-term (12M): 11.2% of total 3 1) ) Considers Debt Principal, excluding servicing and including hedge; 2) Financial covenants criteria; 3) Amortization from April-2016 to March-2017  Debt Amortization Schedule1,2 l Mar-16 | R$ Million
  • 15.
    No impact forthe consumer CPFL Exposure Mitigation potential depends on the possible deals with generators The impact of special customers migration to the free market still need be better discussed among agents and ANEEL For CPFL Energia, migration in 2016 already represents approximately 1.8% In the current context, PH 04 and PH 012 mitigate the over contracted position issue for CPFL Energia in 2016 PH04 (March/16) Recognition of involuntary overplus deriving from energy quotas Mitigation ≈ 4% Over contracted position | Measures to mitigate over contracted positions of discos 15   Before HP04 180 MWavg Residual (in function of the macroeconomic scenario and temperature) After HP04 PH012 (April/16) Simplify the process for postponement of new energy contracts Some mitigation potential Actions to mitigate the over contracted position
  • 16.
    Commercial Start-up Installed Capacity Assured Energy PPA1 LocationFinancing May-16 24.0 MW 13.1 average-MW 16th LEN 20132 R$ 155,55/MWh until 2047 Unaí/MG BNDES (approved) SHPP Mata Velha 16 Panoramic view (substation and reservoir) Dam axis 1) Constant currency (mar/16); 2) The power generated will be injected into the system and sold on the free market until the beginning of the energy sales contract in January 2018. CPFL Renováveis anticipated the operation in more than 1 year and a half
  • 17.
    Commercial Start-up 2016-2020(e) 306 MW ofinstalled capacity 166 average-MW of assured energy 1) Gradual commercial operation from 2Q16; 2) Gradual commercial operation from 1H18; 3) Constant Currency (Mar-16). Campo dos Ventos and São Benedito Wind Farms Pedra Cheirosa Wind Farms Boa Vista II SHPP Commercial Start-up 20161 20182 2020 Installed Capacity 231.0 MW 48.3 MW 26.5 MW Assured Energy 125.2 average-MW 26.1 average-MW3 14.8 average-MW PPA3 ACL 20 years 18º LEN 2014 R$ 138.39/MWh until 2037 21º LEN 2015 R$ 219.77/MWh until 2049 Financing BNDES (approved) BNDES (being structured) BNDES (being structured) 17 Generation | Greenfield projects Commercial start-up of 4 wind turbines (8,4 MW) in May-16
  • 18.
     Savings: around3,500 MWh/year (12% of total consumption)  Postponement of the construction of a substation  More attractive prices in free market  Sustainability Benefits - Algar CPFL Eficiência – Algar Tech 18 Participation in gains (estimated solar generation +energy efficiency) in 10 years BOT¹ Agreement - asset remuneration in 6 years Energy commercialization by CPFL Brasil during 10 years  Replacement of 15,023 lamps to tubular LED technology  Air conditioning system: Replacement of the refrigerant fluid  Construction of 2 solar power plants: Campinas (198 kWp) and Uberlândia (increase of 409.2 kWp)  27% saving with energy efficiency due to photovoltaic generation Initial Investment: R$ 6 million Inauguration in March-2016             Project First CPFL’s commercial case in solar distributed generation, through the subsidiary CPFL Eficiência  Benefits - CPFL Energia (1) Build, Operation, Transfer
  • 19.
    Source: Economática; 1)Adjusted by dividends; 2) Up to 03/31/2016  Daily average trading volume on BM&FBovespa + NYSE2 | R$ Million Bovespa NYSE Daily average number of trades on BM&FBovespa  Shares performance on BM&F Bovespa | 1Q161,2  Shares performance on NYSE | 1Q161,2  CPFL Energia is included in the main indexes 19 Stock Market Performance CPL Dow Jones Index Dow Jones Br20CPFE3 IEE IBOV 29.1% 12.3% 15.5% 46.8% 26.8% 1.5% 1T15 1T16 22.8 28.3 13.5 12.2 +52.2% 5,581 8,492 36.3 40.5 Entry in January - 16
  • 20.
     On April2016, CPFL Energia announced the conclusion of the Chief Executive Officer (CEO) Succession Plan  The Succession Plan is part of a planned process, according to the best practices of Corporate Governance  After 18 years, Wilson Ferreira Jr. will step down from the CEO position  Andre Dorf, who joined the CPFL three years ago as the CEO of CPFL Renováveis, will be the new CEO  Both Executives are working together until July, 1st to ensure a smooth and natural transition Chief Executive Officer (CEO) Succession Plan 20 Wilson Ferreira Jr. Andre Dorf
  • 21.
    © CPFL 2015.Todos os direitos reservados.