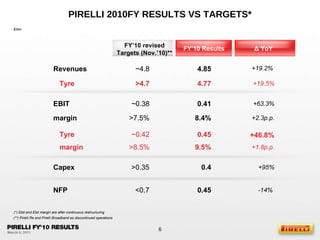
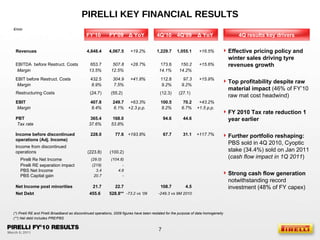
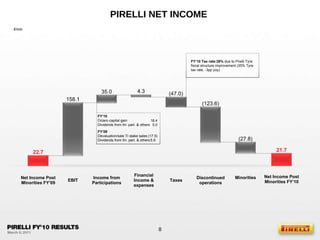
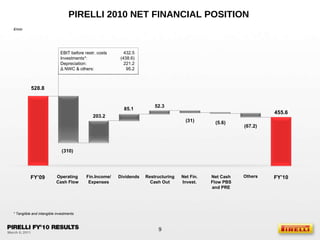
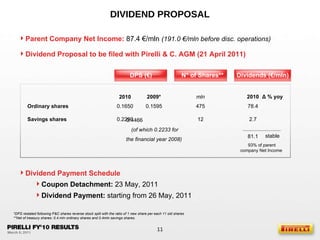
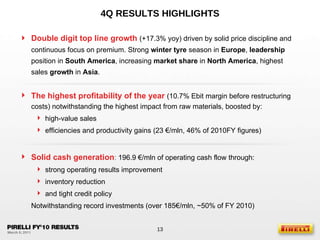
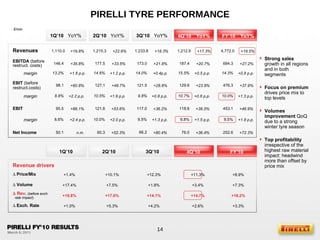
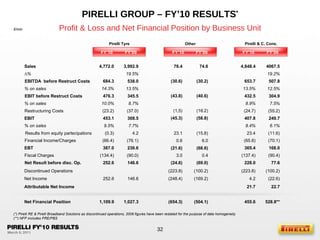
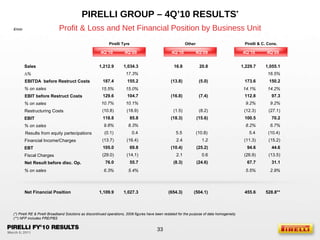
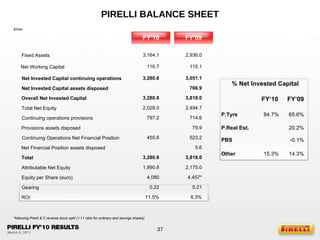
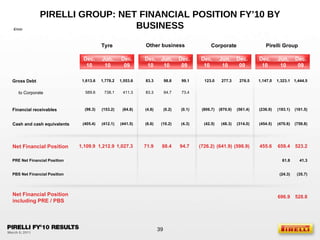
March 8, 2011
DISCLAIMER This presentation contains statements that constitute forward-looking statements based on Pirelli & C SpA’s current expectations and projections about future events and does not constitute an offer or solicitation for the sale. purchase or acquisition of securities of any of the companies mentioned and is directed to professionals of the financial community. These statements appear in a number of places in this presentation and include statements regarding the intent. belief or current expectations of the customer base. estimates regarding future growth in the different business lines and the global business. market share. financial results and other aspects of the activities and situation relating to the Company. Such forward looking statements are not guarantees of future performance and involve risks and uncertainties. and actual results may differ materially from those expressed in or implied by these forward looking statements as a result of various factors, many of which are beyond the ability of Pirelli & C SpA to control or estimate precisely. Consequently it is recommended that they be viewed as indicative only. Analysts are cautioned not to place undue reliance on those forward looking statements. which speak only as of the date of this presentation. Pirelli & C. SpA undertakes no obligation to release publicly the results of any revisions to these forward looking statements which may be made to reflect events and circumstances after the date of this presentation. including. without limitation. changes in Pirelli & C. SpA business or acquisition strategy or to reflect the occurrence of unanticipated events. Statement   The Manager mandated to draft corporate accounting documents of Pirelli & C. SpA. Francesco Tanzi, attests – as per art.154-bis. comma 2 of the Testo Unico della Finanza (D.Lgs. 58/1998) – that all the accounting information contained in this presentation correspond to the documented results. books and accounting of the Company.
AGENDA KEY MESSAGES PIRELLI TYRE 2010 RESULTS APPENDIX PIRELLI & C 2010 FINANCIAL REVIEW 2011 OUTLOOK AND TARGETS UPDATE
KEY INDUSTRY TRENDS: PIRELLI THE TRAILBLAZER Different dynamics vs. automotive Increasing role of Emerging Markets Premium Market development Clear strategy, solid financial structure and high flexibility are our strengths in managing rapid change in market scenario  2010   Top profitability  despite high raw material cost inflation Solid pricing discipline : value is the common industry approach  Timely responsiveness in a fast changing scenario Macro and market dynamics still favorable for EM; inflation concerns are rising Maximum profitability ever High flexibility   (“what if” contingency plan ready) Best performer for price/mix improvement   50% of our sales  in 2010 (+2pp yoy)  Growing at a faster rate (3x vs market)  >60% of consumer sales Premium vehicle manufacturers further expanding their footprint in Asia  Strong track record in managing business in high-inflation countries  Key trends Current Pirelli in 2010 the only premium tyre factory in China
AGENDA KEY MESSAGES PIRELLI TYRE 2010 RESULTS APPENDIX PIRELLI & C 2010 FINANCIAL REVIEW 2011 OUTLOOK AND TARGETS UPDATE
PIRELLI 2010FY RESULTS VS TARGETS* (**) Pirelli Re and Pirelli Broadband as discontinued operations FY’10 Results Δ  YoY FY’10 revised Targets (Nov.’10)** € /bln (*) Ebit and Ebit margin are after continuous restructuring Revenues margin ~4.8 >7.5% 4.85 8.4% NFP 0.45 < 0.7 Capex >0.35 0.4 EBIT   ~0.38 0.41 +19.2%   +2.3p.p. -14%  +95% +63.3% Tyre >4.7 4.77 +19.5%   Tyre margin ~0.42 >8.5% 0.45 9.5% +46.8% +1.8p.p.
PIRELLI KEY FINANCIAL RESULTS Revenues EBITDA  before Restruct. Costs Margin EBIT before Restruct. Costs Margin Restructuring Costs EBIT Margin Income from discontinued operations Net Income post minorities Net Debt Income before discontinued operations (Adj. Income) Pirelli Re Net Income Pirelli RE separation impact PBS Net Income PBS Capital gain € /mln (*) Pirelli RE and Pirelli Broadband as discontinued operations, 2009 figures have been restated for the purpose of data homogeneity PBT Tax rate (**) Net debt includes PRE/PBS 4,848.4 653.7 507.8 13.5% 12.5% (24.7) 407.8 (223.8) 21.7 8.4% 6.1% 249.7 22.7 455.6   (100.2) (55.2)  4,067.5 +19.2% 432.5 304.9 8.9% 7.5% +41.8% +28.7% 528.8** +63.3% +2.3 p.p. 1,229.7 173.6 150.2 14.1% 14.2% (12.3) 100.5 8.2% 6.7% 70.2 (27.1)  1,055.1 +16.5% 112.8 97.3 9.2% 9.2% +15.9% +15.6% +43.2% +1.5 p.p. 228.0 77.6 67.7 31.1 (29.0) (219) - (104.8) Effective pricing policy and winter sales driving tyre revenues growth Top profitability despite raw material impact  (46% of FY’10 raw mat cost headwind) FY 2010 Tax rate reduction 1 year earlier Further portfolio reshaping:  PBS sold in 4Q 2010, Cyoptic stake (34.4%) sold on Jan 2011 ( cash flow impact in 1Q 2011 ) Strong cash flow generation  notwithstanding record investment (48% of FY capex) -73.2 vs ‘09 -249.3 vs 9M 2010 3.4 4.6 20.7 - +193.8% +117.7% 108.7 4.5 365.4 37.6% 53.8% 168.0 94.6 44.6 4Q results key drivers 4Q’10 Δ  YoY 4Q’09 FY’10 Δ  YoY FY’09
PIRELLI NET INCOME  (47.0) 35.0 158.1 21.7 22.7 (123.6) 4.3 FY’10 Tax rate:38%  due to Pirelli Tyre fiscal structure improvement (35% Tyre tax rate, -3pp yoy)  18.4 5.0 FY’10 Oclaro capital gain Dividends from fin. part. & others  (17.5) 5.9  FY’09 Devaluation/sale TI stake sales Dividends from fin. part. & others (27.8) € /mln EBIT Net Income Post Minorities FY’09 Income from Participations Net Income Post Minorities FY’10 Discontinued operations Taxes Financial Income & expenses Minorities
PIRELLI 2010 NET FINANCIAL POSITION  528.8 85.1 (310) 52.3 455.6 (5.6) (67.2) Restructuring Cash Out € /mln 432.5 (438.6) 221.2 95.2 EBIT before restr. costs Investments*: Depreciation: Δ  NWC & others: (31) 203.2 * Tangilble and intangible investments FY’09 Fin.Income/ Expenses Operating Cash Flow Dividends FY’10 Net Cash Flow PBS and PRE Net Fin. Invest. Others
DEBT: EXTEND MATURITY AND DIVERSIFY SOURCES Gross Debt Maturity post refinancing FUNDING STRATEGY DEVELOPMENT 1 st  step  November 30, 2010:  new 5-year 1.2 € bln committed revolving facilities   replacing the 2 existing ones for 1.475 €/mln maturing in 2011 and 2012 2 nd  step  February 10, 2011: successful placement of  500 € mln 5-year bond   issue on the Eurobond market (>9 times oversubscribed, over 93% placed with investors outside Italy) 2011 Cost of Debt: ~5.3% (~+1pp vs. 2010FY) consistent  with  2011-2013 Industrial plan targets 12.8% 8.0% 22.0% 43.8% Gross Debt as of 2010 Y.E. 4.3% 9.1% 1,200 FY’10 2011 2012 2013 2014 2015 2016 & beyond 1 st  step 49 252 380 767 1,147 146.7 123.3 92 104 380 380 2 nd  step € /mln Committed Line Drawdown Other Borrowings Total Committed Lines Not Drawn  Total 1,220 - 20 - - New revolving facility New 5 year bond
DIVIDEND PROPOSAL *DPS restated following  P&C shares reverse stock split with the ratio of 1 new share per each 11 old shares **Net of treasury shares: 0.4 mln ordinary shares and 0.4mln savings shares. Ordinary shares Savings shares 0.1650 12 2.7 78.4 475 mln 2010 93% of parent company Net Income  81.1 Δ  % yoy 2010 2009* 0.2290 0.1595 0.4466  (of which 0.2233  for the financial year 2008 ) stable DPS (€) N° of Shares** Dividends (€/mln) Parent Company Net Income:  87.4 €/mln  (191.0 €/mln before disc. operations) Dividend Proposal to be filed with Pirelli & C. AGM (21 April 2011) Dividend Payment Schedule Coupon Detachment:  23 May, 2011 Dividend Payment:  starting from 26 May, 2011
AGENDA KEY MESSAGES PIRELLI TYRE 2010 RESULTS APPENDIX PIRELLI & C 2010 FINANCIAL REVIEW 2011 OUTLOOK AND TARGETS UPDATE
4Q RESULTS HIGHLIGHTS Double digit top line growth  (+17.3% yoy) driven by solid price discipline and continuous focus on premium. Strong  winter tyre  season in  Europe ,  leadership  position in  South America , increasing  market share  in  North America , highest sales  growth  in  Asia . The highest profitability of the year  (10.7% Ebit margin before restructuring costs) notwithstanding the highest impact from raw materials, boosted by: high-value sales efficiencies and productivity gains (23 €/mln, 46% of 2010FY figures) Solid cash generation :  196.9 €/mln of operating cash flow through: strong operating results improvement inventory reduction and tight credit policy Notwithstanding record investments (over 185€/mln, ~50% of FY 2010)
PIRELLI TYRE PERFORMANCE Revenues margin EBITDA  (before restruct. costs) EBIT  (before restruct.costs) margin EBIT Net Income margin 1,110.0 146.4 13.2% 98.1 8.8% +35.8% +60.8% 95.5 +66.1% 50.1 8.6% +1.6 p.p. +2.2 p.p. +2.4 p.p. +19.8% 1,215.3 177.5 14.6% 127.1 10.5% +22.9% +33.5% +48.7% 121.8 +53.6% 60.3 10.0% +1.2 p.p. +1.9 p.p. +2.0 p.p. 1,233.8 173.0 14.0% 121.5 9.8% +18.3% +21.8% +28.8% 117.0 +36.2% 66.2 9.5% +0.4p.p. +0.8 p.p. +1.3 p.p. n.m. +52.3% +80.4% 1,212.9 187.4 15.5% 129.6 10.7% +17.3% +20.7% +23.8% 118.8 +38.5% 76.0 9.8% +0.5 p.p. +0.6 p.p. +1.5 p.p. +36.4% 4,772.0 684.3 14.3% 476.3 10.0% +19.5% +27.2% +37.9% 453.1 +46.9% 252.6 9.5% +0.8 p.p. +1.3 p.p. +1.8 p.p. +72.3% 1Q’10 YoY% 1Q’10 Revenue drivers  2Q’10 YoY% 3Q’10 YoY% 4Q’10 YoY% FY’10 YoY% 2Q’10 3Q’10 4Q’10 FY’10    Volume +17.4% +7.5% +3.4% +7.3% +1.8%    Price /Mix +1.4% +10.1% +11.3% +8.9% +12.3%    Exch. Rate +1.0% +5.3% +2.6% +3.3% +4.2%    Rev .  ( before exch.  rate impact ) +18.8% +17.6% +14.7% +16.2% +14.1% Strong sales  growth in all regions and in both segments Focus on premium  drives price mix to top levels Volumes   improvement  QoQ due to a strong winter tyre season Top profitability  irrespective of the highest raw material impact: headwind more than offset by price mix € /mln
PIRELLI TYRE BY REGION FY’09 FY’10 42% 6% Europe Premium and Prestige OEMs sales Increase Rising market share in winter tyres NAFTA Enhanced market share in North America through premium strategy and higher penetration LatAm Regional leadership confirmed with 2.2$ bln sales and a double digit profitability MEA & Asia-Pacific Double-digit growth in the Replacement segment Start delivering Premium OEMs in China  40% 10% 100% 100% 33% 34% Sales by region FY’10 Actions and Results 6% 10% 10% 9% Europe NAFTA MEA Asia Pacific Yoy growth Mature Markets Emerging Markets +16% +23% Latin America % on sales
PIRELLI TYRE FY’10 OPERATING PERFORMANCE (37.6) 50.1 101 331.9 3.2 476.3 345.5 (317.8) 104.7 (15.4) 22.8 19.8 131.9 3.5 129.6 (137.7) Labour / energy / other:  (47.5) Raw materials:   (270.3) 4Q 2010 FY2010 Labour / energy / other:  (12.6) Raw materials:  (125.1) € /mln EBIT FY’10   (before restr.costs) Depreciation/ other costs Exchange rate Efficiencies Cost of inputs Volume Price  mix EBIT FY’09 (before restr.  costs) EBIT 4Q’10   (before restr.costs) Depreciation/ other costs Exchange rate Efficiencies Cost of inputs Volume Price  mix EBIT 4Q’09 (before restr.  costs)
PIRELLI TYRE NFP EVOLUTION Solid FCF generation in 4Q due to strong operating performance Capex/Dep ratio at 1.9 with capacity increase in Premium segment  FY net cash flow: 144 €/mln before dividends EBIT (before restr. costs):  346.7 Investments*:   (220.2) Depreciation:    150.2 Δ NWC & others:  (105.1)  FY’09 Operating  Cash Flow (171.6) Financial  charges /  Taxes 158.1 Other (2.3) Restructuring Cash-out 37.5 FY’10 1,109.9 Dividends Operating  Cash Flow (196.9) Financial  charges /  Taxes 42.7 Restructuring Cash-out 2.0 EBIT (before restr. costs):   129.6 Investments *:    (184.8) Depreciation:    57.8 Δ NWC & others:   194.3  (13.5) Other 9M’10 1,027.3 1,205.0 156.0 Δ  NFP: -95.1 Δ  NFP: 177.7 Dividends 70.6 € /mln * Tangilble and intangible investments
CONSUMER BUSINESS: KEY MARKET TRENDS 4Q‘09 +12% +12% +2% +44% +21% +8% 1Q’10 +37% +10% +73% +8% +25% +26% 2Q’10 +11% +11% +74% +8% +12% +14% 3Q’10 -2% +6% +26% +0% +11% +10% 4Q’10 +5% +7% +6% +1% +6% +4% FY’10 +13% +8% +39% +4% +13% +11% Car tyre shipments, % (yoy) Sources: major external data provider for each region and Pirelli estimates * Turkey and Russia included North America Mercosur Europe* OE Replacement OE Replacement OE Replacement
780.9 106.0 13.6% 69.5 8.9% +37.0% +65.9% +2.1 p.p. +2.7p.p. +16.5% 835.8 122.4 14.6% 84.7 10.1% +35.4% +55.4% +1.7 p.p. +2.3p.p. +19.1% +1.2% +14.9% +0.4% +16.1% +8.7% +6.2% +4.2% +14.9% CONSUMER BUSINESS: PIRELLI PERFORMANCE Revenues margin EBITDA  (before restruct. costs) EBIT  (before restruct.costs) margin    Price /Mix    Exch. Rate    Volume    Rev.  ( before exch.  rate impact ) Revenue drivers  1Q’10 YoY% 2Q’10 YoY% 3Q’10 YoY% 4Q’10 YoY% FY’10 YoY% 1Q’10 2Q’10 3Q’10 4Q’10 FY’10 847.1 118.9 14.0% 80.5 9.5% +18.5% +25.6% +0.4 p.p. +0.8p.p. +15.1% 836.5 141.1 16.9% 99.9 11.9% +26.4% +36.5% +1.7p.p. +16.2% +1.4 p.p. 3,300.3 488.4 14.8% 334.6 10.1% +28.6% +43.2% +1.8p.p. +16.7% +1.4 p.p. +10.7% +0.8% +3.6% +11.5% +9.3% +4.2% +2.7% +13.5% +7.6% +6.4% +2.7% +14.0% High double-digit sales growth through strong price/mix performance in every market FY and 4Q Ebit margin at historical record level 67.0 8.6% +67.9% +2.6p.p. 80.3 9.6% +57.5% +2.3p.p. EBIT  margin 77.2 9.1% +30.4% +1.1p.p. 92.5 11.1% +54.9% +2.8p.p. 317.0 9.6% +51.1% +2.2p.p. € /mln
NEW CONSUMER PRODUCTS Performance Winter Cinturato P1 Snowcontrol Serie III Diablo Rosso II Winter ICEControl Summer Green
INDUSTRIAL BUSINESS: KEY MARKET TRENDS  Car tyre shipments, Sources: major external data provider for each region and Pirelli estimates 2Q‘09 1Q‘10 * Turkey and Russia included +1% +38% +65% +26% +67% +19% +61% +19% -50% +12% +3% +23% 4Q‘09 3Q’10 +90% +9% +22% +22% 4Q’10 +84% +15% +49% +23% Europe* +57% +18% +47% +23% FY’10 Mercosur OE Replacement OE Replacement
329.1 40.4 12.3% 28.6 8.7% +32.9% +49.7% +0.4 p.p. +1.2p.p. +28.4% 379.5 55.1 14.5% 42.4 11.2% +29.3% +36.8% -0.3 p.p. +0.4p.p. +32.0% Revenues margin EBITDA  (before restruct. costs) EBIT  (before restruct.costs) margin +1.8% +24.1% +2.5% +25.9% +13.7% +10.4% +7.9% +24.1%    Price /Mix    Exch. Rate    Volume    Rev.  ( before exch.  rate impact ) Revenue drivers  INDUSTRIAL BUSINESS: PIRELLI PERFORMANCE 1Q’10 YoY% 2Q’10 YoY% 3Q’10 YoY% 4Q’10 YoY% FY’10 YoY% 1Q’10 2Q’10 3Q’10 4Q’10 FY’10 +15.7% +1.6% +2.4% +17.3% +12.3% +9.4% +4.6% +21.7% 1,471.7 195.9 13.3% 141.7 9.6% +23.8% +26.7% -0.3p.p. +0.0 p.p. +26.3% 376.4 46.3 12.3% 29.7 7.9% +6.2% -5.7% -1.6p.p. -2.1p.p. +19.7% 386.7 54.1 14.0% 41.0 10.6% +16.2% +4.2% +5.7% +20.4% +0.4 p.p. +29.7% +35.8% +0.8 p.p. +26.1% Two-digit price/mix variation ensuring positive pull-through on 1Q 2011 4Q Ebit margin impacted by Natural Rubber rising costs 28.5 8.7% +61.9% +1.8p.p. 41.5 10.9% +46.6% +1.1p.p. EBIT  margin 39.8 10.3% +49.1% +1.6p.p. 26.3 7.0% +0.7% +1.3p.p. 136.1 9.2% +37.9% +0.7p.p. € /mln
PIRELLI GREEN TECHNOLOGY Green Performance DLTC: Dual Layer  Tread Compound Hexa: Hexagonal Bead  Wire Package High Penetration Steel Cords Green Materials and Structures SATT: Spiral Advanced  Technology for Truck Technology Packages First Life Regr1 Retread1 Regr2 Retread2 CUSTOMER LIFECYCLE VALUE low rolling resistance = fuel saving >4% lower CO 2  emissions Enhanced tyre lifecycle:  improved mileage  and   environmental impact   Retreadability & Mileage towards 1,000,000 Km Fuel Savings 01 series reference GREEN AREA PERFORMANCE AREA
AGENDA KEY MESSAGES PIRELLI TYRE 2010 RESULTS APPENDIX PIRELLI & C 2010 FINANCIAL REVIEW 2011 OUTLOOK AND TARGETS UPDATE
2011 MARKET OUTLOOK Volumes: a more positive outlook based on  Low inventory levels  Order books for both summer and winter tyres Higher market forecast for truck tyres Price discipline: confirmed and effective Consumer: strong demand makes market receptive on prices increase Industrial: price increases are easier in rising Rapid Developing Economies  Raw Materials Speculation, strong demand and geopolitical crisis are driving raw mat rally Industry reaction: price discipline  in the short term  and diversification/reduction of natural rubber dependance  in the mid/long term
Global Tyre Truck Market Global Tyre Car Market OE:   +5% Emea +1% Nafta  +7% LatAM  +5% Asia Pacific  +6% 5% Non Premium Tyres T, H, V, VAN,  SUV & Winter <H Premium Tyres (*) :  WYZ, RF, SUV &  Winter ≥ H 75% 75% 25% 25% 166 179 +8% +8% +8% Replacement :  +5% Emea +3% Nafta  +3% LatAM  +5% Asia Pacific  +9% OE :   +7% Emea +30% Nafta  +20% LatAM  +5% Asia Pacific  flat Replacement :  +8% Emea +6% Nafta  +6% LatAM  +9% Asia Pacific  +9% 4% Mln pcs Mln pcs 2011 OUTLOOK: VOLUMES Emerging Mature Update March ‘11 Ind. Plan (nov. ’10) 1.230 11% 2010 1.290 2011 12% +14% +4% +5% 2010 2011 Update March ‘11 Ind. Plan (nov. ’10) (*) revised criteria vs 2011-2013 Industrial Plan without “V” rated car tyres
2011 OUTLOOK: CAPEX PLAN Settimo Torinese high tech plant operational from 4Q, 2010 +23% capacity increase in Premium tyres in China and Romania  New plant in Mexico, first tyre in 2012 RDE, Rapid Development Economy 2010 2011 40% 60% 21% 79% 78% 22% 73% 27% 100% 100% 0.4 >0.5 Capex  (€/ b ln) Year End Capacity  (mln pcs) CONSUMER INDUSTRIAL 36% 42% 4% 18% yoy yoy 18% 55% 3% 24% TOTAL INVESTMENT ALLOCATION Mature LATAM & RDE* Mature LATAM & RDE* >0.1 0.3 0.1 2010 2011 2010 2011 56 5.8 62 6.3 +10% +11% +14% +9% INVESTMENTS 0.4
2011 OUTLOOK: RAW MATERIAL  195 263 270 332 Raw material impact on Ebit Price/Mix impact on Ebit 125 132 99 95 80% already covered by price increases currently being applied in all markets 20% to be covered with additional price increase Cost headwind will be  fully compensated   by  price/mix   improvement 2008 2010 2009 4Q 2010 Raw material impact on Ebit:  580 €/mln  assuming  Natural rubber  @  4,900$/ton   (yearly average as a cost of goods sold) Oil  @   110$/barrel   (yearly average as a cost of goods sold) Pirelli pricing power to offset raw mat impact: a  significant track record   in the industry
46% 16% 13% 80 € mln 2011 EFFICIENCY PLAN CONFIRMED  25% Scale Productivity Target Cost Management Total savings 2011 vs 2010 Allocation to low cost plants
PIRELLI 2011 TARGETS* UPDATE Revenues EBIT % >5.15 >5.55 NFP ~0.7 Capex 1.2 in 3 y >0.5 Tyre >5.1 Volumes Price/mix +4% +4% Tyre 8.5% ÷ 9.5% 9% ÷ 10% >5.5 confirmed confirmed ≥ +6% ~+12% Tax rate 39%/38% (-1pp/-2pp vs. 2010E tax rate) ≤ 38% 2011 Target  Update 2011 Target  (Nov. 4 2010) *Ebit and Ebit margin are after continuous restructuring € /bln
AGENDA KEY MESSAGES PIRELLI TYRE 2010 RESULTS APPENDIX PIRELLI & C 2010 FINANCIAL REVIEW 2011 OUTLOOK AND TARGETS UPDATE
Profit & Loss and Net Financial Position by Business Unit PIRELLI GROUP – FY’10 RESULTS * Pirelli Tyre Other Pirelli  & C.  Cons. FY’10 FY’09 (**) NFP includes PRE/PBS € /mln FY’10 FY’09 FY’10 FY’09 (*) Pirelli RE & Pirelli Broadband Solutions as discontinued operations, 2009 figures have been restated for the purpose of data homogeneity Sales 4,772.0 3,992.9 76.4 74.6 4,848.4 4067.5 ∆ %  19.5% 19.2% EBITDA  before Restruct Costs 684.3 538.0 (30.6) (30.2) 653.7 507.8 % on sales 14.3% 13.5% 13.5% 12.5% EBIT before Restruct Costs 476.3 345.5 (43.8) (40.6) 432.5 304.9 % on sales 10.0% 8.7% 8.9% 7.5% Restructuring Costs (23.2) (37.0) (1,5) (18.2) (24.7) (55.2) EBIT 453.1 308.5 (45.3) (58.8) 407.8 249.7 % on sales 9.5% 7.7% 8.4% 6.1% Results from equity partecipations (0.3) 4.2 23.1 (15.8) 23.4 (11.6) Financial Income/Charges (66.4) (76.1) 0.6 6.0 (65.8) (70.1) EBT 387.0 236.6 (21.6) (68.6) 365.4 168.0 Fiscal Charges (134.4) (90.0) 3.0 0.4 (137.4) (90.4) Net Result before disc. Op. 252.6 146.6 (24.6) (69.0) 228.0 77.6 Net Financial Position 1,109.9 1,027.3 (654.3) (504.1) 455.6 528.8** Discontinued Operations  (223.8) (100.2) (223.8) (100.2) Net Income 252.6 146.6 (248.4) (169.2) 4.2 (22.6) Attributable Net Income 21.7 22.7
PIRELLI GROUP – 4Q’10 RESULTS * Profit & Loss and Net Financial Position by Business Unit (*) Pirelli RE & Pirelli Broadband Solutions as discontinued operations, 2009 figures have been restated for the purpose of data homogeneity (**) NFP includes PRE/PBS € /mln 4Q’10 4Q’09 4Q’10 4Q’09 4Q’10 4Q’09 Pirelli Tyre Other Pirelli  & C.  Cons. % on sales 6.3% 5.4% 5.5% 2.9% 1,212.9 1,034.3 16.8 20.8 1,229.7 1,055.1 17.3% 16.5% 187.4 155.2 (13.8) (5.0) 173.6 150.2 15.5% 15.0% 14.1% 14.2% 129.6 104.7 (16.8) (7.4) 112.8 97.3 (10.8) (18.9) (1.5) (8.2) (12.3) (27.1) 118.8 85.8 (18.3) (15.6) 100.5 70.2 (13.7) (16.4) 2.4 1.2 (11.3) (15.2) (29.0) (14.1) 2.1 0.6 (26.9) (13.5) 76.0 55.7 (8.3) (24.6) 67.7 31.1 1,109.9 1,027.3 (654.3) (504.1) 455.6 528.8** Net Financial Position (0.1) 0.4 5.5 (10.8) 5.4 (10.4) 10.7% 10.1% 9.2% 9.2% 9.8% 8.3% 8.2% 6.7% 105.0 69.8 (10.4) (25.2) 94.6 44.6 Sales ∆ %  EBITDA  before Restruct Costs % on sales EBIT before Restruct Costs % on sales Restructuring Costs EBIT % on sales Results from equity partecipations Financial Income/Charges EBT Fiscal Charges Net Result before disc. Op.
Pirelli Tyre Other Pirelli  & C.  Cons. PIRELLI GROUP – 3Q’10 RESULTS * Profit & Loss and Net Financial Position by Business Unit (**) NFP includes PRE/PBS € /mln 3Q’10 3Q’09 3Q’10 3Q’09 3Q’10 3Q’09 (*) Pirelli RE & Pirelli Broadband Solutions as discontinued operations, 2009 and 2010 figures have been restated for the purpose of data homogeneity 5.4% 3.5% 6.7% 1.9% 1,233.8 1,042.7 15.9 15.8 1,249.7 1,058.5 18.3% 18.1% 14.0% 13.6% 14.0% 12.5% 121.5 94.3 (1.6) (12.5) 119.9 81.8 (4.5) (8.4) 0.0 (10.0) (4.5) (18.4) 117.0 85.9 (1.6) (22.5) 115.4 63.4 (14.0) (16.7) 0.0 0.9 (14.0) (15.8) (36.8) (32.5) (3.3) (0.6) (40.1) (33.1) 66.2 36.7 17.1 (16.4) 83.3 20.3 1,205.0 1,298.6 (575.5) (545.8) 704.9 691.4** Net Financial Position 0.0 0.0 22.0 5.8 22.0 5.8 9.8% 9.0% 9.6% 7.7% 9.5% 8.2% 9.2% 6.0% 103.0 69.2 20.4 (15.8) 123.4 53.4 173.0 142.0 1.9 (9.9) 174.9 132.1 Sales ∆ %  EBITDA  before Restruct Costs % on sales EBIT before Restruct Costs % on sales Restructuring Costs EBIT % on sales Results from equity partecipations Financial Income/Charges EBT Fiscal Charges Net Result before disc. Op. % on sales
Pirelli Tyre Other Pirelli  & C.  Cons. PIRELLI GROUP – 2Q’10 RESULTS * Profit & Loss and Net Financial Position by Business Unit (**) NFP includes PRE/PBS € /mln 2Q’10 2Q’09 2Q’10 2Q’09 2Q’10 2Q’09 (*) Pirelli RE & Pirelli Broadband Solutions as discontinued operations, 2009 and 2010 figures have been restated for the purpose of data homogeneity 5.0% 4.0% 3.3% 1.1% 1,215.3 989.0 19.3 17.4 1,234.6 1,006.4 22.9% 10.9% 22.7% 14.6% 13.4% 13.2% 12.5% 127.1 85.5 (17.5) (9.7) 109.6 75.8 (5.3) (6.2) 0.0 0.0 (5.3) (6.2) 121.8 79.3 (17.5) (9.7) 104.3 69.6 (22.3) (19.9) (0.6) 1.6 (22.9) (18.3) (39.4) (20.1) (0.6) 0.4 (40.0) (19.7) 60.3 39.6 (20.0) (28.3) 40.3 11.3 1,212.9 1,467.0 (553.5) (664.9) 696.9 1,107.6** Net Financial Position 0.2 0.3 (1.3) (20.6) (1.1) (20.3) 10.5% 8.6% 8.9% 7.5% 10.0% 8.0% 8.4% 6.9% 99.7 59.7 (19.4) (28.7) 80.3 31.0 177.5 133.0 (14.2) (7.0) 163.3 126.0 Sales ∆ %  EBITDA  before Restruct Costs % on sales EBIT before Restruct Costs % on sales Restructuring Costs EBIT % on sales Results from equity partecipations Financial Income/Charges EBT Fiscal Charges Net Result before disc. Op. % on sales
PIRELLI GROUP – 1Q’10 RESULTS * Profit & Loss and Net Financial Position by Business Unit (**) NFP includes PRE/PBS € /mln (*) Pirelli RE & Pirelli Broadband Solutions as discontinued operations, 2009 and 2010 figures have been restated for the purpose of data homogeneity Pirelli Tyre Other Pirelli  & C.  Cons. 1Q’10 1Q’09 1Q’10 1Q’09 1Q’10 1Q’09 4.5% 1.6% 3.2% 1.6% 1,110.0 926.9 24.4 20.6 1,134.4 947.5 19.8% 19.7% 13.2% 11.6% 12.5% 10.5% 98.1 61.0 (7.9) (11.0) 90.2 50.0 (2.6) (3.5) 0.0 0.0 (2.6) (3.5) 95.5 57.5 (7.9) (11.0) 87.6 46.5 (16.4) (23.1) (1.2) 2.3 (17.6) (20.8) (29.2) (23.3) (1.2) (0.8) (30.4) (24.1) 50.1 14.6 (13.4) 0.3 36.7 14.9 1,122.5 1,521.8 (475.8) (519.9) 678.4 1,278.9** 0.2 3.5 (3.1) 9.8 (2.9) 13.3 8.8% 6.6% 8.0% 5.3% 8.6% 6.2% 7.7% 4.9% 79.3 37.9 (12.2) 1.1 67.1 39.0 146.4 107.8 (4.5) (8.3) 141.9 99.5 Sales ∆ %  EBITDA  before Restruct Costs % on sales EBIT before Restruct Costs % on sales Restructuring Costs EBIT % on sales Results from equity partecipations Financial Income/Charges EBT Fiscal Charges Net Result before disc. Op. % on sales Net Financial Position
PIRELLI BALANCE SHEET € /mln % Net Invested Capital FY‘10 FY‘09 84.7% 65.6% P.Tyre 20.2% P.Real Est. -0.1% PBS 15.3% 14.3% Other *following Pirelli & C reverse stock split (1:11 ratio for ordinary and savings shares) Net Working Capital  FY’10 FY’09 Fixed Assets 3,164.1 2,936.0 Net Invested Capital continuing operations 3,280.8 3,051.1 Overall Net Invested Capital  3,280.8 3,818.0 Total Net Equity 2,028.0 2,494.7 Continuing operations provisions 797.2 714.6 Continuing Operations Net Financial Position  455.6 523.2 Total 3,280.8 3,818.0 Attributable Net Equity  1,990.8 2,175.0 Equity per Share (euro) 4,080 4.457* Net Invested Capital assets disposed  766.9 Provisions assets disposed 79.9 Net Financial Position assets disposed 5.6 Gearing 0.22 0.21 ROI 11.5% 6.3% 116.7 115.1
PIRELLI GROUP CASH FLOW € /mln 1Q’10 2Q’10 3Q’10 4Q’10 FY’10 EBIT before restructuring costs 109.6 90.2 112.8 119.9 432.5 Depreciation 53.7 51.7 60.8 55.0 221.1 Net investments (85.2) (49.9) (212.0) (91.5) (438.6) Working capital/other variations  42.2 (143.5) 214.5 (18.0) 95.2 OPERATING CASH FLOW 120.3 (51.5) 176.1 65.4 310.3 Financial income (expenses) (22.9) (17.6) (11.3) (14.0) (65.8) Tax charges (40.0) (30.4) (26.9) (40.1) (137.4) NET OPERATING CASH FLOW 57.4 (99.5) 137.9 11.3 107.1 Financial investments/disinvestitures - - 21.9 9.8 31.7 Cash-out for restructuring  (9.9) (34.0) (2.0) (7.4) (53.3) Exchange rate differentials/Others 24.9 10.0 16.1 16.2 67.2 PRE Net Cash Flow (6.5) (14.0) 88.3 (26.5) 41.3 PBS Net Cash Flow  0.7 (12.1) (12.9) (11.4) (35.7) Dividends paid (85.1) - - (85.1) - NET CASH FLOW (18.5) (149.6) 249.3 (8.0) 73.2
PIRELLI GROUP: NET FINANCIAL POSITION FY’10 BY BUSINESS Tyre Other business Pirelli Group Corporate Net Financial Position including PRE / PBS Jun. 10 Dec. 09 696.9 528.8 Dec. 10 Jun. 10 Dec. 09 Dec. 10 Jun. 10 Dec. 09 Dec. 10 Jun. 10 Dec. 09 Dec. 10 € /mln Net Financial Position 1,212.9 88.4 (641.9) 659.4 1,027.3 94.7 (598.9) 523.2 1,109.9 71.9 (726.2) 455.6 PRE Net Financial Position 61.8 41.3 Gross Debt 1,778.2 98.8 277.3 1,323.1 1,553.6 99.1 276.5 1,444.5 1,613.6 83.3 123.0 1,147.0 to Corporate 738.1 64.7 411.3 73.4 589.6 83.3 Financial receivables (153.2) (0.2) (870.9) (193.1) (84.8) (0.1) (561.4) (161.5) (98.3) (4.8) (806.7) (236.9) Cash and cash equivalents (412.1) (10.2) (48.3) (470.6) (441.5) (4.3) (314.0) (759.8) (405.4) (6.6) (42.5) (454.5) PBS Net Financial Position (24.3) (35.7)
FY’10 PIRELLI TYRE MIX Car 62% Motorbike 8% Steelcord & others  2% Truck  28% SALES BY SEGMENT Consumer  70% SALES BY BUSINESS Industrial 30% SALES BY REGION Replacement  75% OE 25% SALES BY CHANNEL Latin  America  34% MEA  10% Asia Pacific  6% Europe 40% Nafta  10%
FY ‘10 PIRELLI TYRE PEOPLE Workers 81% Management 1% Employees 18% Europe 37% Nafta 1% Latin  America (w/o Mexico) 43% Asia Pacific 9% Permanents 92% Temps &  Agency 8% MEA  10% PEOPLE BY REGION PEOPLE BY CLUSTER PEOPLE BY CONTRACT 2009 2010 28,865 27,481 HEADCOUNT
PIRELLI TYRE: 19 INDUSTRIAL PLANTS  IN 11 COUNTRIES (AS OF DEC. 2010) Izmit Car/Truck Steelcord Slatina Car/Steelcord Yanzhou Car/Truck Alexandria Truck Merlo Car Guacara Car Rome Car Burton Carlisle Car Car Campinas Feira de Santana Santo André Gravatai Sumaré Car Car/Truck Truck/Agro Moto/Truck Steelcord Bollate (MI) Settimo Torinese Figline Valdamo Car Car/Truck Steelcord Breuberg Merzig Car/Moto Steelcord Turkey Romania China Egypt Argentina Venezuela U.S.A U.K. Brazil Italy Germany
RAW MATERIALS FY 2010 MIX (BASED ON PURCHASING COST) Raw mat costs on sales: 39%  Natural Rubber: Sicom Brent: www.oilnergy.com In Italic Year Average RAW MATERIALS PRICE TREND Synth. Rubber 24% Natural Rubber 3 33% Textiles 10% Steelcord 8% Chemicals 14% Carbon black 11% (+1pp yoy) (+9pp yoy) (-3pp yoy) (-2pp yoy) (-2pp yoy) (-3pp yoy) 96 123 117 57 45 60 69 76 77 80 77 87 2,653 2,943 2,973 1,553 1,330 1,523 1,837 2,513 3,096 3,022 3,148 4,254 80 63 99 3,380 1,801 2,531 Natural Rubber (in usd/tons) Brent Oil (in usd/bbl) 1Q/08 = 100
Prestige Premium Synergic Segment Share  Solid   foothold in  Europe , in prestige/premium segments Historical   leadership   in  Latin America  Growth   opportunities in  Asia-Pacific   markets with new China source Only high-end, high added value products  in high cost countries Production  Footprint moving forward Leading   brand in Prestige niche Development partner of  all EU premium   car makers Leading   supplier to the Automotive Industry in  Latin America  Leader   in the  Motorcycle   business with Pirelli and Metzeler Brands PIRELLI TYRE SELECTIVE POSITIONING IN THE CONSUMER SEGMENT Source: LMC, Pirelli estimates, June 2010 Investor Presentation Pirelli in 2008 Pirelli in 2010 Market in 2010 Pirelli in 2010 % of production % of sales 100% 100% 27% 100% 27% 30% 29% 39% 54% 6% 61% 6% 71% 37% 100% 13% Sales Breakdown By Area Pirelli Focus Production By Area High Cost Low Cost Emea NAFTA Latin America Asia Pacific
11% INDUSTRIAL SEGMENT: A UNIQUE COMPETITIVE POSITION Pirelli in 2008 Pirelli in 2010 100% 100% Market in 2010 Pirelli in 2010 % of sales 15% 100% 100% 50% 50% Sales focus in  high-growth areas Not  present in North America Product cost leadership  supported by a low-cost production base Leading position  in Pirelli key markets Proprietary steelcord  technology Latin America Southern EU  and Near-East Northern Africa China 7% 13% 40% 24% 93% 87% Premium Source: LMC, Pirelli estimates Sales Breakdown By Area Pirelli Focus Production By Area 10% % of production Emea NAFTA Latin America Asia Pacific High Cost Low Cost
NEW PROJECTS ITALY - SETTIMO TORINESE Product: Car Tyres First tyre: 4Q 2010 CHINA – YANZHOU “2” Product: car and motorbike tyres First tyre: 2Q 2011
ROMANIA – SLATINA “2”  Product: Car Tyres First tyre: 4Q 2010 MEXICO -  GUANAJUATO Product: Car Tyres First tyre: 2Q 2012 NEW PROJECTS

PIRELLI FY'10 RESULTS

  • 1.
  • 2.
    DISCLAIMER This presentationcontains statements that constitute forward-looking statements based on Pirelli & C SpA’s current expectations and projections about future events and does not constitute an offer or solicitation for the sale. purchase or acquisition of securities of any of the companies mentioned and is directed to professionals of the financial community. These statements appear in a number of places in this presentation and include statements regarding the intent. belief or current expectations of the customer base. estimates regarding future growth in the different business lines and the global business. market share. financial results and other aspects of the activities and situation relating to the Company. Such forward looking statements are not guarantees of future performance and involve risks and uncertainties. and actual results may differ materially from those expressed in or implied by these forward looking statements as a result of various factors, many of which are beyond the ability of Pirelli & C SpA to control or estimate precisely. Consequently it is recommended that they be viewed as indicative only. Analysts are cautioned not to place undue reliance on those forward looking statements. which speak only as of the date of this presentation. Pirelli & C. SpA undertakes no obligation to release publicly the results of any revisions to these forward looking statements which may be made to reflect events and circumstances after the date of this presentation. including. without limitation. changes in Pirelli & C. SpA business or acquisition strategy or to reflect the occurrence of unanticipated events. Statement The Manager mandated to draft corporate accounting documents of Pirelli & C. SpA. Francesco Tanzi, attests – as per art.154-bis. comma 2 of the Testo Unico della Finanza (D.Lgs. 58/1998) – that all the accounting information contained in this presentation correspond to the documented results. books and accounting of the Company.
  • 3.
    AGENDA KEY MESSAGESPIRELLI TYRE 2010 RESULTS APPENDIX PIRELLI & C 2010 FINANCIAL REVIEW 2011 OUTLOOK AND TARGETS UPDATE
  • 4.
    KEY INDUSTRY TRENDS:PIRELLI THE TRAILBLAZER Different dynamics vs. automotive Increasing role of Emerging Markets Premium Market development Clear strategy, solid financial structure and high flexibility are our strengths in managing rapid change in market scenario 2010 Top profitability despite high raw material cost inflation Solid pricing discipline : value is the common industry approach Timely responsiveness in a fast changing scenario Macro and market dynamics still favorable for EM; inflation concerns are rising Maximum profitability ever High flexibility (“what if” contingency plan ready) Best performer for price/mix improvement 50% of our sales in 2010 (+2pp yoy) Growing at a faster rate (3x vs market) >60% of consumer sales Premium vehicle manufacturers further expanding their footprint in Asia Strong track record in managing business in high-inflation countries Key trends Current Pirelli in 2010 the only premium tyre factory in China
  • 5.
    AGENDA KEY MESSAGESPIRELLI TYRE 2010 RESULTS APPENDIX PIRELLI & C 2010 FINANCIAL REVIEW 2011 OUTLOOK AND TARGETS UPDATE
  • 6.
    PIRELLI 2010FY RESULTSVS TARGETS* (**) Pirelli Re and Pirelli Broadband as discontinued operations FY’10 Results Δ YoY FY’10 revised Targets (Nov.’10)** € /bln (*) Ebit and Ebit margin are after continuous restructuring Revenues margin ~4.8 >7.5% 4.85 8.4% NFP 0.45 < 0.7 Capex >0.35 0.4 EBIT ~0.38 0.41 +19.2% +2.3p.p. -14% +95% +63.3% Tyre >4.7 4.77 +19.5% Tyre margin ~0.42 >8.5% 0.45 9.5% +46.8% +1.8p.p.
  • 7.
    PIRELLI KEY FINANCIALRESULTS Revenues EBITDA before Restruct. Costs Margin EBIT before Restruct. Costs Margin Restructuring Costs EBIT Margin Income from discontinued operations Net Income post minorities Net Debt Income before discontinued operations (Adj. Income) Pirelli Re Net Income Pirelli RE separation impact PBS Net Income PBS Capital gain € /mln (*) Pirelli RE and Pirelli Broadband as discontinued operations, 2009 figures have been restated for the purpose of data homogeneity PBT Tax rate (**) Net debt includes PRE/PBS 4,848.4 653.7 507.8 13.5% 12.5% (24.7) 407.8 (223.8) 21.7 8.4% 6.1% 249.7 22.7 455.6 (100.2) (55.2) 4,067.5 +19.2% 432.5 304.9 8.9% 7.5% +41.8% +28.7% 528.8** +63.3% +2.3 p.p. 1,229.7 173.6 150.2 14.1% 14.2% (12.3) 100.5 8.2% 6.7% 70.2 (27.1) 1,055.1 +16.5% 112.8 97.3 9.2% 9.2% +15.9% +15.6% +43.2% +1.5 p.p. 228.0 77.6 67.7 31.1 (29.0) (219) - (104.8) Effective pricing policy and winter sales driving tyre revenues growth Top profitability despite raw material impact (46% of FY’10 raw mat cost headwind) FY 2010 Tax rate reduction 1 year earlier Further portfolio reshaping: PBS sold in 4Q 2010, Cyoptic stake (34.4%) sold on Jan 2011 ( cash flow impact in 1Q 2011 ) Strong cash flow generation notwithstanding record investment (48% of FY capex) -73.2 vs ‘09 -249.3 vs 9M 2010 3.4 4.6 20.7 - +193.8% +117.7% 108.7 4.5 365.4 37.6% 53.8% 168.0 94.6 44.6 4Q results key drivers 4Q’10 Δ YoY 4Q’09 FY’10 Δ YoY FY’09
  • 8.
    PIRELLI NET INCOME (47.0) 35.0 158.1 21.7 22.7 (123.6) 4.3 FY’10 Tax rate:38% due to Pirelli Tyre fiscal structure improvement (35% Tyre tax rate, -3pp yoy) 18.4 5.0 FY’10 Oclaro capital gain Dividends from fin. part. & others (17.5) 5.9 FY’09 Devaluation/sale TI stake sales Dividends from fin. part. & others (27.8) € /mln EBIT Net Income Post Minorities FY’09 Income from Participations Net Income Post Minorities FY’10 Discontinued operations Taxes Financial Income & expenses Minorities
  • 9.
    PIRELLI 2010 NETFINANCIAL POSITION 528.8 85.1 (310) 52.3 455.6 (5.6) (67.2) Restructuring Cash Out € /mln 432.5 (438.6) 221.2 95.2 EBIT before restr. costs Investments*: Depreciation: Δ NWC & others: (31) 203.2 * Tangilble and intangible investments FY’09 Fin.Income/ Expenses Operating Cash Flow Dividends FY’10 Net Cash Flow PBS and PRE Net Fin. Invest. Others
  • 10.
    DEBT: EXTEND MATURITYAND DIVERSIFY SOURCES Gross Debt Maturity post refinancing FUNDING STRATEGY DEVELOPMENT 1 st step November 30, 2010: new 5-year 1.2 € bln committed revolving facilities replacing the 2 existing ones for 1.475 €/mln maturing in 2011 and 2012 2 nd step February 10, 2011: successful placement of 500 € mln 5-year bond issue on the Eurobond market (>9 times oversubscribed, over 93% placed with investors outside Italy) 2011 Cost of Debt: ~5.3% (~+1pp vs. 2010FY) consistent with 2011-2013 Industrial plan targets 12.8% 8.0% 22.0% 43.8% Gross Debt as of 2010 Y.E. 4.3% 9.1% 1,200 FY’10 2011 2012 2013 2014 2015 2016 & beyond 1 st step 49 252 380 767 1,147 146.7 123.3 92 104 380 380 2 nd step € /mln Committed Line Drawdown Other Borrowings Total Committed Lines Not Drawn Total 1,220 - 20 - - New revolving facility New 5 year bond
  • 11.
    DIVIDEND PROPOSAL *DPSrestated following P&C shares reverse stock split with the ratio of 1 new share per each 11 old shares **Net of treasury shares: 0.4 mln ordinary shares and 0.4mln savings shares. Ordinary shares Savings shares 0.1650 12 2.7 78.4 475 mln 2010 93% of parent company Net Income 81.1 Δ % yoy 2010 2009* 0.2290 0.1595 0.4466 (of which 0.2233 for the financial year 2008 ) stable DPS (€) N° of Shares** Dividends (€/mln) Parent Company Net Income: 87.4 €/mln (191.0 €/mln before disc. operations) Dividend Proposal to be filed with Pirelli & C. AGM (21 April 2011) Dividend Payment Schedule Coupon Detachment: 23 May, 2011 Dividend Payment: starting from 26 May, 2011
  • 12.
    AGENDA KEY MESSAGESPIRELLI TYRE 2010 RESULTS APPENDIX PIRELLI & C 2010 FINANCIAL REVIEW 2011 OUTLOOK AND TARGETS UPDATE
  • 13.
    4Q RESULTS HIGHLIGHTSDouble digit top line growth (+17.3% yoy) driven by solid price discipline and continuous focus on premium. Strong winter tyre season in Europe , leadership position in South America , increasing market share in North America , highest sales growth in Asia . The highest profitability of the year (10.7% Ebit margin before restructuring costs) notwithstanding the highest impact from raw materials, boosted by: high-value sales efficiencies and productivity gains (23 €/mln, 46% of 2010FY figures) Solid cash generation : 196.9 €/mln of operating cash flow through: strong operating results improvement inventory reduction and tight credit policy Notwithstanding record investments (over 185€/mln, ~50% of FY 2010)
  • 14.
    PIRELLI TYRE PERFORMANCERevenues margin EBITDA (before restruct. costs) EBIT (before restruct.costs) margin EBIT Net Income margin 1,110.0 146.4 13.2% 98.1 8.8% +35.8% +60.8% 95.5 +66.1% 50.1 8.6% +1.6 p.p. +2.2 p.p. +2.4 p.p. +19.8% 1,215.3 177.5 14.6% 127.1 10.5% +22.9% +33.5% +48.7% 121.8 +53.6% 60.3 10.0% +1.2 p.p. +1.9 p.p. +2.0 p.p. 1,233.8 173.0 14.0% 121.5 9.8% +18.3% +21.8% +28.8% 117.0 +36.2% 66.2 9.5% +0.4p.p. +0.8 p.p. +1.3 p.p. n.m. +52.3% +80.4% 1,212.9 187.4 15.5% 129.6 10.7% +17.3% +20.7% +23.8% 118.8 +38.5% 76.0 9.8% +0.5 p.p. +0.6 p.p. +1.5 p.p. +36.4% 4,772.0 684.3 14.3% 476.3 10.0% +19.5% +27.2% +37.9% 453.1 +46.9% 252.6 9.5% +0.8 p.p. +1.3 p.p. +1.8 p.p. +72.3% 1Q’10 YoY% 1Q’10 Revenue drivers 2Q’10 YoY% 3Q’10 YoY% 4Q’10 YoY% FY’10 YoY% 2Q’10 3Q’10 4Q’10 FY’10  Volume +17.4% +7.5% +3.4% +7.3% +1.8%  Price /Mix +1.4% +10.1% +11.3% +8.9% +12.3%  Exch. Rate +1.0% +5.3% +2.6% +3.3% +4.2%  Rev . ( before exch. rate impact ) +18.8% +17.6% +14.7% +16.2% +14.1% Strong sales growth in all regions and in both segments Focus on premium drives price mix to top levels Volumes improvement QoQ due to a strong winter tyre season Top profitability irrespective of the highest raw material impact: headwind more than offset by price mix € /mln
  • 15.
    PIRELLI TYRE BYREGION FY’09 FY’10 42% 6% Europe Premium and Prestige OEMs sales Increase Rising market share in winter tyres NAFTA Enhanced market share in North America through premium strategy and higher penetration LatAm Regional leadership confirmed with 2.2$ bln sales and a double digit profitability MEA & Asia-Pacific Double-digit growth in the Replacement segment Start delivering Premium OEMs in China 40% 10% 100% 100% 33% 34% Sales by region FY’10 Actions and Results 6% 10% 10% 9% Europe NAFTA MEA Asia Pacific Yoy growth Mature Markets Emerging Markets +16% +23% Latin America % on sales
  • 16.
    PIRELLI TYRE FY’10OPERATING PERFORMANCE (37.6) 50.1 101 331.9 3.2 476.3 345.5 (317.8) 104.7 (15.4) 22.8 19.8 131.9 3.5 129.6 (137.7) Labour / energy / other: (47.5) Raw materials: (270.3) 4Q 2010 FY2010 Labour / energy / other: (12.6) Raw materials: (125.1) € /mln EBIT FY’10 (before restr.costs) Depreciation/ other costs Exchange rate Efficiencies Cost of inputs Volume Price mix EBIT FY’09 (before restr. costs) EBIT 4Q’10 (before restr.costs) Depreciation/ other costs Exchange rate Efficiencies Cost of inputs Volume Price mix EBIT 4Q’09 (before restr. costs)
  • 17.
    PIRELLI TYRE NFPEVOLUTION Solid FCF generation in 4Q due to strong operating performance Capex/Dep ratio at 1.9 with capacity increase in Premium segment FY net cash flow: 144 €/mln before dividends EBIT (before restr. costs): 346.7 Investments*: (220.2) Depreciation: 150.2 Δ NWC & others: (105.1) FY’09 Operating Cash Flow (171.6) Financial charges / Taxes 158.1 Other (2.3) Restructuring Cash-out 37.5 FY’10 1,109.9 Dividends Operating Cash Flow (196.9) Financial charges / Taxes 42.7 Restructuring Cash-out 2.0 EBIT (before restr. costs): 129.6 Investments *: (184.8) Depreciation: 57.8 Δ NWC & others: 194.3 (13.5) Other 9M’10 1,027.3 1,205.0 156.0 Δ NFP: -95.1 Δ NFP: 177.7 Dividends 70.6 € /mln * Tangilble and intangible investments
  • 18.
    CONSUMER BUSINESS: KEYMARKET TRENDS 4Q‘09 +12% +12% +2% +44% +21% +8% 1Q’10 +37% +10% +73% +8% +25% +26% 2Q’10 +11% +11% +74% +8% +12% +14% 3Q’10 -2% +6% +26% +0% +11% +10% 4Q’10 +5% +7% +6% +1% +6% +4% FY’10 +13% +8% +39% +4% +13% +11% Car tyre shipments, % (yoy) Sources: major external data provider for each region and Pirelli estimates * Turkey and Russia included North America Mercosur Europe* OE Replacement OE Replacement OE Replacement
  • 19.
    780.9 106.0 13.6%69.5 8.9% +37.0% +65.9% +2.1 p.p. +2.7p.p. +16.5% 835.8 122.4 14.6% 84.7 10.1% +35.4% +55.4% +1.7 p.p. +2.3p.p. +19.1% +1.2% +14.9% +0.4% +16.1% +8.7% +6.2% +4.2% +14.9% CONSUMER BUSINESS: PIRELLI PERFORMANCE Revenues margin EBITDA (before restruct. costs) EBIT (before restruct.costs) margin  Price /Mix  Exch. Rate  Volume  Rev. ( before exch. rate impact ) Revenue drivers 1Q’10 YoY% 2Q’10 YoY% 3Q’10 YoY% 4Q’10 YoY% FY’10 YoY% 1Q’10 2Q’10 3Q’10 4Q’10 FY’10 847.1 118.9 14.0% 80.5 9.5% +18.5% +25.6% +0.4 p.p. +0.8p.p. +15.1% 836.5 141.1 16.9% 99.9 11.9% +26.4% +36.5% +1.7p.p. +16.2% +1.4 p.p. 3,300.3 488.4 14.8% 334.6 10.1% +28.6% +43.2% +1.8p.p. +16.7% +1.4 p.p. +10.7% +0.8% +3.6% +11.5% +9.3% +4.2% +2.7% +13.5% +7.6% +6.4% +2.7% +14.0% High double-digit sales growth through strong price/mix performance in every market FY and 4Q Ebit margin at historical record level 67.0 8.6% +67.9% +2.6p.p. 80.3 9.6% +57.5% +2.3p.p. EBIT margin 77.2 9.1% +30.4% +1.1p.p. 92.5 11.1% +54.9% +2.8p.p. 317.0 9.6% +51.1% +2.2p.p. € /mln
  • 20.
    NEW CONSUMER PRODUCTSPerformance Winter Cinturato P1 Snowcontrol Serie III Diablo Rosso II Winter ICEControl Summer Green
  • 21.
    INDUSTRIAL BUSINESS: KEYMARKET TRENDS Car tyre shipments, Sources: major external data provider for each region and Pirelli estimates 2Q‘09 1Q‘10 * Turkey and Russia included +1% +38% +65% +26% +67% +19% +61% +19% -50% +12% +3% +23% 4Q‘09 3Q’10 +90% +9% +22% +22% 4Q’10 +84% +15% +49% +23% Europe* +57% +18% +47% +23% FY’10 Mercosur OE Replacement OE Replacement
  • 22.
    329.1 40.4 12.3%28.6 8.7% +32.9% +49.7% +0.4 p.p. +1.2p.p. +28.4% 379.5 55.1 14.5% 42.4 11.2% +29.3% +36.8% -0.3 p.p. +0.4p.p. +32.0% Revenues margin EBITDA (before restruct. costs) EBIT (before restruct.costs) margin +1.8% +24.1% +2.5% +25.9% +13.7% +10.4% +7.9% +24.1%  Price /Mix  Exch. Rate  Volume  Rev. ( before exch. rate impact ) Revenue drivers INDUSTRIAL BUSINESS: PIRELLI PERFORMANCE 1Q’10 YoY% 2Q’10 YoY% 3Q’10 YoY% 4Q’10 YoY% FY’10 YoY% 1Q’10 2Q’10 3Q’10 4Q’10 FY’10 +15.7% +1.6% +2.4% +17.3% +12.3% +9.4% +4.6% +21.7% 1,471.7 195.9 13.3% 141.7 9.6% +23.8% +26.7% -0.3p.p. +0.0 p.p. +26.3% 376.4 46.3 12.3% 29.7 7.9% +6.2% -5.7% -1.6p.p. -2.1p.p. +19.7% 386.7 54.1 14.0% 41.0 10.6% +16.2% +4.2% +5.7% +20.4% +0.4 p.p. +29.7% +35.8% +0.8 p.p. +26.1% Two-digit price/mix variation ensuring positive pull-through on 1Q 2011 4Q Ebit margin impacted by Natural Rubber rising costs 28.5 8.7% +61.9% +1.8p.p. 41.5 10.9% +46.6% +1.1p.p. EBIT margin 39.8 10.3% +49.1% +1.6p.p. 26.3 7.0% +0.7% +1.3p.p. 136.1 9.2% +37.9% +0.7p.p. € /mln
  • 23.
    PIRELLI GREEN TECHNOLOGYGreen Performance DLTC: Dual Layer Tread Compound Hexa: Hexagonal Bead Wire Package High Penetration Steel Cords Green Materials and Structures SATT: Spiral Advanced Technology for Truck Technology Packages First Life Regr1 Retread1 Regr2 Retread2 CUSTOMER LIFECYCLE VALUE low rolling resistance = fuel saving >4% lower CO 2 emissions Enhanced tyre lifecycle: improved mileage and environmental impact Retreadability & Mileage towards 1,000,000 Km Fuel Savings 01 series reference GREEN AREA PERFORMANCE AREA
  • 24.
    AGENDA KEY MESSAGESPIRELLI TYRE 2010 RESULTS APPENDIX PIRELLI & C 2010 FINANCIAL REVIEW 2011 OUTLOOK AND TARGETS UPDATE
  • 25.
    2011 MARKET OUTLOOKVolumes: a more positive outlook based on Low inventory levels Order books for both summer and winter tyres Higher market forecast for truck tyres Price discipline: confirmed and effective Consumer: strong demand makes market receptive on prices increase Industrial: price increases are easier in rising Rapid Developing Economies Raw Materials Speculation, strong demand and geopolitical crisis are driving raw mat rally Industry reaction: price discipline in the short term and diversification/reduction of natural rubber dependance in the mid/long term
  • 26.
    Global Tyre TruckMarket Global Tyre Car Market OE: +5% Emea +1% Nafta +7% LatAM +5% Asia Pacific +6% 5% Non Premium Tyres T, H, V, VAN, SUV & Winter <H Premium Tyres (*) : WYZ, RF, SUV & Winter ≥ H 75% 75% 25% 25% 166 179 +8% +8% +8% Replacement : +5% Emea +3% Nafta +3% LatAM +5% Asia Pacific +9% OE : +7% Emea +30% Nafta +20% LatAM +5% Asia Pacific flat Replacement : +8% Emea +6% Nafta +6% LatAM +9% Asia Pacific +9% 4% Mln pcs Mln pcs 2011 OUTLOOK: VOLUMES Emerging Mature Update March ‘11 Ind. Plan (nov. ’10) 1.230 11% 2010 1.290 2011 12% +14% +4% +5% 2010 2011 Update March ‘11 Ind. Plan (nov. ’10) (*) revised criteria vs 2011-2013 Industrial Plan without “V” rated car tyres
  • 27.
    2011 OUTLOOK: CAPEXPLAN Settimo Torinese high tech plant operational from 4Q, 2010 +23% capacity increase in Premium tyres in China and Romania New plant in Mexico, first tyre in 2012 RDE, Rapid Development Economy 2010 2011 40% 60% 21% 79% 78% 22% 73% 27% 100% 100% 0.4 >0.5 Capex (€/ b ln) Year End Capacity (mln pcs) CONSUMER INDUSTRIAL 36% 42% 4% 18% yoy yoy 18% 55% 3% 24% TOTAL INVESTMENT ALLOCATION Mature LATAM & RDE* Mature LATAM & RDE* >0.1 0.3 0.1 2010 2011 2010 2011 56 5.8 62 6.3 +10% +11% +14% +9% INVESTMENTS 0.4
  • 28.
    2011 OUTLOOK: RAWMATERIAL 195 263 270 332 Raw material impact on Ebit Price/Mix impact on Ebit 125 132 99 95 80% already covered by price increases currently being applied in all markets 20% to be covered with additional price increase Cost headwind will be fully compensated by price/mix improvement 2008 2010 2009 4Q 2010 Raw material impact on Ebit: 580 €/mln assuming Natural rubber @ 4,900$/ton (yearly average as a cost of goods sold) Oil @ 110$/barrel (yearly average as a cost of goods sold) Pirelli pricing power to offset raw mat impact: a significant track record in the industry
  • 29.
    46% 16% 13%80 € mln 2011 EFFICIENCY PLAN CONFIRMED 25% Scale Productivity Target Cost Management Total savings 2011 vs 2010 Allocation to low cost plants
  • 30.
    PIRELLI 2011 TARGETS*UPDATE Revenues EBIT % >5.15 >5.55 NFP ~0.7 Capex 1.2 in 3 y >0.5 Tyre >5.1 Volumes Price/mix +4% +4% Tyre 8.5% ÷ 9.5% 9% ÷ 10% >5.5 confirmed confirmed ≥ +6% ~+12% Tax rate 39%/38% (-1pp/-2pp vs. 2010E tax rate) ≤ 38% 2011 Target Update 2011 Target (Nov. 4 2010) *Ebit and Ebit margin are after continuous restructuring € /bln
  • 31.
    AGENDA KEY MESSAGESPIRELLI TYRE 2010 RESULTS APPENDIX PIRELLI & C 2010 FINANCIAL REVIEW 2011 OUTLOOK AND TARGETS UPDATE
  • 32.
    Profit & Lossand Net Financial Position by Business Unit PIRELLI GROUP – FY’10 RESULTS * Pirelli Tyre Other Pirelli & C. Cons. FY’10 FY’09 (**) NFP includes PRE/PBS € /mln FY’10 FY’09 FY’10 FY’09 (*) Pirelli RE & Pirelli Broadband Solutions as discontinued operations, 2009 figures have been restated for the purpose of data homogeneity Sales 4,772.0 3,992.9 76.4 74.6 4,848.4 4067.5 ∆ % 19.5% 19.2% EBITDA before Restruct Costs 684.3 538.0 (30.6) (30.2) 653.7 507.8 % on sales 14.3% 13.5% 13.5% 12.5% EBIT before Restruct Costs 476.3 345.5 (43.8) (40.6) 432.5 304.9 % on sales 10.0% 8.7% 8.9% 7.5% Restructuring Costs (23.2) (37.0) (1,5) (18.2) (24.7) (55.2) EBIT 453.1 308.5 (45.3) (58.8) 407.8 249.7 % on sales 9.5% 7.7% 8.4% 6.1% Results from equity partecipations (0.3) 4.2 23.1 (15.8) 23.4 (11.6) Financial Income/Charges (66.4) (76.1) 0.6 6.0 (65.8) (70.1) EBT 387.0 236.6 (21.6) (68.6) 365.4 168.0 Fiscal Charges (134.4) (90.0) 3.0 0.4 (137.4) (90.4) Net Result before disc. Op. 252.6 146.6 (24.6) (69.0) 228.0 77.6 Net Financial Position 1,109.9 1,027.3 (654.3) (504.1) 455.6 528.8** Discontinued Operations (223.8) (100.2) (223.8) (100.2) Net Income 252.6 146.6 (248.4) (169.2) 4.2 (22.6) Attributable Net Income 21.7 22.7
  • 33.
    PIRELLI GROUP –4Q’10 RESULTS * Profit & Loss and Net Financial Position by Business Unit (*) Pirelli RE & Pirelli Broadband Solutions as discontinued operations, 2009 figures have been restated for the purpose of data homogeneity (**) NFP includes PRE/PBS € /mln 4Q’10 4Q’09 4Q’10 4Q’09 4Q’10 4Q’09 Pirelli Tyre Other Pirelli & C. Cons. % on sales 6.3% 5.4% 5.5% 2.9% 1,212.9 1,034.3 16.8 20.8 1,229.7 1,055.1 17.3% 16.5% 187.4 155.2 (13.8) (5.0) 173.6 150.2 15.5% 15.0% 14.1% 14.2% 129.6 104.7 (16.8) (7.4) 112.8 97.3 (10.8) (18.9) (1.5) (8.2) (12.3) (27.1) 118.8 85.8 (18.3) (15.6) 100.5 70.2 (13.7) (16.4) 2.4 1.2 (11.3) (15.2) (29.0) (14.1) 2.1 0.6 (26.9) (13.5) 76.0 55.7 (8.3) (24.6) 67.7 31.1 1,109.9 1,027.3 (654.3) (504.1) 455.6 528.8** Net Financial Position (0.1) 0.4 5.5 (10.8) 5.4 (10.4) 10.7% 10.1% 9.2% 9.2% 9.8% 8.3% 8.2% 6.7% 105.0 69.8 (10.4) (25.2) 94.6 44.6 Sales ∆ % EBITDA before Restruct Costs % on sales EBIT before Restruct Costs % on sales Restructuring Costs EBIT % on sales Results from equity partecipations Financial Income/Charges EBT Fiscal Charges Net Result before disc. Op.
  • 34.
    Pirelli Tyre OtherPirelli & C. Cons. PIRELLI GROUP – 3Q’10 RESULTS * Profit & Loss and Net Financial Position by Business Unit (**) NFP includes PRE/PBS € /mln 3Q’10 3Q’09 3Q’10 3Q’09 3Q’10 3Q’09 (*) Pirelli RE & Pirelli Broadband Solutions as discontinued operations, 2009 and 2010 figures have been restated for the purpose of data homogeneity 5.4% 3.5% 6.7% 1.9% 1,233.8 1,042.7 15.9 15.8 1,249.7 1,058.5 18.3% 18.1% 14.0% 13.6% 14.0% 12.5% 121.5 94.3 (1.6) (12.5) 119.9 81.8 (4.5) (8.4) 0.0 (10.0) (4.5) (18.4) 117.0 85.9 (1.6) (22.5) 115.4 63.4 (14.0) (16.7) 0.0 0.9 (14.0) (15.8) (36.8) (32.5) (3.3) (0.6) (40.1) (33.1) 66.2 36.7 17.1 (16.4) 83.3 20.3 1,205.0 1,298.6 (575.5) (545.8) 704.9 691.4** Net Financial Position 0.0 0.0 22.0 5.8 22.0 5.8 9.8% 9.0% 9.6% 7.7% 9.5% 8.2% 9.2% 6.0% 103.0 69.2 20.4 (15.8) 123.4 53.4 173.0 142.0 1.9 (9.9) 174.9 132.1 Sales ∆ % EBITDA before Restruct Costs % on sales EBIT before Restruct Costs % on sales Restructuring Costs EBIT % on sales Results from equity partecipations Financial Income/Charges EBT Fiscal Charges Net Result before disc. Op. % on sales
  • 35.
    Pirelli Tyre OtherPirelli & C. Cons. PIRELLI GROUP – 2Q’10 RESULTS * Profit & Loss and Net Financial Position by Business Unit (**) NFP includes PRE/PBS € /mln 2Q’10 2Q’09 2Q’10 2Q’09 2Q’10 2Q’09 (*) Pirelli RE & Pirelli Broadband Solutions as discontinued operations, 2009 and 2010 figures have been restated for the purpose of data homogeneity 5.0% 4.0% 3.3% 1.1% 1,215.3 989.0 19.3 17.4 1,234.6 1,006.4 22.9% 10.9% 22.7% 14.6% 13.4% 13.2% 12.5% 127.1 85.5 (17.5) (9.7) 109.6 75.8 (5.3) (6.2) 0.0 0.0 (5.3) (6.2) 121.8 79.3 (17.5) (9.7) 104.3 69.6 (22.3) (19.9) (0.6) 1.6 (22.9) (18.3) (39.4) (20.1) (0.6) 0.4 (40.0) (19.7) 60.3 39.6 (20.0) (28.3) 40.3 11.3 1,212.9 1,467.0 (553.5) (664.9) 696.9 1,107.6** Net Financial Position 0.2 0.3 (1.3) (20.6) (1.1) (20.3) 10.5% 8.6% 8.9% 7.5% 10.0% 8.0% 8.4% 6.9% 99.7 59.7 (19.4) (28.7) 80.3 31.0 177.5 133.0 (14.2) (7.0) 163.3 126.0 Sales ∆ % EBITDA before Restruct Costs % on sales EBIT before Restruct Costs % on sales Restructuring Costs EBIT % on sales Results from equity partecipations Financial Income/Charges EBT Fiscal Charges Net Result before disc. Op. % on sales
  • 36.
    PIRELLI GROUP –1Q’10 RESULTS * Profit & Loss and Net Financial Position by Business Unit (**) NFP includes PRE/PBS € /mln (*) Pirelli RE & Pirelli Broadband Solutions as discontinued operations, 2009 and 2010 figures have been restated for the purpose of data homogeneity Pirelli Tyre Other Pirelli & C. Cons. 1Q’10 1Q’09 1Q’10 1Q’09 1Q’10 1Q’09 4.5% 1.6% 3.2% 1.6% 1,110.0 926.9 24.4 20.6 1,134.4 947.5 19.8% 19.7% 13.2% 11.6% 12.5% 10.5% 98.1 61.0 (7.9) (11.0) 90.2 50.0 (2.6) (3.5) 0.0 0.0 (2.6) (3.5) 95.5 57.5 (7.9) (11.0) 87.6 46.5 (16.4) (23.1) (1.2) 2.3 (17.6) (20.8) (29.2) (23.3) (1.2) (0.8) (30.4) (24.1) 50.1 14.6 (13.4) 0.3 36.7 14.9 1,122.5 1,521.8 (475.8) (519.9) 678.4 1,278.9** 0.2 3.5 (3.1) 9.8 (2.9) 13.3 8.8% 6.6% 8.0% 5.3% 8.6% 6.2% 7.7% 4.9% 79.3 37.9 (12.2) 1.1 67.1 39.0 146.4 107.8 (4.5) (8.3) 141.9 99.5 Sales ∆ % EBITDA before Restruct Costs % on sales EBIT before Restruct Costs % on sales Restructuring Costs EBIT % on sales Results from equity partecipations Financial Income/Charges EBT Fiscal Charges Net Result before disc. Op. % on sales Net Financial Position
  • 37.
    PIRELLI BALANCE SHEET€ /mln % Net Invested Capital FY‘10 FY‘09 84.7% 65.6% P.Tyre 20.2% P.Real Est. -0.1% PBS 15.3% 14.3% Other *following Pirelli & C reverse stock split (1:11 ratio for ordinary and savings shares) Net Working Capital FY’10 FY’09 Fixed Assets 3,164.1 2,936.0 Net Invested Capital continuing operations 3,280.8 3,051.1 Overall Net Invested Capital 3,280.8 3,818.0 Total Net Equity 2,028.0 2,494.7 Continuing operations provisions 797.2 714.6 Continuing Operations Net Financial Position 455.6 523.2 Total 3,280.8 3,818.0 Attributable Net Equity 1,990.8 2,175.0 Equity per Share (euro) 4,080 4.457* Net Invested Capital assets disposed 766.9 Provisions assets disposed 79.9 Net Financial Position assets disposed 5.6 Gearing 0.22 0.21 ROI 11.5% 6.3% 116.7 115.1
  • 38.
    PIRELLI GROUP CASHFLOW € /mln 1Q’10 2Q’10 3Q’10 4Q’10 FY’10 EBIT before restructuring costs 109.6 90.2 112.8 119.9 432.5 Depreciation 53.7 51.7 60.8 55.0 221.1 Net investments (85.2) (49.9) (212.0) (91.5) (438.6) Working capital/other variations 42.2 (143.5) 214.5 (18.0) 95.2 OPERATING CASH FLOW 120.3 (51.5) 176.1 65.4 310.3 Financial income (expenses) (22.9) (17.6) (11.3) (14.0) (65.8) Tax charges (40.0) (30.4) (26.9) (40.1) (137.4) NET OPERATING CASH FLOW 57.4 (99.5) 137.9 11.3 107.1 Financial investments/disinvestitures - - 21.9 9.8 31.7 Cash-out for restructuring (9.9) (34.0) (2.0) (7.4) (53.3) Exchange rate differentials/Others 24.9 10.0 16.1 16.2 67.2 PRE Net Cash Flow (6.5) (14.0) 88.3 (26.5) 41.3 PBS Net Cash Flow 0.7 (12.1) (12.9) (11.4) (35.7) Dividends paid (85.1) - - (85.1) - NET CASH FLOW (18.5) (149.6) 249.3 (8.0) 73.2
  • 39.
    PIRELLI GROUP: NETFINANCIAL POSITION FY’10 BY BUSINESS Tyre Other business Pirelli Group Corporate Net Financial Position including PRE / PBS Jun. 10 Dec. 09 696.9 528.8 Dec. 10 Jun. 10 Dec. 09 Dec. 10 Jun. 10 Dec. 09 Dec. 10 Jun. 10 Dec. 09 Dec. 10 € /mln Net Financial Position 1,212.9 88.4 (641.9) 659.4 1,027.3 94.7 (598.9) 523.2 1,109.9 71.9 (726.2) 455.6 PRE Net Financial Position 61.8 41.3 Gross Debt 1,778.2 98.8 277.3 1,323.1 1,553.6 99.1 276.5 1,444.5 1,613.6 83.3 123.0 1,147.0 to Corporate 738.1 64.7 411.3 73.4 589.6 83.3 Financial receivables (153.2) (0.2) (870.9) (193.1) (84.8) (0.1) (561.4) (161.5) (98.3) (4.8) (806.7) (236.9) Cash and cash equivalents (412.1) (10.2) (48.3) (470.6) (441.5) (4.3) (314.0) (759.8) (405.4) (6.6) (42.5) (454.5) PBS Net Financial Position (24.3) (35.7)
  • 40.
    FY’10 PIRELLI TYREMIX Car 62% Motorbike 8% Steelcord & others 2% Truck 28% SALES BY SEGMENT Consumer 70% SALES BY BUSINESS Industrial 30% SALES BY REGION Replacement 75% OE 25% SALES BY CHANNEL Latin America 34% MEA 10% Asia Pacific 6% Europe 40% Nafta 10%
  • 41.
    FY ‘10 PIRELLITYRE PEOPLE Workers 81% Management 1% Employees 18% Europe 37% Nafta 1% Latin America (w/o Mexico) 43% Asia Pacific 9% Permanents 92% Temps & Agency 8% MEA 10% PEOPLE BY REGION PEOPLE BY CLUSTER PEOPLE BY CONTRACT 2009 2010 28,865 27,481 HEADCOUNT
  • 42.
    PIRELLI TYRE: 19INDUSTRIAL PLANTS IN 11 COUNTRIES (AS OF DEC. 2010) Izmit Car/Truck Steelcord Slatina Car/Steelcord Yanzhou Car/Truck Alexandria Truck Merlo Car Guacara Car Rome Car Burton Carlisle Car Car Campinas Feira de Santana Santo André Gravatai Sumaré Car Car/Truck Truck/Agro Moto/Truck Steelcord Bollate (MI) Settimo Torinese Figline Valdamo Car Car/Truck Steelcord Breuberg Merzig Car/Moto Steelcord Turkey Romania China Egypt Argentina Venezuela U.S.A U.K. Brazil Italy Germany
  • 43.
    RAW MATERIALS FY2010 MIX (BASED ON PURCHASING COST) Raw mat costs on sales: 39% Natural Rubber: Sicom Brent: www.oilnergy.com In Italic Year Average RAW MATERIALS PRICE TREND Synth. Rubber 24% Natural Rubber 3 33% Textiles 10% Steelcord 8% Chemicals 14% Carbon black 11% (+1pp yoy) (+9pp yoy) (-3pp yoy) (-2pp yoy) (-2pp yoy) (-3pp yoy) 96 123 117 57 45 60 69 76 77 80 77 87 2,653 2,943 2,973 1,553 1,330 1,523 1,837 2,513 3,096 3,022 3,148 4,254 80 63 99 3,380 1,801 2,531 Natural Rubber (in usd/tons) Brent Oil (in usd/bbl) 1Q/08 = 100
  • 44.
    Prestige Premium SynergicSegment Share Solid foothold in Europe , in prestige/premium segments Historical leadership in Latin America Growth opportunities in Asia-Pacific markets with new China source Only high-end, high added value products in high cost countries Production Footprint moving forward Leading brand in Prestige niche Development partner of all EU premium car makers Leading supplier to the Automotive Industry in Latin America Leader in the Motorcycle business with Pirelli and Metzeler Brands PIRELLI TYRE SELECTIVE POSITIONING IN THE CONSUMER SEGMENT Source: LMC, Pirelli estimates, June 2010 Investor Presentation Pirelli in 2008 Pirelli in 2010 Market in 2010 Pirelli in 2010 % of production % of sales 100% 100% 27% 100% 27% 30% 29% 39% 54% 6% 61% 6% 71% 37% 100% 13% Sales Breakdown By Area Pirelli Focus Production By Area High Cost Low Cost Emea NAFTA Latin America Asia Pacific
  • 45.
    11% INDUSTRIAL SEGMENT:A UNIQUE COMPETITIVE POSITION Pirelli in 2008 Pirelli in 2010 100% 100% Market in 2010 Pirelli in 2010 % of sales 15% 100% 100% 50% 50% Sales focus in high-growth areas Not present in North America Product cost leadership supported by a low-cost production base Leading position in Pirelli key markets Proprietary steelcord technology Latin America Southern EU and Near-East Northern Africa China 7% 13% 40% 24% 93% 87% Premium Source: LMC, Pirelli estimates Sales Breakdown By Area Pirelli Focus Production By Area 10% % of production Emea NAFTA Latin America Asia Pacific High Cost Low Cost
  • 46.
    NEW PROJECTS ITALY- SETTIMO TORINESE Product: Car Tyres First tyre: 4Q 2010 CHINA – YANZHOU “2” Product: car and motorbike tyres First tyre: 2Q 2011
  • 47.
    ROMANIA – SLATINA“2” Product: Car Tyres First tyre: 4Q 2010 MEXICO - GUANAJUATO Product: Car Tyres First tyre: 2Q 2012 NEW PROJECTS

Editor's Notes

  • #43 LET ME SUMMARIZE A FEW QUALITATIVE RESULTS WE ACHIEVED OVER THE LAST Q: PIRELLI WAS ONE OF THE TWO ONLY BRANDS SCORING ABOVE AVERAGE IN 2008 JD POWER OE TIRE CUSTOMER SATISFACTION STUDY IN US. PIRELLI WAS AGAIN. AND BY FAR. THE TOP OF MIND BRAND IN BRAZILIAN RESEARCH DATAFOLHA. OUR WINTER PRODUCTS HAVE BEEN SUCCESFULLY TESTED BY ALL MAJOR MAGAZINES IN EUROPE. CINTURATO. OUR GREEN TYRE. WON A TEST BASED ON BRAKING AND HANDLING MADE BY THE FRENCH MAGAZINE AUTOJOURNAL. OUR PRODUCTS SHOWED UP AT PARIS MOTORSHOW ON MOST OF THE NEW CAR AND SUV PLATFORMS FROM THE NEW FERRARI CALIFORNIA TO THE NEW VOLVO XC60 MOTORSPORT ACTIVITIES WERE AT THE HIGHEST WITH WRC AND SBK CHAMPIONSHIPS.