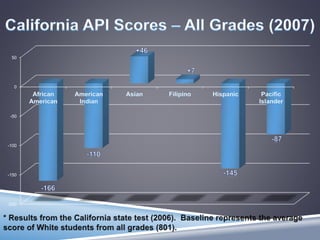
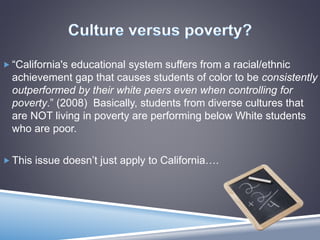
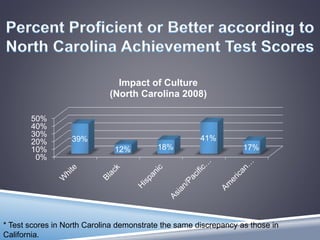
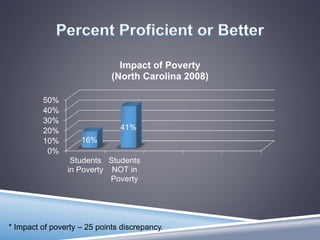
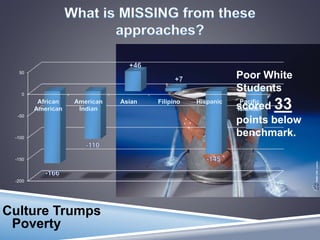
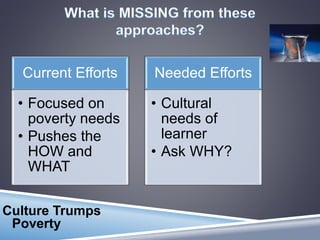
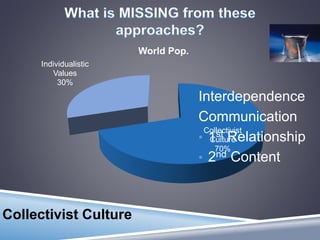
Group 1:
Jerry Dugan, Heather Judkins, José Ramirez, Maria Silva
& Raymond Soto
 California children (for all grades) need to achieve an API (Academic
Performance Index) score of 800 to be considered “acceptable.”
-200
-150
-100
-50
0
50
 “California's educational system suffers from a racial/ethnic
achievement gap that causes students of color to be consistently
outperformed by their white peers even when controlling for
poverty.” (2008) Basically, students from diverse cultures that
are NOT living in poverty are performing below White students
who are poor.
 This issue doesn’t just apply to California….
 Impact of culture and poverty is outlined in the following charts as published
by the 2007 National Assessment of Educational Progress (NAEP).
 There is a gap in achievement due to both culture and poverty regardless of
which results we examine. State tests and national tests both yield these
same results.
0%
10%
20%
30%
40%
50%
39%
12% 18%
41%
17%
Impact of Culture
(North Carolina 2008)
* Test scores in North Carolina demonstrate the same discrepancy as those in
California.
0%
10%
20%
30%
40%
50%
Students
in Poverty
Students
NOT in
Poverty
16%
41%
Impact of Poverty
(North Carolina 2008)
* Impact of poverty – 25 points discrepancy.
 Curriculum – Subjects/concepts are covered quickly without focusing on
student understanding. If a student doesn’t “get it,” we assume they will
understand next time as it spirals around again.
 Instruction – Which instructional strategies for our curriculum will work best for
our students? Have teachers received proper professional development for
the State Standards?
 Assessment – Many assessments used (benchmark, textbook assessments,
state mandated testing, etc.) but are the results being used as they should
be? What is being done with the information gathered?
.
Deficit model of thinking
Students of poverty and diverse cultures have
deficits
List of characteristics
 Poor vocabulary
 Lack of background knowledge
 Being inattentive
 Involvement with gangs and drugs
.
Programs have evolved, but are they the best
approach.
 Ex. Ruby Payne’s, A Framework for Understanding
Poverty (Payne, 2005)
 Authors Bomer and colleagues examined Ruby Payne’s
framework
 What patterns are detectable in Payne’s truth claims
about children’s lives in poverty?
 To what extent are those truth claims supported by
existing research?
.
 Valencia writes “. . .deficit thinking is an explanation of
school failure among individuals linked to . . . Racial/ethnic
minority status and economic disadvantage.”
 Children’s low performance is linked to cognitive and
motivational deficits.
 This approach places the blame of low performance on the
student not the school.
 Paul Gorski “The Myth of the Culture of Poverty”
 “suggests that instead of accepting myths that harm low-
income students, we need to eradicate the system wide
inequities that stand in their way.”
Impacts on achievement
 Poverty (ES = .76)
 Racial gaps
 Study done by Richard Coley (Educational Testing Services)
 “The Family: America’s Smallest School”
 One parent home
 Eighth graders who are absent at least three times a month
 Five or younger who's parents read to them daily
 Eighth graders who watch five or more hours of T.V.
 Funded by NCLB Act.
 Its purpose is to serve students of poverty.
 Funds are provided base on the number of students who receive
free and reduced lunch.
 The largest federal elementary and secondary education
program.
 Portions of the fund are allocated for further professional
development of teachers.
 Funds are focused to help students mainly in reading and
mathematics.
 Has been credited with closing the achievement gaps between
advantaged and disadvantaged students.
High poverty schools that receive Title I
funding are mandated to have “highly qualified
teachers.”
Designed for catching up and reinforcement of
scholastic material.
Works best when implemented by
knowledgeable teachers, who know all of their
students’ needs.
 Provided when schools are not meeting “adequate yearly
progress” (AYP).
Four Main
Areas to
Consider
Culture Trumps
Poverty
-200
-150
-100
-50
0
50
Poor White
Students
scored 33
points below
benchmark.
Culture Trumps
Poverty
Current Efforts
• Focused on
poverty needs
• Pushes the
HOW and
WHAT
Needed Efforts
• Cultural
needs of
learner
• Ask WHY?
Collectivist
Culture
70%
Individualistic
Values
30%
World Pop.
Collectivist Culture
Interdependence
Communication
• 1st Relationship
• 2nd Content
“Both/And” is Possible
Collectivist Culture
Environment
AND
Individualistic
Accountability
Mathemathics &
Science
Hands-on
Innovation
 We need to guide the thinking process with attention to
meaning making.
 We need to guide the thinking process with attention to meaning
making.
 We need to attend to the context and culture of our
students of poverty.
 We need to guide the thinking process with attention to meaning
making.
 We need to attend to the context and culture of our students of
poverty.
 We need to use technology at the point of instruction and for
demonstrating learning for our digital students.
 We need to guide the thinking process with attention to
meaning making.
 We need to attend to the context and culture of our
students of poverty.
 We need to use technology at the point of instruction and
for demonstrating learning for our digital students.
 We need to provide opportunities for small group work with
individual accountability built into it.
 We need to guide the thinking process with attention to meaning
making.
 We need to attend to the context and culture of our students of
poverty.
 We need to use technology at the point of instruction and for
demonstrating learning for our digital students.
 We need to provide opportunities for small group work with
individual accountability built into it.
 We need to use strategies that allow students to “think out loud”
and to process their thinking together to make meaning.
American education is at a We can continue to make changes that
address
the needs of to improve achievement but that doesn’t address the
needs
of our increasing
diverse
However, the consequences for
ignoring
the educational differences and needs of children of poverty will impact all of
us.
For America to maintain its place
in a
we need all of our children to
be
productive members of society. They
need
beyond in order to
compete.
We must create the conditions in our K-12 schools to allow entry
into
a means of entry to the to for
middle class to sustain a democracy. We can no longer accept the old
paradigm
model that holds low expectations for
We need a
substantial
We can no longer blame
We know what works; we need the
moral courage to implement it.
who are not provided
an
that builds resilience to
overcome the circumstances of their birth are not given the opportunity
to
contribute the assets that they bring
We need to invest in them, learn from them, and we will all benefit.
to this country.
who do not achieve in
school
our social services and our
health care system and fill our
In the country with the most abundance
of
we can no longer
educationally
address only the needs
of
Our needs to provide equal
access to a quality education for all of its children. We all deserve no less.

Relationship of Culture and Poverty in Education

  • 1.
    Group 1: Jerry Dugan,Heather Judkins, José Ramirez, Maria Silva & Raymond Soto
  • 2.
     California children(for all grades) need to achieve an API (Academic Performance Index) score of 800 to be considered “acceptable.”
  • 3.
  • 4.
     “California's educationalsystem suffers from a racial/ethnic achievement gap that causes students of color to be consistently outperformed by their white peers even when controlling for poverty.” (2008) Basically, students from diverse cultures that are NOT living in poverty are performing below White students who are poor.  This issue doesn’t just apply to California….
  • 5.
     Impact ofculture and poverty is outlined in the following charts as published by the 2007 National Assessment of Educational Progress (NAEP).  There is a gap in achievement due to both culture and poverty regardless of which results we examine. State tests and national tests both yield these same results.
  • 6.
    0% 10% 20% 30% 40% 50% 39% 12% 18% 41% 17% Impact ofCulture (North Carolina 2008) * Test scores in North Carolina demonstrate the same discrepancy as those in California.
  • 7.
    0% 10% 20% 30% 40% 50% Students in Poverty Students NOT in Poverty 16% 41% Impactof Poverty (North Carolina 2008) * Impact of poverty – 25 points discrepancy.
  • 9.
     Curriculum –Subjects/concepts are covered quickly without focusing on student understanding. If a student doesn’t “get it,” we assume they will understand next time as it spirals around again.  Instruction – Which instructional strategies for our curriculum will work best for our students? Have teachers received proper professional development for the State Standards?  Assessment – Many assessments used (benchmark, textbook assessments, state mandated testing, etc.) but are the results being used as they should be? What is being done with the information gathered?
  • 11.
    . Deficit model ofthinking Students of poverty and diverse cultures have deficits List of characteristics  Poor vocabulary  Lack of background knowledge  Being inattentive  Involvement with gangs and drugs
  • 12.
    . Programs have evolved,but are they the best approach.  Ex. Ruby Payne’s, A Framework for Understanding Poverty (Payne, 2005)  Authors Bomer and colleagues examined Ruby Payne’s framework  What patterns are detectable in Payne’s truth claims about children’s lives in poverty?  To what extent are those truth claims supported by existing research?
  • 13.
    .  Valencia writes“. . .deficit thinking is an explanation of school failure among individuals linked to . . . Racial/ethnic minority status and economic disadvantage.”  Children’s low performance is linked to cognitive and motivational deficits.  This approach places the blame of low performance on the student not the school.
  • 14.
     Paul Gorski“The Myth of the Culture of Poverty”  “suggests that instead of accepting myths that harm low- income students, we need to eradicate the system wide inequities that stand in their way.”
  • 15.
    Impacts on achievement Poverty (ES = .76)  Racial gaps  Study done by Richard Coley (Educational Testing Services)  “The Family: America’s Smallest School”  One parent home  Eighth graders who are absent at least three times a month  Five or younger who's parents read to them daily  Eighth graders who watch five or more hours of T.V.
  • 16.
     Funded byNCLB Act.  Its purpose is to serve students of poverty.  Funds are provided base on the number of students who receive free and reduced lunch.  The largest federal elementary and secondary education program.  Portions of the fund are allocated for further professional development of teachers.  Funds are focused to help students mainly in reading and mathematics.  Has been credited with closing the achievement gaps between advantaged and disadvantaged students.
  • 17.
    High poverty schoolsthat receive Title I funding are mandated to have “highly qualified teachers.”
  • 18.
    Designed for catchingup and reinforcement of scholastic material. Works best when implemented by knowledgeable teachers, who know all of their students’ needs.
  • 19.
     Provided whenschools are not meeting “adequate yearly progress” (AYP).
  • 20.
  • 21.
  • 22.
    Culture Trumps Poverty Current Efforts •Focused on poverty needs • Pushes the HOW and WHAT Needed Efforts • Cultural needs of learner • Ask WHY?
  • 23.
  • 24.
    “Both/And” is Possible CollectivistCulture Environment AND Individualistic Accountability
  • 25.
  • 27.
     We needto guide the thinking process with attention to meaning making.
  • 28.
     We needto guide the thinking process with attention to meaning making.  We need to attend to the context and culture of our students of poverty.
  • 29.
     We needto guide the thinking process with attention to meaning making.  We need to attend to the context and culture of our students of poverty.  We need to use technology at the point of instruction and for demonstrating learning for our digital students.
  • 30.
     We needto guide the thinking process with attention to meaning making.  We need to attend to the context and culture of our students of poverty.  We need to use technology at the point of instruction and for demonstrating learning for our digital students.  We need to provide opportunities for small group work with individual accountability built into it.
  • 31.
     We needto guide the thinking process with attention to meaning making.  We need to attend to the context and culture of our students of poverty.  We need to use technology at the point of instruction and for demonstrating learning for our digital students.  We need to provide opportunities for small group work with individual accountability built into it.  We need to use strategies that allow students to “think out loud” and to process their thinking together to make meaning.
  • 34.
    American education isat a We can continue to make changes that address the needs of to improve achievement but that doesn’t address the needs of our increasing diverse However, the consequences for ignoring the educational differences and needs of children of poverty will impact all of us. For America to maintain its place in a we need all of our children to be productive members of society. They need beyond in order to compete.
  • 35.
    We must createthe conditions in our K-12 schools to allow entry into a means of entry to the to for middle class to sustain a democracy. We can no longer accept the old paradigm model that holds low expectations for We need a substantial We can no longer blame We know what works; we need the moral courage to implement it.
  • 36.
    who are notprovided an that builds resilience to overcome the circumstances of their birth are not given the opportunity to contribute the assets that they bring We need to invest in them, learn from them, and we will all benefit. to this country. who do not achieve in school our social services and our health care system and fill our
  • 37.
    In the countrywith the most abundance of we can no longer educationally address only the needs of Our needs to provide equal access to a quality education for all of its children. We all deserve no less.

Editor's Notes

  • #3 This leads up to the first graph from California’s state testing scores. Students had to score an 800 or above on the California standardized test.
  • #4 Representative of ALL grade levels. With the “White” baseline of 801, students of other cultures scored as indicated.
  • #5 The text fluctuates a bit on if poverty is a factor or not… we do know from these results, however, that students of different cultures that were middle-class still performed below White students living in poverty.
  • #6 In taking a look at the “other side of the United States,” scores from North Carolina were also analyzed. The National Assessment of Educational Progress (NAEP) results from North Carolina are covered in the next slide.
  • #7 Scores are equally as disproportionate as those in California. Culture still seems to hold more of a bearing on test scores than poverty.
  • #8 There is a 25 points discrepancy within the scores of students of poverty versus those not living in poverty (affluent and middle-class).
  • #9 There is no simple one-size-fits-all solution for these issues.
  • #10 There have been attempts to correct the problem by focusing on curriculum, instruction and assessment. Curriculum - merely aligning curriculum with state standards does not help. Pacing guides force teachers to cover topics too quickly and student prerequisite knowledge is not taken into account. The theory is that the subject will be covered again and the student will have another chance to gain understanding. Instruction – Teachers all have strategies, but there are research-based instructional practices have been aligned to state standards in all states for two content areas, but this is not widely known. Further, there is a study indicating that effective instructional practice combined with professional development has a great effect on overriding the effects of poverty. Effective strategies are covered later in the text. Assessment – How much is too much? Too much time used on tests? Many, many tests given, but are results used to improve achievement? Book compares this to checking your blood pressure, but doing nothing with the information gained. There is also the issue of “difficulty in assessing procedural knowledge” versus “assessing declarative knowledge.” “…skills and processes are difficult to assess and performance assessments are very time consuming to administer and score accurately, are expensive and require more class time.”
  • #21 While SOME strides and improvements have been made, there are four main areas that are still missing or need consideration in order to close the gaps presented earlier.
  • #22 Let’s revisit our API index from 2007 that compares how students from different ethnic groups compared to the benchmark group comprised of white students. Poor white students scored just 33 points below that of the benchmark which was still much higher than those ethnic groups that scored below the benchmark. While the efforts of Title I strives to close the achievement gap by addressing the issue of being economically disadvantaged, the data from California shows that clearly “culture trumps poverty”. The issue that needs to be addressed is cultural needs rather than financial.
  • #23 Current efforts: Focused on poverty needs Focused on curriculum, instruction, and assessment, but never really asks the question of WHY are students struggling to reach the desired academic achievement. Once we ask ourselves WHY are students performing low, and we consider the data associated with academic achievement we can understand which how and what to apply to achieve the desired results.
  • #24 Another consideration is the fact that 70% of the world’s population is a collectivist culture. Current education system values individual performance, which is associated to Northern European-Americans. Collectivist Cultures are interdependent, value sharing and cooperation. Communication style is different as well. Where individualistic culture supports an education style that is about delivery of content, collectivist cultures require that relationships are built first before content can be meaningful.
  • #25 There may be some resistance to the idea of adapting education delivery so that it allows for those who are from a collectivist culture, however it is better to think of this as simply adding to the quality of education. The way education has been done has worked for a particular group. Adding a collaborative approach will only improve performance for ALL students. It is possible, as we have seen with our recent mid-term exam, groups were able to collaborate together to create a plan of action for presenting individual chapters, divide the workload, and then share that information with literary circles. Working in groups made the task of presenting among peers less daunting. Dr. Paciotti also created individual accountability in two ways. First, students had to identify which items were their own products while her observations of each group would also let her see which students prepared to present the entire content. So, when it comes to considering adapting education to include those who are more collectively inclined, we really can have our cake…and eat it, too.
  • #26 No Child Left Behind and Title I efforts have really been overly focused on reading and writing. Left out of the entire effort has been mathematics and science. Rest of the world is passing us by in these areas which are vital for creating new technologies that keep our nation at the forefront in many respects. Opportunity for interdisciplinary learning that involves collaboration and applies math, science, and technology in practical ways that allow for meaningful learning and sense making.