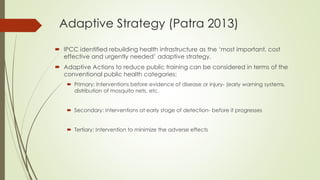
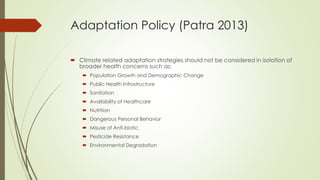
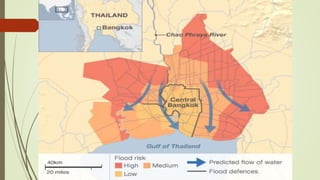
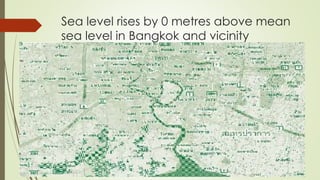
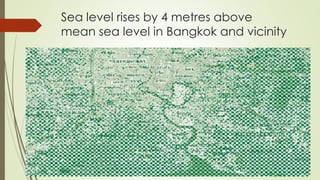
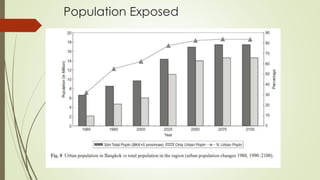
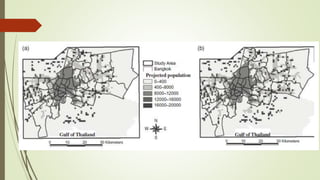
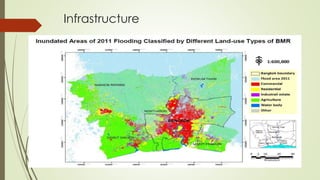
Emission Trading
Kyoto Protocol and the Carbon Trade
 ‘The Kyoto Protocol is an international agreement linked to the United Nations Framework
Convention on Climate Change, which commits its Parties by setting internationally binding
emission reduction targets’. UNFCCC
 The Kyoto Protocol treaty was negotiated in December 1997 at the city of Kyoto, Japan and
came into force February 16th, 2005.
 "The Kyoto Protocol is a legally binding agreement under which industrialized countries will
reduce their collective emissions of greenhouse gases by 5.2% compared to the year 1990 (but
note that, compared to the emissions levels that would be expected by 2010 without the
Protocol, this target represents a 29% cut). The goal is to lower overall emissions from six
greenhouse gases - carbon dioxide, methane, nitrous oxide, sulfur hexafluoride, HFCs, and PFCs
- calculated as an average over the five-year period of 2008-12.National targets range from 8%
reductions for the European Union and some others to 7% for the US, 6% for Japan, 0% for
Russia, and permitted increases of 8% for Australia and 10% for Iceland.“ UNEP
 Parties with commitments under the Kyoto Protocol have accepted targets for limiting or
reducing emissions.
 These targets are expressed as levels of allowed emissions, or “assigned amounts,” over the
2008-2012 commitment period.
 The allowed emissions are divided into “assigned amount units” (AAUs).
 Emissions trading, as set out in Article 17* of the Kyoto Protocol, allows countries that have
emission units to spare - emissions permitted them but not "used" - to sell this excess
capacity to countries that are over their targets.
 Thus, a new commodity was created in the form of emission reductions or removals.
 Since carbon dioxide is the principal greenhouse gas, people speak simply of trading in
carbon.
 Carbon is now tracked and traded like any other commodity. This is known as the "carbon
market."
What is emissions trading?
 Emission trading is a policy instrument aimed at managing greenhouse gas (GHG) emission.
This is part encourages operational excellence and provides incentives for use of new
technologies in place of the existing ones.
 How does it work?
 From the economic point of view, if there is insufficient incentives for firms and households
to reduce emissions and market is left to operate freely without control, greenhouse gas will
be excessive.
 As a result it is recommended that applying the polluter pay principle and placing a price in
carbon dioxide and other greenhouse gases.
 This can be implemented either through a carbon tax, also known as a price instrument or a
cap-and-trade scheme/ quantity instrument.
Emissions Trading Schemes
 Both schemes discussed in this presentation begin with the setting of emissions targets
for either various industries, or a nation/state as a whole.
 Carbon Tax
 Works just like any other tax – a percentage is added to every unit of carbon used
 E.g. The carbon tax is 15%. Price of gasoline is 110 cents/litre. 15% of 110 cents is 16.5
cents. Added to the initial price of gasoline, now the price is 126.5 cents/litre
 Acts as an incentive to emit less
 Cap-and-Trade
 A baseline amount of emissions, or “cap” is set. Emitters can produce greenhouse
gases up to this point.
 If an emitter does not emit to the “cap”, they can sell their leftover emissions to
another emitter, who has gone over the limit.
 Trading can occur in a variety of different forms, e.g. auctions, markets, etc.
Japan
 Japan made a commitment under the Kyoto Protocol to reduce its average annual
GHG emissions 6% below 1990 levels for 2008-2012.
 According to the preliminary statistics GHG emissions increased by 0.6% resulting in
an 8.1% increase over 1990s levels.
 In the July 2008 “Action Plan for Achieving a Low-carbon Society,” Japan introduced
possible GHG emission reduction goals.
 As part of the Copenhagen Accord, Japan pledged to reduce GHG emissions 25%
below 1990 levels by 2020.
 The country’s 2030 goal is to reduce CO2 from fossil fuels 30% below 1990 levels.
 In 2010, its GHG emissions (including LULUCF) of 1,208 million metric tons of
carbon dioxide equivalent (MMtCO2e) placed it fifth among the world’s countries.
 In December 2010, the Japanese Central Environmental Council confirmed that
Japan would commit to reducing its GHG emissions to 80% below 1990 levels by
2050.
Issues and Challenges
CHALLENGES:
 The deferral of a nation-wide ETS in December 2010 and the subsequent abandonment in November
2012, was quite influential.
 Japan’s climate targets were ambitious compared to those of other industrialized countries, but Japan’s
refusal to renew its Kyoto commitment may indicate that political interest in climate action is waning.
ISSUES:
 Mixed sentiment over the cap-and-trade in Japan.
 At the local level, the Tokyo government, the country’s largest sub-national governing body,
implemented an ETS with absolute, mandatory targets in April 2010.
 At the national level, Japanese Verified Emission Reduction (JVER) and the Experimental Integrated
Emission Trading Scheme (EI ETS) have built regulatory and infrastructural capacity for emissions trading.
 Despite these promising ETS actions, momentum towards a mandatory, nation-wide ETS with absolute
caps has stagnated since December 2010.
 The public backlash against nuclear power after the Fukushima power plant disaster Japan will have to
restructure its plans in order to meet its 2020 climate targets.
The Tokyo Cap-and-Trade Program
 The Tokyo Cap-and-Trade Program is the world's first urban cap-and-trade program
targeting urban facilities, including office buildings and commercial and industrial facilities.
 The mandatory emission reduction and emissions trading program was launched in April
2010.
 It covers approximately 1,400 large facilities that consume energy equivalent to 1,500
kiloliters of crude oil or more per year.
 It has an absolute cap of 6% for the first compliance period (FY2010–FY2014) and a 15%
cap (17% for existing buildings) for the second compliance period (FY2015–FY2019).
 Facilities can reduce emissions themselves or buy credits to meet their obligations.
 Facility owners are required to submit their reduction plans and emissions reports annually
and have them verified by third-party verification agencies registered with the Governor.
Initial Results
 The program started in April 2010, and so far it has been successful.
 In 2011, emissions had been reduced by 23 percent compared to the base-year.
 This is a further ten percent reduction from the first year in 2010, which showed a 13
percent reduction.
 The main factor behind this drop was significant electricity savings by the covered facilities.
 In the aftermath of the severe earthquake in East Japan in March 2011, Tokyo faced a major
power crisis following the Fukushima nuclear power plant accident.
 This prompted the business to quickly and effectively take measures to save electricity.
 This program also pioneered an effective approach to cooperation between owners and
tenants in multi-tenant buildings.
Pros and Cons of Emission Trading
 Disadvantages of Emission Trading
 The complicated system of law, additional regulations means more work is required by
companies to follow regulations
 Low emissions companies will have little incentive to lower their current emissions. Selling their cap
room would provide some income but likely will not cause them to be cleaner.
 High emission companies could potentially go to higher emissions with only minor incentives to
reduce emission. As a result, the total emission could actually go up as the big polluters just buy
more pollution space.
 With a cumbersome emission regulation systems, cheating could be rampant as income tax
evasion and fraud as in the USA. It requires a lot of police to enforce.
 Advantages
 Economic driver of emission reduction
 Trading pollution cap space could make environmentally friendly in terms of carbon emission only
 It create incentives to be clean rather than fine for pollution.
Conclusion/Discussion/Way forward
 Since emissions trading systems are relatively new, we do not have much
information on how it has impacted climate change
 However, we have noticed reductions in emissions!
 There are still a number of difficulties with implementing the systems, and
ensuring that they run efficiently
 There is no “one-size-fits-all” system – different situations require different
goals/infrastructure/implementation
 It is just one of many effective ways to reduce emissions, but there is much
more to be done
Climate Change and
Public Health
CC and Health: Key Facts
(WHO 2014)
 Climate change affects the social and environmental determinants of health –
clean air, safe drinking water, sufficient food and secure shelter.
 Between 2030 and 2050, climate change is expected to cause approximately
250 000 additional deaths per year, from malnutrition, malaria, diarrhoea and
heat stress.
 The direct damage costs to health (i.e. excluding costs in health-determining
sectors such as agriculture and water and sanitation), is estimated to be
between US$ 2-4 billion/year by 2030.
 Areas with weak health infrastructure – mostly in developing countries – will be
the least able to cope without assistance to prepare and respond.
 Reducing emissions of greenhouse gases through better transport, food and
energy-use choices can result in improved health, particularly through reduced
air pollution.
IPCC WG2: Impacts, Adaptation and Vulnerability
 ‘…..the level of health in a population reflects the quality of social and
natural environments, material standards of living, and the robustness of the
public health and health service infrastructure. Therefore, population health
is an important integrating index of the effects of climate change on
ecosystems, biological processes, physical environmental media, and the
social-economic environment.’
(WHO SEAR 2007)
Predominant Climate Change Impact
 heat stress/heat waves,
 storms,
 floods and flash floods
 droughts;
 Human Health Implications
 water- and food-borne diseases (e.g. cholera and other diarrhoeal
diseases)
 vector-borne diseases (e.g. dengue and malaria);
 respiratory diseases due to air pollution;
 aeroallergens, food and water security issues;
 malnutrition;
 psychosocial concerns from displacement.
… the IPCC urges a drastic reduction in GHG emissions to mitigate global
warming and an urgent implementation of adaptation measures.
 With a rise in surface temperature and changes in rainfall patterns, the distribution of vectors
such as mosquito species may change (Patz and Martens, 1996; Reiter, 1998).
 The changing temperatures and precipitation could also expand the vector-borne diseases
into temperate and arid Asia.
 The spread of vector-borne diseases into more northern latitudes may pose a serious threat to
human health.
 The epidemic areas of vector-borne diseases would depend on many demographic and
societal factors, as well as environmental hygiene for vector control, available health
infrastructure, and medical facilities.
(IPCC W2, Chapter 9).
Vector-borne diseases: Malaria and Dengue
Malaria still is one of the most important Vector–borne diseases in
India, Bangladesh, Sri Lanka, Thailand, Malaysia, Cambodia, the Lao
People‘s Democratic Republic, Viet Nam, Indonesia, Papua New Guinea
and parts of China.
The IPCC concluded that changes in environmental temperature and
precipitation could expand the geographical range of malaria in the
temperate and arid parts of Asia.
Water-borne diseases such as cholera, and various diarrhoeal diseases
such as giardiasis, salmonellosis and cryptosporidios is, occur commonly
with contamination of drinking water in many south Asian countries.
These diseases could become more frequent in many parts of south Asia
in a warmer climate.
Adaptive Strategy (Patra 2013)
 IPCC identified rebuilding health infrastructure as the ‘most important, cost
effective and urgently needed’ adaptive strategy.
 Adaptive Actions to reduce public training can be considered in terms of the
conventional public health categories:
 Primary: Interventions before evidence of disease or injury- (early warning systems,
distribution of mosquito nets, etc.
 Secondary: Interventions at early stage of detection- before it progresses
 Tertiary: Intervention to minimize the adverse effects
Adaptation Policy (Patra 2013)
 Climate related adaptation strategies should not be considered in isolation of
broader health concerns such as:
 Population Growth and Demographic Change
 Public Health Infrastructure
 Sanitation
 Availability of Healthcare
 Nutrition
 Dangerous Personal Behavior
 Misuse of Anti-biotic
 Pesticide Resistance
 Environmental Degradation
Megacity Bangkok, Thailand
 Bangkok ranks 7th on the top 10 cities in terms of population exposure
(including all environmental and socio-economic factors) and
 10th in terms of the assets exposed to coastal flooding among cities around
the world as a result of climate change and subsidence (OECD, 2007).
 Rapid urbanization converted long-exiting watercourses (canal, ditches,
ponds) to roads, buildings and other structures.
 Approximately 900,000 people in Bangkok are currently at risk from flood
events, and that number would increase to more than 5 million by 2070
Sea level rises by 0 metres above mean
sea level in Bangkok and vicinity
Sea level rises by 2 metres above mean sea
level in Bangkok and vicinity
Sea level rises by 4 metres above
mean sea level in Bangkok and vicinity
Population Exposed
Infrastructure

Presentation1

  • 1.
  • 2.
    Kyoto Protocol andthe Carbon Trade  ‘The Kyoto Protocol is an international agreement linked to the United Nations Framework Convention on Climate Change, which commits its Parties by setting internationally binding emission reduction targets’. UNFCCC  The Kyoto Protocol treaty was negotiated in December 1997 at the city of Kyoto, Japan and came into force February 16th, 2005.  "The Kyoto Protocol is a legally binding agreement under which industrialized countries will reduce their collective emissions of greenhouse gases by 5.2% compared to the year 1990 (but note that, compared to the emissions levels that would be expected by 2010 without the Protocol, this target represents a 29% cut). The goal is to lower overall emissions from six greenhouse gases - carbon dioxide, methane, nitrous oxide, sulfur hexafluoride, HFCs, and PFCs - calculated as an average over the five-year period of 2008-12.National targets range from 8% reductions for the European Union and some others to 7% for the US, 6% for Japan, 0% for Russia, and permitted increases of 8% for Australia and 10% for Iceland.“ UNEP
  • 3.
     Parties withcommitments under the Kyoto Protocol have accepted targets for limiting or reducing emissions.  These targets are expressed as levels of allowed emissions, or “assigned amounts,” over the 2008-2012 commitment period.  The allowed emissions are divided into “assigned amount units” (AAUs).  Emissions trading, as set out in Article 17* of the Kyoto Protocol, allows countries that have emission units to spare - emissions permitted them but not "used" - to sell this excess capacity to countries that are over their targets.  Thus, a new commodity was created in the form of emission reductions or removals.  Since carbon dioxide is the principal greenhouse gas, people speak simply of trading in carbon.  Carbon is now tracked and traded like any other commodity. This is known as the "carbon market."
  • 4.
    What is emissionstrading?  Emission trading is a policy instrument aimed at managing greenhouse gas (GHG) emission. This is part encourages operational excellence and provides incentives for use of new technologies in place of the existing ones.  How does it work?  From the economic point of view, if there is insufficient incentives for firms and households to reduce emissions and market is left to operate freely without control, greenhouse gas will be excessive.  As a result it is recommended that applying the polluter pay principle and placing a price in carbon dioxide and other greenhouse gases.  This can be implemented either through a carbon tax, also known as a price instrument or a cap-and-trade scheme/ quantity instrument.
  • 5.
    Emissions Trading Schemes Both schemes discussed in this presentation begin with the setting of emissions targets for either various industries, or a nation/state as a whole.  Carbon Tax  Works just like any other tax – a percentage is added to every unit of carbon used  E.g. The carbon tax is 15%. Price of gasoline is 110 cents/litre. 15% of 110 cents is 16.5 cents. Added to the initial price of gasoline, now the price is 126.5 cents/litre  Acts as an incentive to emit less  Cap-and-Trade  A baseline amount of emissions, or “cap” is set. Emitters can produce greenhouse gases up to this point.  If an emitter does not emit to the “cap”, they can sell their leftover emissions to another emitter, who has gone over the limit.  Trading can occur in a variety of different forms, e.g. auctions, markets, etc.
  • 6.
    Japan  Japan madea commitment under the Kyoto Protocol to reduce its average annual GHG emissions 6% below 1990 levels for 2008-2012.  According to the preliminary statistics GHG emissions increased by 0.6% resulting in an 8.1% increase over 1990s levels.  In the July 2008 “Action Plan for Achieving a Low-carbon Society,” Japan introduced possible GHG emission reduction goals.  As part of the Copenhagen Accord, Japan pledged to reduce GHG emissions 25% below 1990 levels by 2020.  The country’s 2030 goal is to reduce CO2 from fossil fuels 30% below 1990 levels.  In 2010, its GHG emissions (including LULUCF) of 1,208 million metric tons of carbon dioxide equivalent (MMtCO2e) placed it fifth among the world’s countries.  In December 2010, the Japanese Central Environmental Council confirmed that Japan would commit to reducing its GHG emissions to 80% below 1990 levels by 2050.
  • 10.
    Issues and Challenges CHALLENGES: The deferral of a nation-wide ETS in December 2010 and the subsequent abandonment in November 2012, was quite influential.  Japan’s climate targets were ambitious compared to those of other industrialized countries, but Japan’s refusal to renew its Kyoto commitment may indicate that political interest in climate action is waning. ISSUES:  Mixed sentiment over the cap-and-trade in Japan.  At the local level, the Tokyo government, the country’s largest sub-national governing body, implemented an ETS with absolute, mandatory targets in April 2010.  At the national level, Japanese Verified Emission Reduction (JVER) and the Experimental Integrated Emission Trading Scheme (EI ETS) have built regulatory and infrastructural capacity for emissions trading.  Despite these promising ETS actions, momentum towards a mandatory, nation-wide ETS with absolute caps has stagnated since December 2010.  The public backlash against nuclear power after the Fukushima power plant disaster Japan will have to restructure its plans in order to meet its 2020 climate targets.
  • 11.
    The Tokyo Cap-and-TradeProgram  The Tokyo Cap-and-Trade Program is the world's first urban cap-and-trade program targeting urban facilities, including office buildings and commercial and industrial facilities.  The mandatory emission reduction and emissions trading program was launched in April 2010.  It covers approximately 1,400 large facilities that consume energy equivalent to 1,500 kiloliters of crude oil or more per year.  It has an absolute cap of 6% for the first compliance period (FY2010–FY2014) and a 15% cap (17% for existing buildings) for the second compliance period (FY2015–FY2019).  Facilities can reduce emissions themselves or buy credits to meet their obligations.  Facility owners are required to submit their reduction plans and emissions reports annually and have them verified by third-party verification agencies registered with the Governor.
  • 12.
    Initial Results  Theprogram started in April 2010, and so far it has been successful.  In 2011, emissions had been reduced by 23 percent compared to the base-year.  This is a further ten percent reduction from the first year in 2010, which showed a 13 percent reduction.  The main factor behind this drop was significant electricity savings by the covered facilities.  In the aftermath of the severe earthquake in East Japan in March 2011, Tokyo faced a major power crisis following the Fukushima nuclear power plant accident.  This prompted the business to quickly and effectively take measures to save electricity.  This program also pioneered an effective approach to cooperation between owners and tenants in multi-tenant buildings.
  • 13.
    Pros and Consof Emission Trading  Disadvantages of Emission Trading  The complicated system of law, additional regulations means more work is required by companies to follow regulations  Low emissions companies will have little incentive to lower their current emissions. Selling their cap room would provide some income but likely will not cause them to be cleaner.  High emission companies could potentially go to higher emissions with only minor incentives to reduce emission. As a result, the total emission could actually go up as the big polluters just buy more pollution space.  With a cumbersome emission regulation systems, cheating could be rampant as income tax evasion and fraud as in the USA. It requires a lot of police to enforce.  Advantages  Economic driver of emission reduction  Trading pollution cap space could make environmentally friendly in terms of carbon emission only  It create incentives to be clean rather than fine for pollution.
  • 14.
    Conclusion/Discussion/Way forward  Sinceemissions trading systems are relatively new, we do not have much information on how it has impacted climate change  However, we have noticed reductions in emissions!  There are still a number of difficulties with implementing the systems, and ensuring that they run efficiently  There is no “one-size-fits-all” system – different situations require different goals/infrastructure/implementation  It is just one of many effective ways to reduce emissions, but there is much more to be done
  • 15.
  • 16.
    CC and Health:Key Facts (WHO 2014)  Climate change affects the social and environmental determinants of health – clean air, safe drinking water, sufficient food and secure shelter.  Between 2030 and 2050, climate change is expected to cause approximately 250 000 additional deaths per year, from malnutrition, malaria, diarrhoea and heat stress.  The direct damage costs to health (i.e. excluding costs in health-determining sectors such as agriculture and water and sanitation), is estimated to be between US$ 2-4 billion/year by 2030.  Areas with weak health infrastructure – mostly in developing countries – will be the least able to cope without assistance to prepare and respond.  Reducing emissions of greenhouse gases through better transport, food and energy-use choices can result in improved health, particularly through reduced air pollution.
  • 17.
    IPCC WG2: Impacts,Adaptation and Vulnerability  ‘…..the level of health in a population reflects the quality of social and natural environments, material standards of living, and the robustness of the public health and health service infrastructure. Therefore, population health is an important integrating index of the effects of climate change on ecosystems, biological processes, physical environmental media, and the social-economic environment.’
  • 18.
    (WHO SEAR 2007) PredominantClimate Change Impact  heat stress/heat waves,  storms,  floods and flash floods  droughts;  Human Health Implications  water- and food-borne diseases (e.g. cholera and other diarrhoeal diseases)  vector-borne diseases (e.g. dengue and malaria);  respiratory diseases due to air pollution;  aeroallergens, food and water security issues;  malnutrition;  psychosocial concerns from displacement. … the IPCC urges a drastic reduction in GHG emissions to mitigate global warming and an urgent implementation of adaptation measures.
  • 19.
     With arise in surface temperature and changes in rainfall patterns, the distribution of vectors such as mosquito species may change (Patz and Martens, 1996; Reiter, 1998).  The changing temperatures and precipitation could also expand the vector-borne diseases into temperate and arid Asia.  The spread of vector-borne diseases into more northern latitudes may pose a serious threat to human health.  The epidemic areas of vector-borne diseases would depend on many demographic and societal factors, as well as environmental hygiene for vector control, available health infrastructure, and medical facilities. (IPCC W2, Chapter 9).
  • 20.
    Vector-borne diseases: Malariaand Dengue Malaria still is one of the most important Vector–borne diseases in India, Bangladesh, Sri Lanka, Thailand, Malaysia, Cambodia, the Lao People‘s Democratic Republic, Viet Nam, Indonesia, Papua New Guinea and parts of China. The IPCC concluded that changes in environmental temperature and precipitation could expand the geographical range of malaria in the temperate and arid parts of Asia. Water-borne diseases such as cholera, and various diarrhoeal diseases such as giardiasis, salmonellosis and cryptosporidios is, occur commonly with contamination of drinking water in many south Asian countries. These diseases could become more frequent in many parts of south Asia in a warmer climate.
  • 23.
    Adaptive Strategy (Patra2013)  IPCC identified rebuilding health infrastructure as the ‘most important, cost effective and urgently needed’ adaptive strategy.  Adaptive Actions to reduce public training can be considered in terms of the conventional public health categories:  Primary: Interventions before evidence of disease or injury- (early warning systems, distribution of mosquito nets, etc.  Secondary: Interventions at early stage of detection- before it progresses  Tertiary: Intervention to minimize the adverse effects
  • 24.
    Adaptation Policy (Patra2013)  Climate related adaptation strategies should not be considered in isolation of broader health concerns such as:  Population Growth and Demographic Change  Public Health Infrastructure  Sanitation  Availability of Healthcare  Nutrition  Dangerous Personal Behavior  Misuse of Anti-biotic  Pesticide Resistance  Environmental Degradation
  • 28.
    Megacity Bangkok, Thailand Bangkok ranks 7th on the top 10 cities in terms of population exposure (including all environmental and socio-economic factors) and  10th in terms of the assets exposed to coastal flooding among cities around the world as a result of climate change and subsidence (OECD, 2007).  Rapid urbanization converted long-exiting watercourses (canal, ditches, ponds) to roads, buildings and other structures.  Approximately 900,000 people in Bangkok are currently at risk from flood events, and that number would increase to more than 5 million by 2070
  • 29.
    Sea level risesby 0 metres above mean sea level in Bangkok and vicinity
  • 30.
    Sea level risesby 2 metres above mean sea level in Bangkok and vicinity
  • 31.
    Sea level risesby 4 metres above mean sea level in Bangkok and vicinity
  • 32.
  • 34.

Editor's Notes

  • #3 Javeria
  • #4 Javeria
  • #5 Emissions trading – Vicky Cap and Trade/ Carbon – Sunday
  • #14 Pros and Cons – Sunday
  • #15 Conclusion – Vicky (comes after group discussion) Group discussion countries: Australia, China, Russia – Javeria