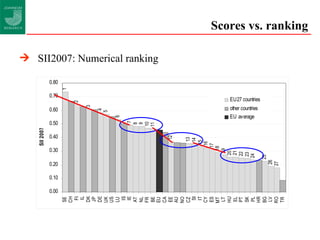
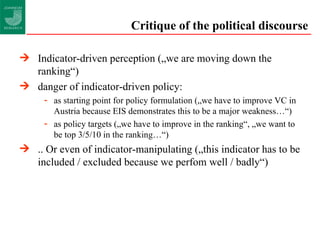
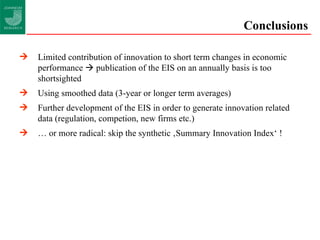
The document provides a critical assessment of the European Innovation Scoreboard (EIS) which is used to evaluate and compare the innovation performance of EU member states. It notes methodological issues with the EIS such as the selection and weighting of indicators, data availability and quality. It also critiques how countries' perceive and discuss their innovation performance based solely on EIS rankings, which can lead to indicator-driven rather than evidence-based policymaking. The document concludes the EIS has limitations and a different approach should be taken in its use for policy discussions.
![The use of indicators in innovation policy debate - a critical assessment of the European Innovation Scoreboard (EIS) Wolfgang Polt Joanneum Research [email_address] Conference on Patent Statistics for Decision Makers Vienna, 3-4 September 2008 Based on: Schibany, Streicher, Gassler: The European Innvoation Scoreboard: the advantages and disadvantages of indicator-driven country rankings (in German). Joanneum Research Working Papers 65-2007, Vienna, October 2007](https://image.slidesharecdn.com/presentationpoltpatentconference392008-12768950784887-phpapp02/85/Presentation-Polt-Patent-Conference-3-9-2008-1-320.jpg)
![The use of indicators in innovation policy debate - a critical assessment of the European Innovation Scoreboard (EIS) Wolfgang Polt Joanneum Research [email_address] Conference on Patent Statistics for Decision Makers Vienna, 3-4 September 2008 Based on: Schibany, Streicher, Gassler: The European Innvoation Scoreboard: the advantages and disadvantages of indicator-driven country rankings (in German). Joanneum Research Working Papers 65-2007, Vienna, October 2007](https://image.slidesharecdn.com/presentationpoltpatentconference392008-12768950784887-phpapp02/75/Presentation-Polt-Patent-Conference-3-9-2008-1-2048.jpg)
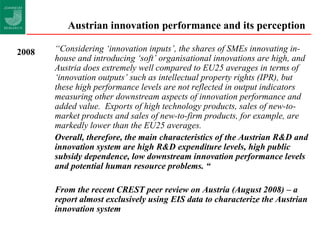
![Conclusions No ideal ‚catch-all‘ indicator for science or innovation has been developed so far [ – nor could be developed ! ] There is still a lack of clear theoretical models to guide selection and weighting of indicators. Room exists for manipulation by selection, weighting and aggregating indicators. As NIS differ form each other, good policy making in one country may be poor policy making in another one. By relying on composite indicators the structure and the ‚revealed‘ comparative advantage of the countries remain hidden.](https://image.slidesharecdn.com/presentationpoltpatentconference392008-12768950784887-phpapp02/85/Presentation-Polt-Patent-Conference-3-9-2008-16-320.jpg)


![[1999][r&d][eee extended engineeringenterprise]](https://cdn.slidesharecdn.com/ss_thumbnails/1999rdeeeextendedengineeringenterprise-130323071819-phpapp02-thumbnail.jpg?width=640&height=640&fit=bounds)


