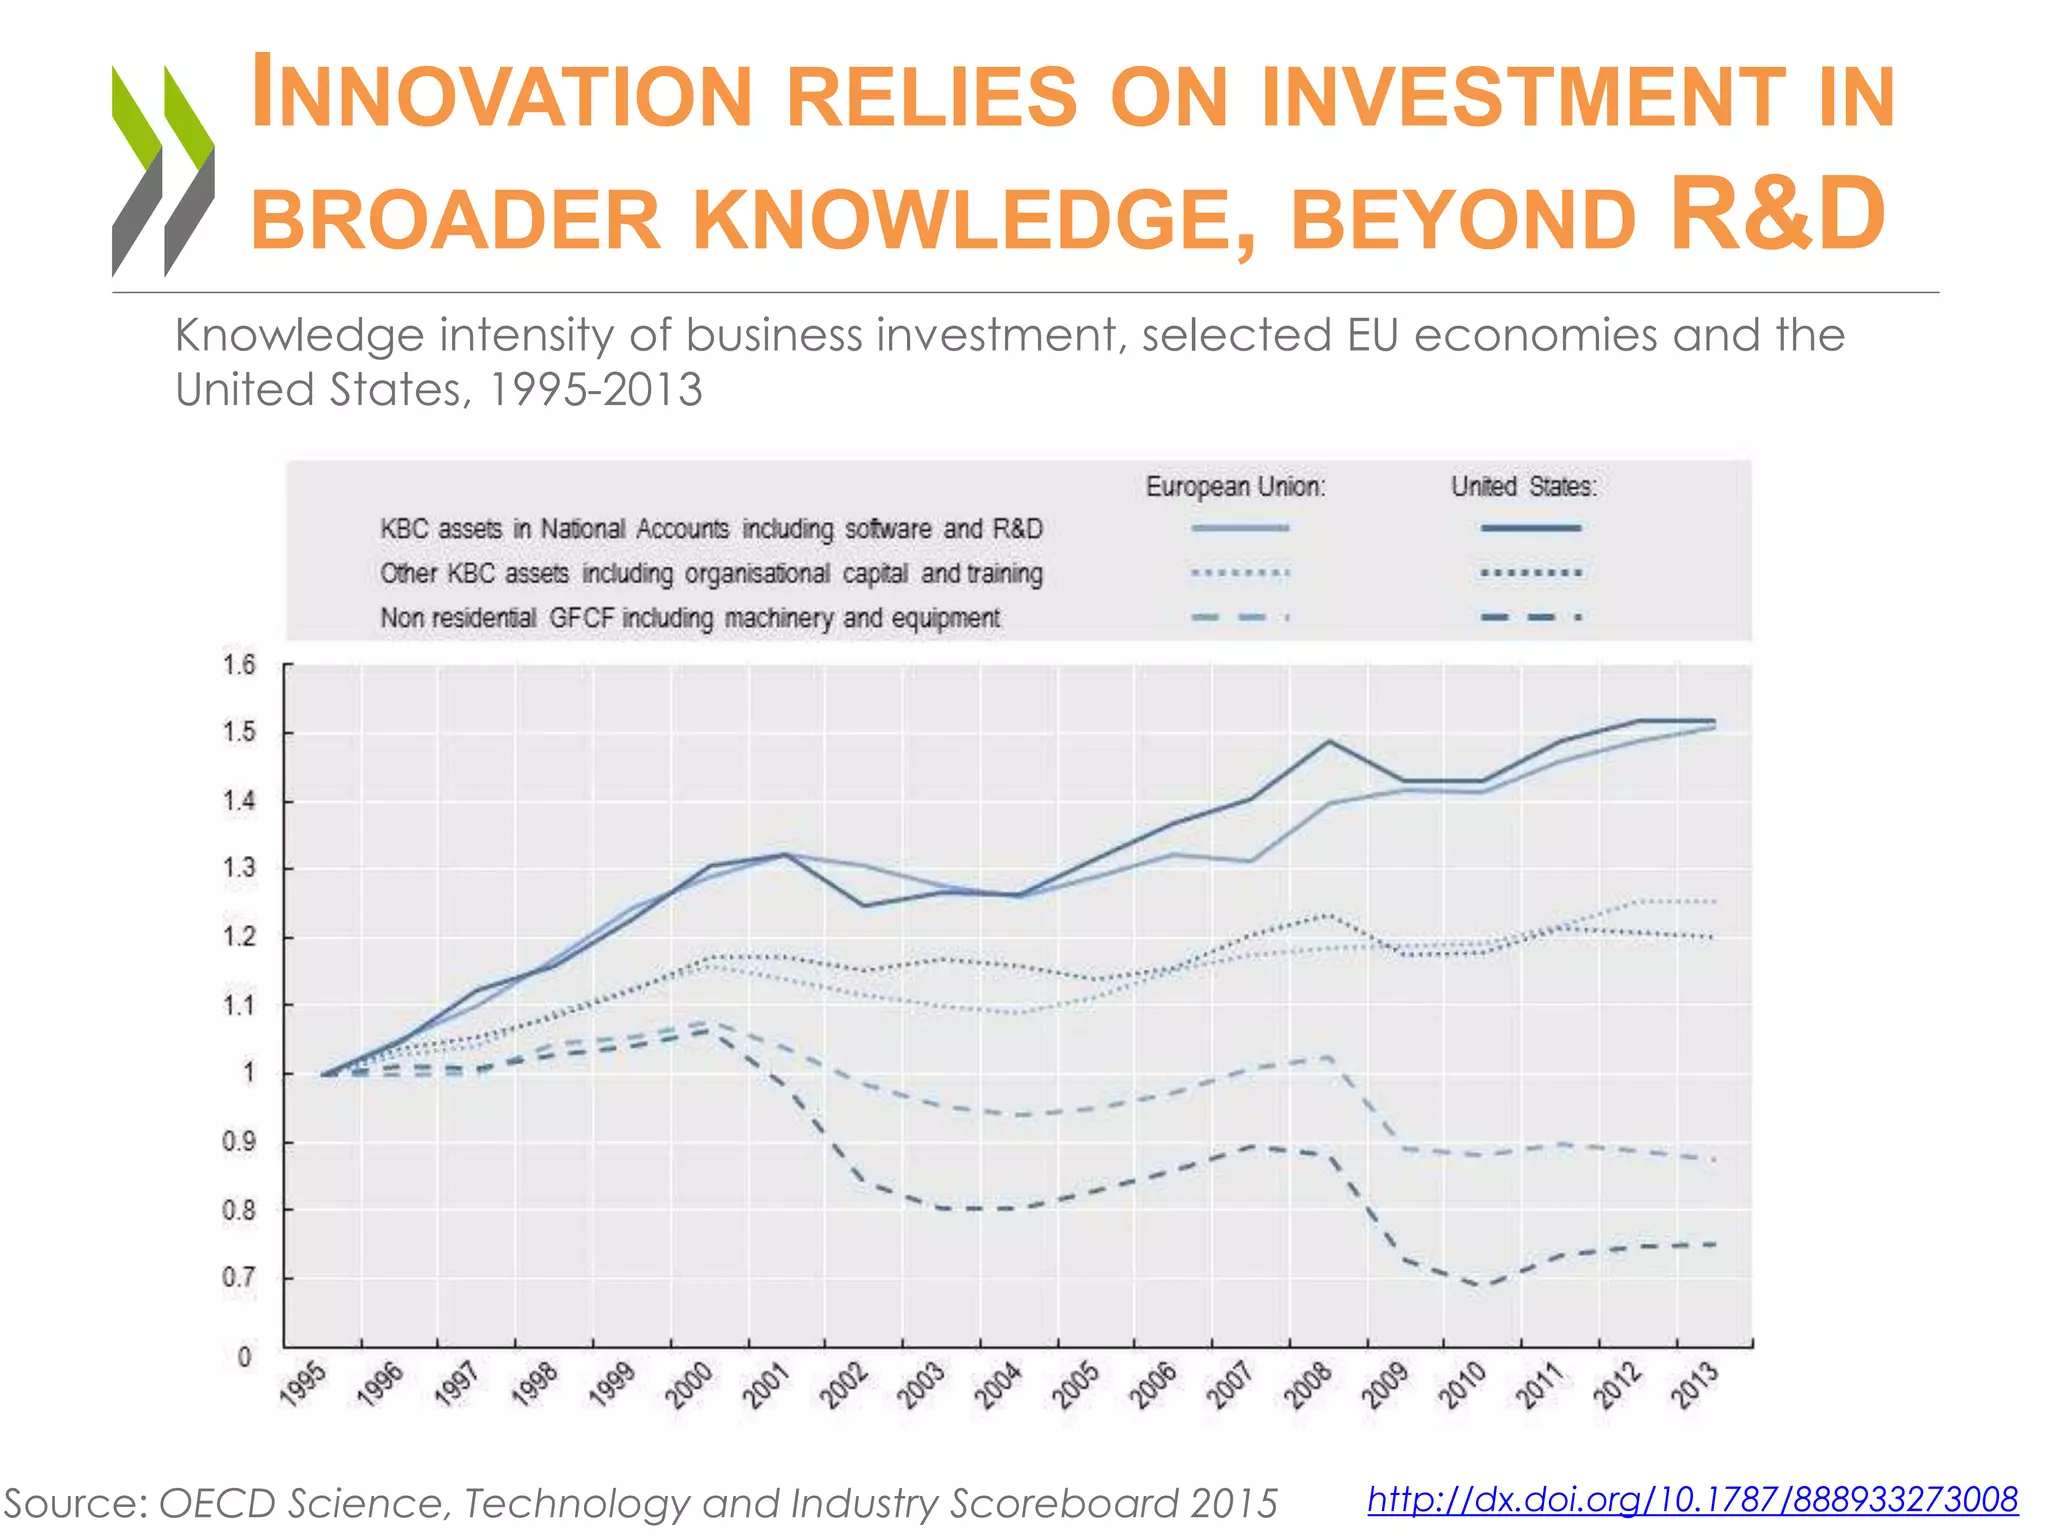
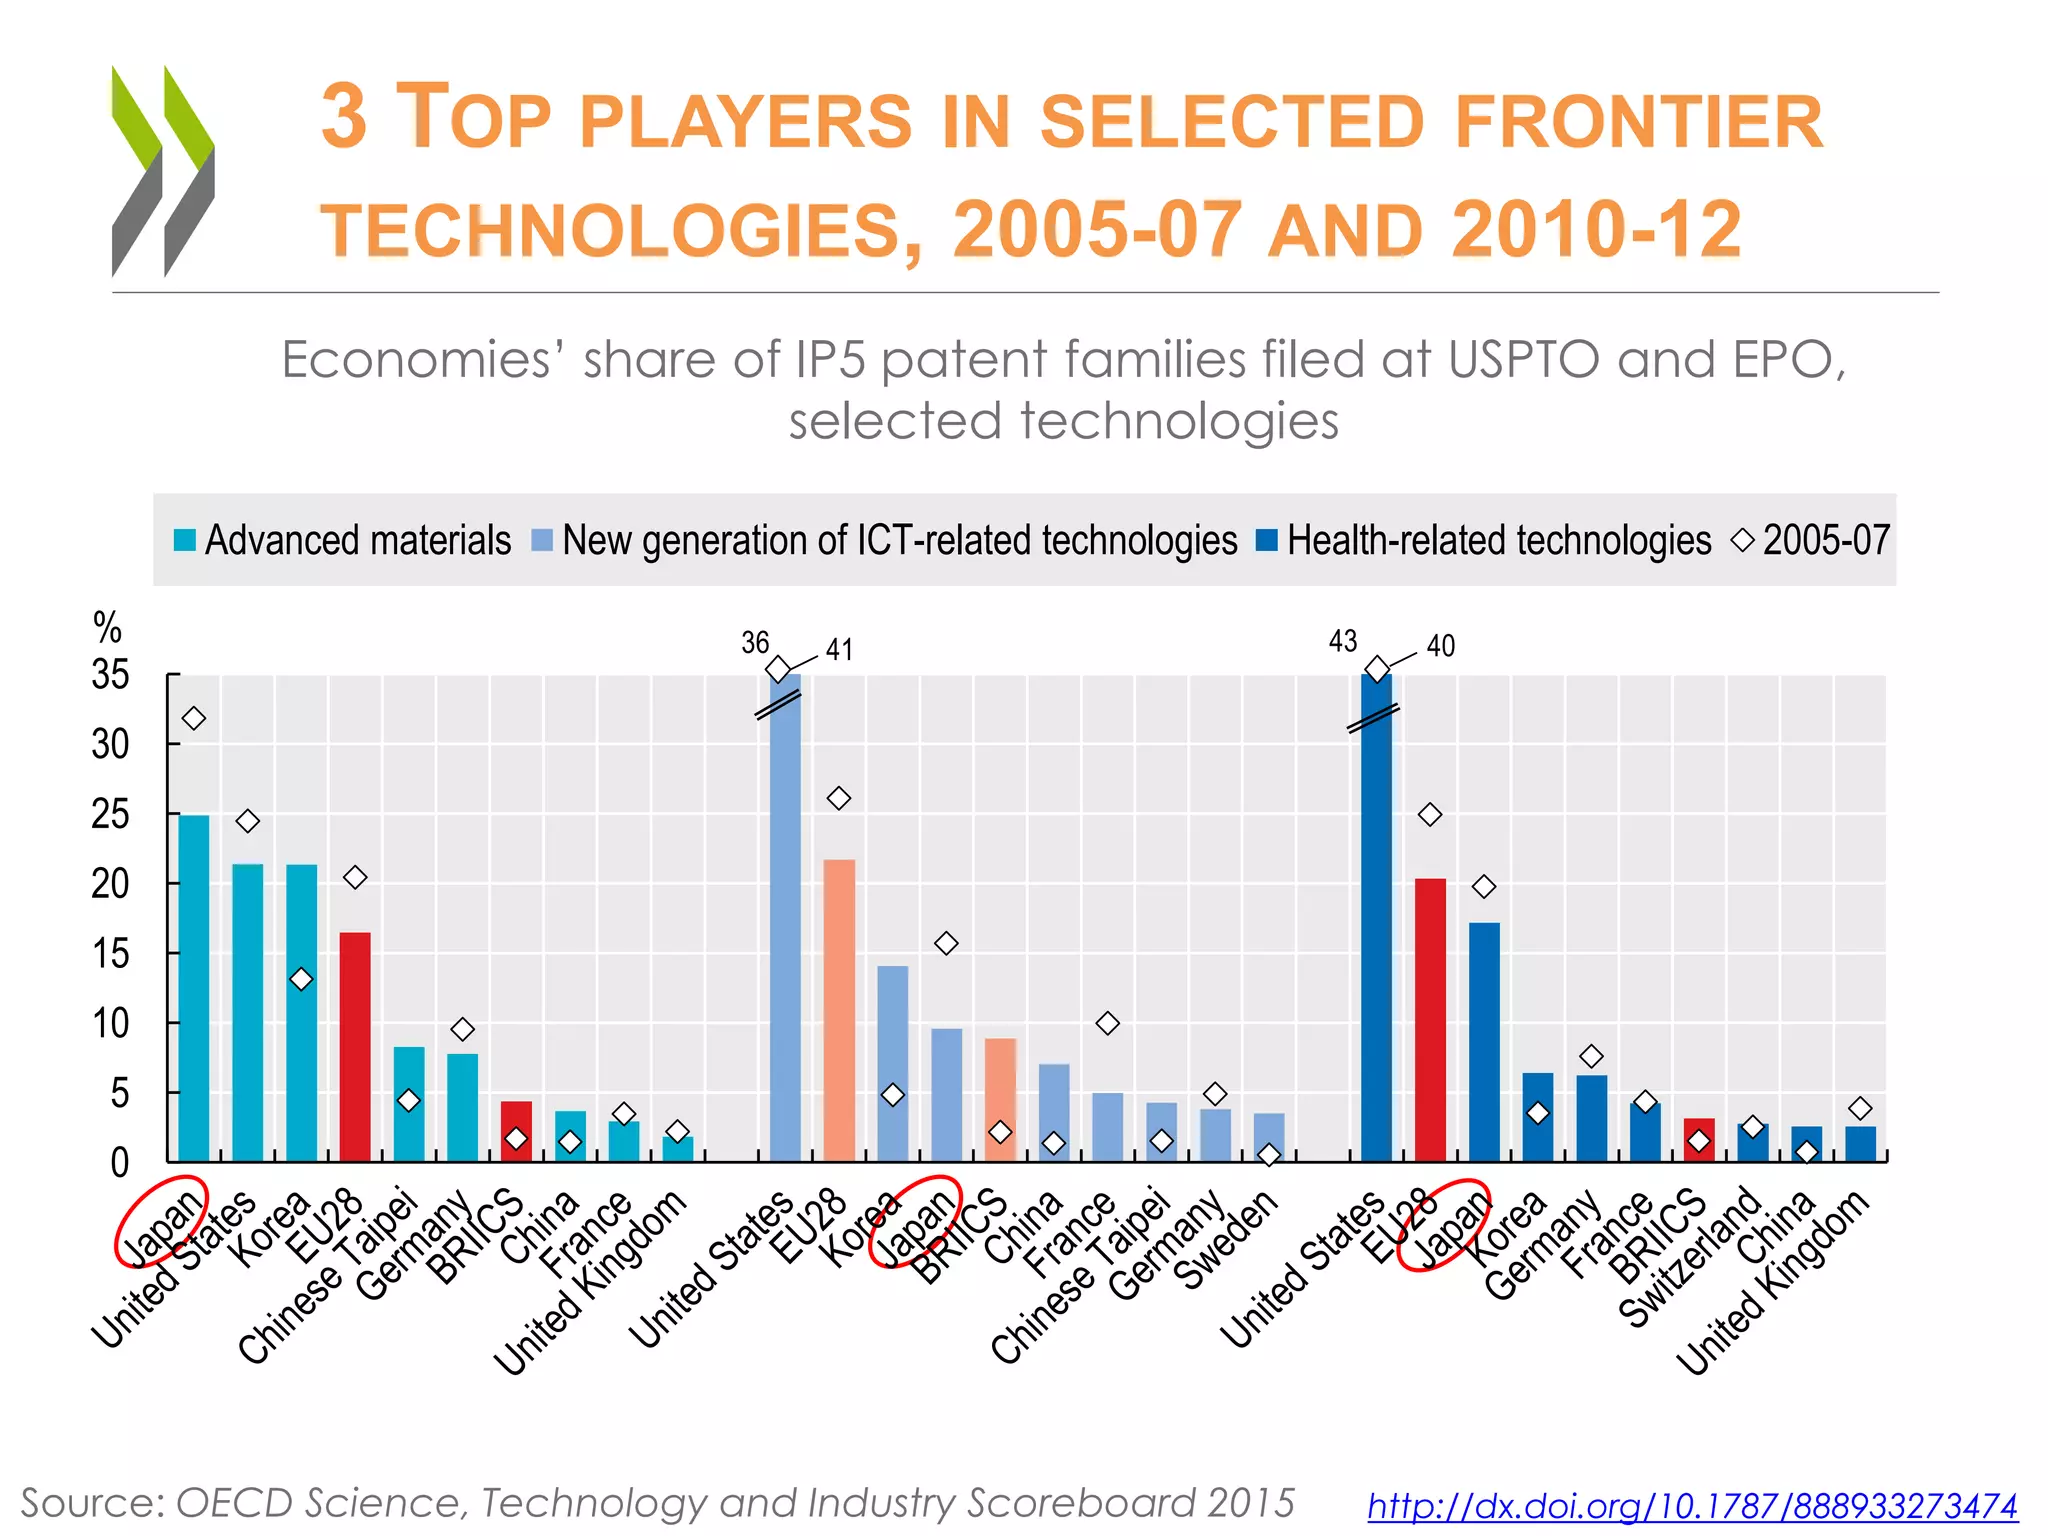
STI SCOREBOARD 2015
INNOVATION FOR GROWTH
AND SOCIETY
JAPAN HIGHLIGHTS
Andrew Wyckoff, Director
OECD Directorate for Science, Technology and Innovation
26 October 2015
National Graduate Institute for Policy
Studies (GRIPS)
Tokyo, Japan
The productivity challenge
and the falling working-age
population make innovation
today’s imperative
THE PRODUCTIVITY CHALLENGE
Labour productivity growth based on hours worked,
total economy level, 2001-14
http://dx.doi.org/10.1787/888933272766Source: OECD Science, Technology and Industry Scoreboard 2015.
LIVING STANDARDS IN JAPAN ARE WELL
BELOW THE TOP HALF OF THE OECD
Source: OECD Economic Survey Japan, April 2015 http://dx.doi.org/10.1787/888933201725
INNOVATION RELIES ON INVESTMENT IN
BROADER KNOWLEDGE, BEYOND R&D
Knowledge intensity of business investment, selected EU economies and the
United States, 1995-2013
Source: OECD Science, Technology and Industry Scoreboard 2015 http://dx.doi.org/10.1787/888933273008
Frontier technologies and
data-driven applications are
needed to provide solutions
to global challenges
3 TOP PLAYERS IN SELECTED FRONTIER
TECHNOLOGIES, 2005-07 AND 2010-12
Economies’ share of IP5 patent families filed at USPTO and EPO,
selected technologies
Source: OECD Science, Technology and Industry Scoreboard 2015
0
5
10
15
20
25
30
35
%
Advanced materials New generation of ICT-related technologies Health-related technologies 2005-07
4336 41 40
http://dx.doi.org/10.1787/888933273474
The research mix: R.
versus D. matters and so
does government
support for long-term,
higher-risk research to
help tackle global
challenges
R&D GROWTH OVER THE BUSINESS
CYCLE
Annual real percentage growth rate of R&D, 2008-14
-8
-4
0
4
8
12
%
Government R&D budgets GDP
Government-financed R&D expenditures Business-financed R&D expenditures
-8
-4
0
4
8
12
%
Government R&D budgets GDP
Government-financed R&D expenditures Business-financed R&D expenditures
-8
-4
0
4
8
12
%
Government R&D budgets GDP
Government-financed R&D expenditures Business-financed R&D expenditures
Source: OECD Science, Technology and Industry Scoreboard 2015 http://dx.doi.org/10.1787/888933273253
GOVERNMENT BUDGETS FOR R&D: A
DIVERSIFIED PICTURE
G7 and Korea, Index 2008 = 100
Source: OECD Research and Development Database, July 2015. www.oecd.org/sti/rds
Research excellence and
frontier innovation are
fairly concentrated across
countries, institutions and
businesses
R&D IN
OECD AND
KEY
PARTNER
COUNTRIES,
2013
USA
CHN
JPN
DEU
KOR
FRA
IND
GBR
RUS
BRA
ITA
CAN
AUS
ESP
SWE
NLD
TUR
CHE
AUT
ISR
BEL
MEX
POL
DNK
FIN
CZE
NOR
ZAF
PRT
IRL
HUN
GRC NZL
IDN
SVN
CHL
SVK LUX
ISL
EST
0.0
2.0
4.0
6.0
8.0
10.0
12.0
14.0
16.0
18.0
0.0 0.5 1.0 1.5 2.0 2.5 3.0 3.5 4.0 4.5
Gross domestic expenditures on
R&D as a percentage of GDP
Researchers, per thousand employment
R&D expenditures in 2010
USD - constant prices and PPP
1 billion
10 billion
100 billion
BRIICS
North America
EU
Other OECD members
Source: OECD Science, Technology and Industry Scoreboard 2015
http://dx.doi.org/10.1787/888933273287
Cumulative percentage shares within the top 2000 R&D companies
TOP 250 R&D COMPANIES ACCOUNT FOR
OVER 60% OF GLOBAL BUSINESS R&D, 2012
About 25% of the TOP
100 R&D corporations
are located in Japan
Source: OECD Science, Technology and Industry Scoreboard 2015 http://dx.doi.org/10.1787/888933273408
4 PLAYERS IN 50-70% OF HIGH-IMPACT
SCIENCE ACROSS ALL DISCIPLINES
Top 4 countries with the largest number of 10% top-cited publications, by field,
as % of all top-cited publications by authors in OECD and BRIICS countries,
2003-12
0
20
40
60
80
100
%
USA GBR CHN DEU BRA CAN ESP AUS FRA IND JPN OTH
Source: OECD Science, Technology and Industry Scoreboard 2015 http://dx.doi.org/10.1787/888933273312
STRENGTHENING INNOVATION
AND COMPETITIVENESS: 5
PILLARS
KNOWLEDGE, TALENT & SKILLS
KNOWLEDGE DIFFUSION
COMPETITIVENESS
INNOVATION IN FIRMS
SOCIETY
INVESTING IN WORKERS SKILLS: TRAINING
Investment as a percentage of gross value added by type of training
Estimating Cross-Country Investment in Training, STI WP 9, 2015
KNOWLEDGE ASSETS IN FIRMS
Source: OECD Science, Technology and Industry Scoreboard 2015
75 69 75 6566 77 70 5662 51 46 34
0
1
2
3
4
5
6
7
8
9
10
DNK AUS NLD GBR CAN FIN USA DEU KOR JPN FRA ITA
%
Formal only On-the-job only Formal and on-the-job
Percentage of total employed persons receiving
training
http://dx.doi.org/10.1787/888933273718
THE PREMIUM FROM SCIENTIFIC COLLABORATION
The citation impact of scientific production and the extent of international
collaboration, 2003-12
RESEARCH CAPABILITIES
Source: OECD Science, Technology and Industry Scoreboard 2015 http://dx.doi.org/10.1787/888933273878
INTERNATIONAL MOBILITY OF SCIENTIFIC AUTHORS
Difference between annual inflows and outflows of scientific authors, as
percentage of cumulative net flows , selected economies,1999-2013
Source: OECD Science, Technology and Industry Scoreboard 2015.
RESEARCH CAPABILITIES
http://dx.doi.org/10.1787/888933273360
WOMEN IN SCIENCE
Female scientific authors in selected fields, by country, 2011, As a
percentage of corresponding authors, estimated shares
RESEARCH CAPABILITIES
Source: OECD Science, Technology and Industry Scoreboard 2015. http://dx.doi.org/10.1787/888933273335
FIRMS TAPPING INTO INTERNATIONAL COLLABORATION
NETWORKS
Source: OECD Science, Technology and Industry Scoreboard 2015
Firms engaged in international collaboration by firm size, 2010-12, as a
percentage of product and/or process innovative firms in each size category
INNOVATION IN FIRMS
0
10
20
30
40
50
60
70
%
Large firms SMEs
http://dx.doi.org/10.1787/888932891416
ENGAGING IN GLOBAL VALUE CHAIN
Foreign value added shares in exports by source region, 2011
As a percentage of total exports
COMPETING IN THE GLOBAL ECONOMY
Source: OECD Science, Technology and Industry Scoreboard 2015 http://dx.doi.org/10.1787/888933274544
GLOBAL OR REGIONAL VALUE CHAINS?
Value added needed to satisfy final regional demand for Computer,
electronic and optical equipment products
0
10
20
30
40
50
60
70
80
90
100
1995 2011 1995 2011 1995 2011
NAFTA Europe East and
Southeast Asia
%
Intra-regional NAFTA
Europe East and Southeast Asia
Rest of the world
Inter-regional
0
50
100
150
200
250
300
350
400
450
500
1995 2011
East and Southeast
Asia
JPN KOR
CHN TWN
ASEAN
USD billion
Intra-regional: East and
Southeast Asia
0
20
40
60
80
100
120
140
160
180
1995 2011
Europe
FRA DEU
ITA GBR
EU13 Other
USD billion
Intra-regional:
Europe
COMPETING IN THE GLOBAL ECONOMY
Source: OECD Science, Technology and Industry Scoreboard 2015 http://dx.doi.org/10.1787/888933273179
a long shelf life!
R&D tax
incentives
Country
notes
Science and
research today
Interactive charts
www.oecd.org/sti/scoreboard
SCIENCE, TECHNOLOGY, INDUSTRY
SCOREBOARD 2015
INNOVATION FOR GROWTH AND SOCIETY
http://www.oecd.org/sti/rd-tax-stats.htm
THEMATIC
BRIEFS
THEMATIC
COUNTRY NOTES
COUNTRY
NOTES
http://www.oecd.org/sti/scoreboard-2015-interactive-charts.htm
SCIENCE, TECHNOLOGY, INDUSTRY
SCOREBOARD 2015
INNOVATION FOR GROWTH AND SOCIETY
Send us feedbacks, THANK
YOU!
Help us disseminate:
www.oecd.org/sti/scoreboard
Andrew.Wyckoff@oecd.org

Scoreboard- 2015 Japan Launch

  • 1.
    STI SCOREBOARD 2015 INNOVATIONFOR GROWTH AND SOCIETY JAPAN HIGHLIGHTS Andrew Wyckoff, Director OECD Directorate for Science, Technology and Innovation 26 October 2015 National Graduate Institute for Policy Studies (GRIPS) Tokyo, Japan
  • 2.
    The productivity challenge andthe falling working-age population make innovation today’s imperative
  • 3.
    THE PRODUCTIVITY CHALLENGE Labourproductivity growth based on hours worked, total economy level, 2001-14 http://dx.doi.org/10.1787/888933272766Source: OECD Science, Technology and Industry Scoreboard 2015.
  • 4.
    LIVING STANDARDS INJAPAN ARE WELL BELOW THE TOP HALF OF THE OECD Source: OECD Economic Survey Japan, April 2015 http://dx.doi.org/10.1787/888933201725
  • 5.
    INNOVATION RELIES ONINVESTMENT IN BROADER KNOWLEDGE, BEYOND R&D Knowledge intensity of business investment, selected EU economies and the United States, 1995-2013 Source: OECD Science, Technology and Industry Scoreboard 2015 http://dx.doi.org/10.1787/888933273008
  • 6.
    Frontier technologies and data-drivenapplications are needed to provide solutions to global challenges
  • 7.
    3 TOP PLAYERSIN SELECTED FRONTIER TECHNOLOGIES, 2005-07 AND 2010-12 Economies’ share of IP5 patent families filed at USPTO and EPO, selected technologies Source: OECD Science, Technology and Industry Scoreboard 2015 0 5 10 15 20 25 30 35 % Advanced materials New generation of ICT-related technologies Health-related technologies 2005-07 4336 41 40 http://dx.doi.org/10.1787/888933273474
  • 8.
    The research mix:R. versus D. matters and so does government support for long-term, higher-risk research to help tackle global challenges
  • 9.
    R&D GROWTH OVERTHE BUSINESS CYCLE Annual real percentage growth rate of R&D, 2008-14 -8 -4 0 4 8 12 % Government R&D budgets GDP Government-financed R&D expenditures Business-financed R&D expenditures -8 -4 0 4 8 12 % Government R&D budgets GDP Government-financed R&D expenditures Business-financed R&D expenditures -8 -4 0 4 8 12 % Government R&D budgets GDP Government-financed R&D expenditures Business-financed R&D expenditures Source: OECD Science, Technology and Industry Scoreboard 2015 http://dx.doi.org/10.1787/888933273253
  • 10.
    GOVERNMENT BUDGETS FORR&D: A DIVERSIFIED PICTURE G7 and Korea, Index 2008 = 100 Source: OECD Research and Development Database, July 2015. www.oecd.org/sti/rds
  • 11.
    Research excellence and frontierinnovation are fairly concentrated across countries, institutions and businesses
  • 12.
    R&D IN OECD AND KEY PARTNER COUNTRIES, 2013 USA CHN JPN DEU KOR FRA IND GBR RUS BRA ITA CAN AUS ESP SWE NLD TUR CHE AUT ISR BEL MEX POL DNK FIN CZE NOR ZAF PRT IRL HUN GRCNZL IDN SVN CHL SVK LUX ISL EST 0.0 2.0 4.0 6.0 8.0 10.0 12.0 14.0 16.0 18.0 0.0 0.5 1.0 1.5 2.0 2.5 3.0 3.5 4.0 4.5 Gross domestic expenditures on R&D as a percentage of GDP Researchers, per thousand employment R&D expenditures in 2010 USD - constant prices and PPP 1 billion 10 billion 100 billion BRIICS North America EU Other OECD members Source: OECD Science, Technology and Industry Scoreboard 2015 http://dx.doi.org/10.1787/888933273287
  • 13.
    Cumulative percentage shareswithin the top 2000 R&D companies TOP 250 R&D COMPANIES ACCOUNT FOR OVER 60% OF GLOBAL BUSINESS R&D, 2012 About 25% of the TOP 100 R&D corporations are located in Japan Source: OECD Science, Technology and Industry Scoreboard 2015 http://dx.doi.org/10.1787/888933273408
  • 14.
    4 PLAYERS IN50-70% OF HIGH-IMPACT SCIENCE ACROSS ALL DISCIPLINES Top 4 countries with the largest number of 10% top-cited publications, by field, as % of all top-cited publications by authors in OECD and BRIICS countries, 2003-12 0 20 40 60 80 100 % USA GBR CHN DEU BRA CAN ESP AUS FRA IND JPN OTH Source: OECD Science, Technology and Industry Scoreboard 2015 http://dx.doi.org/10.1787/888933273312
  • 15.
    STRENGTHENING INNOVATION AND COMPETITIVENESS:5 PILLARS KNOWLEDGE, TALENT & SKILLS KNOWLEDGE DIFFUSION COMPETITIVENESS INNOVATION IN FIRMS SOCIETY
  • 16.
    INVESTING IN WORKERSSKILLS: TRAINING Investment as a percentage of gross value added by type of training Estimating Cross-Country Investment in Training, STI WP 9, 2015 KNOWLEDGE ASSETS IN FIRMS Source: OECD Science, Technology and Industry Scoreboard 2015 75 69 75 6566 77 70 5662 51 46 34 0 1 2 3 4 5 6 7 8 9 10 DNK AUS NLD GBR CAN FIN USA DEU KOR JPN FRA ITA % Formal only On-the-job only Formal and on-the-job Percentage of total employed persons receiving training http://dx.doi.org/10.1787/888933273718
  • 17.
    THE PREMIUM FROMSCIENTIFIC COLLABORATION The citation impact of scientific production and the extent of international collaboration, 2003-12 RESEARCH CAPABILITIES Source: OECD Science, Technology and Industry Scoreboard 2015 http://dx.doi.org/10.1787/888933273878
  • 18.
    INTERNATIONAL MOBILITY OFSCIENTIFIC AUTHORS Difference between annual inflows and outflows of scientific authors, as percentage of cumulative net flows , selected economies,1999-2013 Source: OECD Science, Technology and Industry Scoreboard 2015. RESEARCH CAPABILITIES http://dx.doi.org/10.1787/888933273360
  • 19.
    WOMEN IN SCIENCE Femalescientific authors in selected fields, by country, 2011, As a percentage of corresponding authors, estimated shares RESEARCH CAPABILITIES Source: OECD Science, Technology and Industry Scoreboard 2015. http://dx.doi.org/10.1787/888933273335
  • 20.
    FIRMS TAPPING INTOINTERNATIONAL COLLABORATION NETWORKS Source: OECD Science, Technology and Industry Scoreboard 2015 Firms engaged in international collaboration by firm size, 2010-12, as a percentage of product and/or process innovative firms in each size category INNOVATION IN FIRMS 0 10 20 30 40 50 60 70 % Large firms SMEs http://dx.doi.org/10.1787/888932891416
  • 21.
    ENGAGING IN GLOBALVALUE CHAIN Foreign value added shares in exports by source region, 2011 As a percentage of total exports COMPETING IN THE GLOBAL ECONOMY Source: OECD Science, Technology and Industry Scoreboard 2015 http://dx.doi.org/10.1787/888933274544
  • 22.
    GLOBAL OR REGIONALVALUE CHAINS? Value added needed to satisfy final regional demand for Computer, electronic and optical equipment products 0 10 20 30 40 50 60 70 80 90 100 1995 2011 1995 2011 1995 2011 NAFTA Europe East and Southeast Asia % Intra-regional NAFTA Europe East and Southeast Asia Rest of the world Inter-regional 0 50 100 150 200 250 300 350 400 450 500 1995 2011 East and Southeast Asia JPN KOR CHN TWN ASEAN USD billion Intra-regional: East and Southeast Asia 0 20 40 60 80 100 120 140 160 180 1995 2011 Europe FRA DEU ITA GBR EU13 Other USD billion Intra-regional: Europe COMPETING IN THE GLOBAL ECONOMY Source: OECD Science, Technology and Industry Scoreboard 2015 http://dx.doi.org/10.1787/888933273179
  • 23.
    a long shelflife! R&D tax incentives Country notes Science and research today Interactive charts www.oecd.org/sti/scoreboard SCIENCE, TECHNOLOGY, INDUSTRY SCOREBOARD 2015 INNOVATION FOR GROWTH AND SOCIETY http://www.oecd.org/sti/rd-tax-stats.htm THEMATIC BRIEFS THEMATIC COUNTRY NOTES COUNTRY NOTES http://www.oecd.org/sti/scoreboard-2015-interactive-charts.htm
  • 24.
    SCIENCE, TECHNOLOGY, INDUSTRY SCOREBOARD2015 INNOVATION FOR GROWTH AND SOCIETY Send us feedbacks, THANK YOU! Help us disseminate: www.oecd.org/sti/scoreboard Andrew.Wyckoff@oecd.org