Download to read offline


![Acknowledgements:
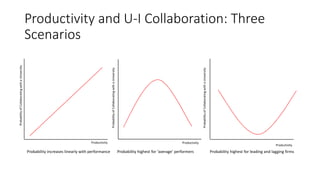
• We are grateful to the ERC for providing support for this work
• Data used in this paper are accessed via the UK Data Service.
The Longitudinal Small Business Survey(LSBS), Department for Business, Innovation and Skills. (2018) Longitudinal Small Business Survey, 2015-2017:
Secure Access. [data collection]. 2nd
Edition. UK Data Service. SN:8261, http://doi.org/10.5255/UKDA-SN-8261-2. The Business Structure Database
(BSD), Office for National Statistics. (2019) Business Structure Database, 1997-2018: Secure Access. [data collection]. 10th
Edition. UK Data Services.
SN:6697, http://doi.org/10.5255/UKDA-SN-6697-10. The British Enterprise, Research and Development (BERD) dataset, Office for National Statistics.
(2019). Business Expenditure on Research and Development, 1995-2017: Secure Access. [data collection]. 8th
Edition. UK Data Service. SN: 6690,
http://doi.org/10.5255/UKDA-SN-6690-8. The use of these data does not imply the endorsement of the data owner or the UK Data Service at the UK
Data Archive in relation to the interpretation or analysis of the data. This work uses research datasets which may not exactly reproduce National
Statistics aggregates.
The UK’s European UniversityPage 17](https://image.slidesharecdn.com/lsbs19eventpresentationslides19-191008144041/85/LSBS-event-presentation-slides-17-320.jpg)

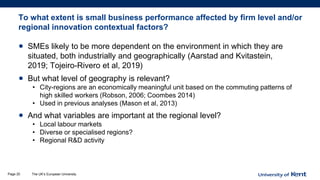
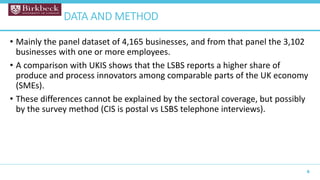
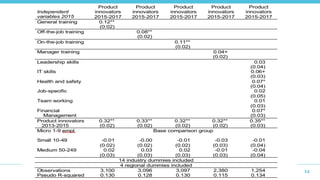
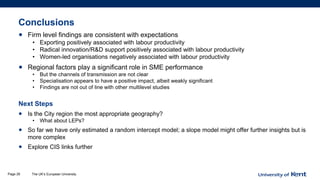
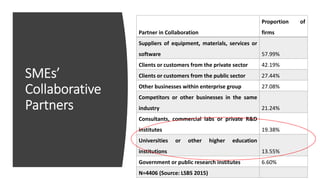
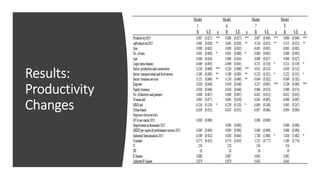
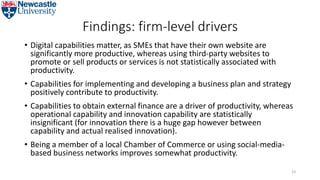
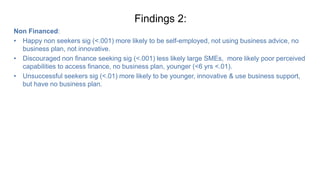
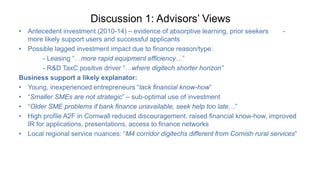
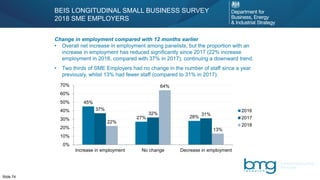
![Findings (1) Random Effects
The UK’s European UniversityPage 24
(6)
Ln(labour productivity)
Ln (lagged employment) 0.0182*
[0.010]
Age of business (years) 0.0038***
[0.001]
Export (dummy) 0.2926***
[0.027]
Women-led (dummy) -0.1581***
[0.029]
Minority Ethnic led (dummy) 0.0548
[0.062]
Undertaking radical innovation (dummy) 0.1105***
[0.032]
Undertaking incremental innovation (dummy) 0.0423*
[0.023]
In receipt of government R&D support -0.0059
[0.015]](https://image.slidesharecdn.com/lsbs19eventpresentationslides19-191008144041/85/LSBS-event-presentation-slides-24-320.jpg)
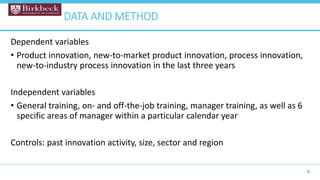
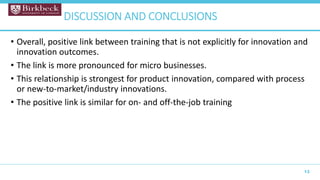
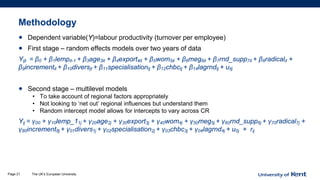
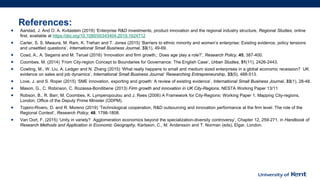
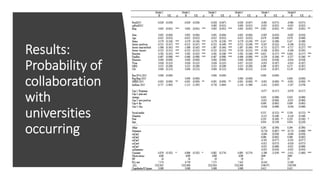
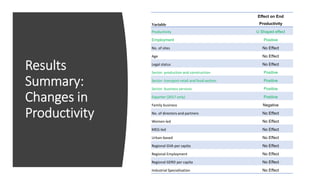
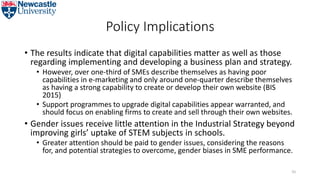
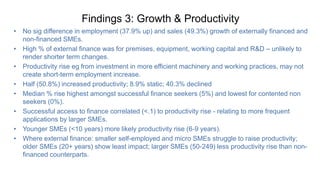
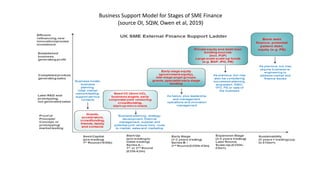
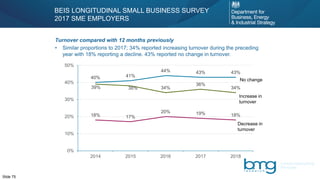
![Findings (2)
Random Effects
The UK’s European UniversityPage 25
Sector (Manufacturing) 0.1523***
[0.037]
Sector (Agriculture, fishing) -0.0335
[0.073]
Sector (Mining, energy) 0.5312***
[0.041]
Labour market conditions (factor) 0.0174
[0.018]
Lagged R&D spend 0.0000***
[0.000]
Diversity 0.3371
[0.229]
Own Specialisation 0.0164**
[0.008]
Change in Business Count 0.006
[0.004]
Constant 3.0729***
[0.390]
Observations 11,107
Number of serial 7,327
Wald 529.3
SEE 0.404
Robust standard errors in brackets
*** p<0.01, ** p<0.05, * p<0.1](https://image.slidesharecdn.com/lsbs19eventpresentationslides19-191008144041/85/LSBS-event-presentation-slides-25-320.jpg)
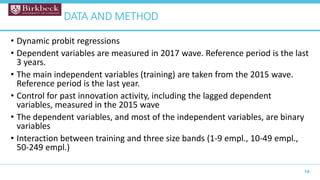
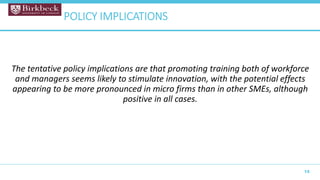
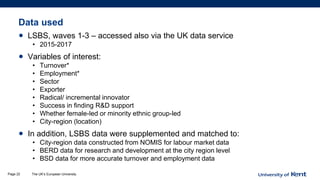
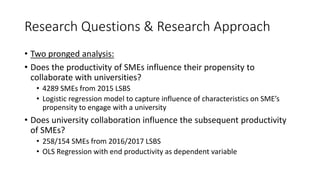
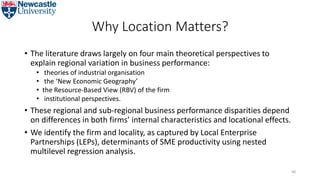
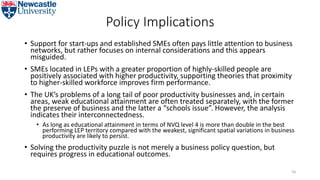
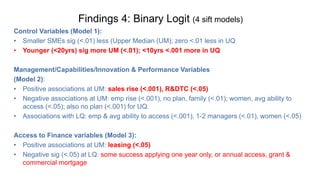
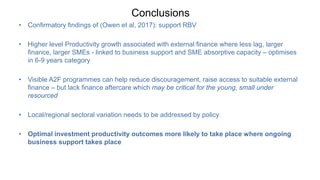
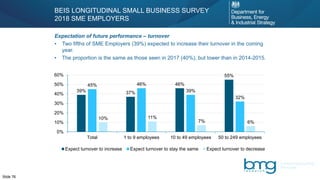
![Findings (3) Multi-level
modelling
The UK’s European UniversityPage 26
(8) (9)
VARIABLES Ln(labour productivity)
Constant 3.8786*** 3.6113***
[0.028] [0.465]
Ln (lagged employment) -0.0023 -0.0038
[0.007] [0.007]
Age of business (years) 0.0052*** 0.0045***
[0.001] [0.001]
Export (dummy) 0.5096*** 0.5039***
[0.025] [0.026]
Women-led (dummy) -0.1480*** -0.1482***
[0.025] [0.026]
Minority Ethnic led (dummy) 0.0648 0.0536
[0.049] [0.050]
In receipt of government R&D support 0.1578*** 0.1662***
[0.040] [0.042]
Undertaking radical innovation (dummy) -0.0086 -0.0123
[0.032] [0.033]
Undertaking incremental innovation (dummy) -0.0341 -0.0333
[0.022] [0.023]](https://image.slidesharecdn.com/lsbs19eventpresentationslides19-191008144041/85/LSBS-event-presentation-slides-26-320.jpg)
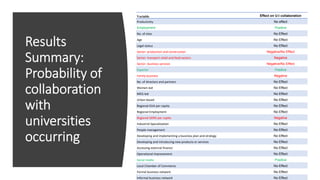
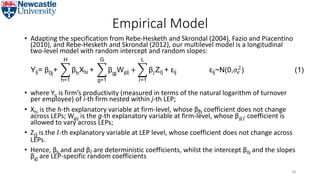
![Findings (4) Multi-
level modelling
The UK’s European UniversityPage 27
Sector (Manufacturing) 0.0689** 0.0883***
[0.031] [0.033]
Sector (Agriculture, fishing) -0.0736 -0.015
[0.050] [0.053]
Sector (Mining, energy) 0.5457*** 0.5730***
[0.034] [0.035]
Labour market conditions (factor) 0.0212
[0.022]
Diversity 0.2895
[0.327]
Own Specialisation 0.0036
[0.010]
Change in Business Count 0.0137*
[0.008]
Lagged R&D spend 0
[0.000]
Variance (city region) 0.0106 0.0077
[0.0040] [0.0040]
Variance (business-city region) 1.1213 1.1267
[0.0146] 0.0152]
LR test versus linear model 65.20*** 10.89***
Log likelihood -17609.931 -16442.043
Observations 11,912 11,107
Number of groups 55 52
Wald 905.8 837.7
Standard errors in brackets *** p<0.01, ** p<0.05, * p<0.1](https://image.slidesharecdn.com/lsbs19eventpresentationslides19-191008144041/85/LSBS-event-presentation-slides-27-320.jpg)


![Empirical Model
49
• Equation (1) can be re-written as
• Labour productivity is assumed to be the result of both fixed effects (first
bracket) and random effects (the latter bracket). So the first bracket is the
deterministic part of the model, while the second bracket is the stochastic
part of the model, because it allows both the intercept and slopes to vary
spatially.
• Thus, the multilevel analysis comprises a fixed-effects part (at firm level or
level one) and a random-effects part (at LEP level or level two).
(2)Yij= [γ00+ βhX i+γg0W ij+β Z j ]+[u0j +ugjW ij + εij]](https://image.slidesharecdn.com/lsbs19eventpresentationslides19-191008144041/85/LSBS-event-presentation-slides-49-320.jpg)


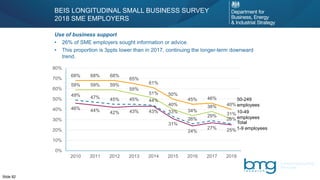
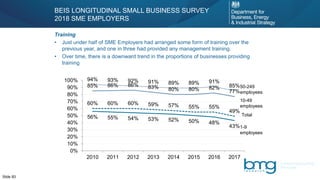
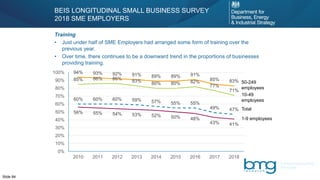


1) The study examines the link between training and innovation in small businesses using a longitudinal dataset of over 4,000 UK businesses. 2) The results show that general employee training and manager training are positively associated with product and process innovation, especially in micro businesses. On-the-job and off-the-job training both showed positive links to innovation. 3) Manager training in areas like IT, financial management, and leadership skills showed the strongest associations with novel product and process innovation.


