Download to read offline

![Regional Innovation Scoreboard 2014
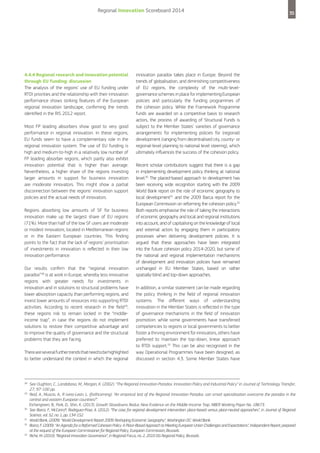
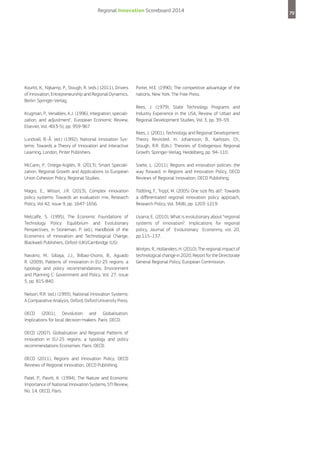
Box 2.1 Innovation Systems Definitions
“ .. the network of institutions in the public and private sectors
.
whose activities and interactions initiate, import, modify and
diffuse new technologies.” (Freeman, 1987)
75
Box 2.2 Regional System of Innovation Definitions
“ ... a collective order based on microconstitutional regulation
conditioned by trust, reliability, exchange and cooperative
interaction” (Cooke, Gomez Uranga, Etxebarria, 1997)
[I contains] “... subsystems of generation and exploitation of
t
“ .. the elements and relationships which interact in the
.
knowledge that interact with other regional, national and global
production, diffusion and use of new, and economically useful,
systems for the commercialization of new knowledge”
knowledge ... and are either located within or rooted inside the
(Cooke et al. , 2004)
borders of a nation state.”
“ he structure of production’’ and ‘‘the institutional set-up’’ are
T
the two most important dimensions that ‘‘jointly define a system
of innovation’’ (Lundvall 1992)
“ .. a set of institutions whose interactions determine the
.
innovative performance ... of national firms.” (Nelson, 1993)
“ ... a set of interacting private and public interests, formal
institutions and other organizations that function according to
organizational and institutional arrangements and relationships
conducive to the generation, use and dissemination of
knowledge” (Doloraux, 2004)
“ .. the national institutions, their incentive structures and
.
their competencies, that determine the rate and direction of
technological learning (or the volume and composition of change
generating activities) in a country.” (Patel and Pavitt, 1994)
“ ... the institutional infrastructure supporting innovation within
the production structure of a region” (Asheim and Gertler, 2005)
“[It compRSIes] two subsystems of actors: …1) the regional
production structure or knowledge exploitation subsystem
(mainly firms, often displaying clustering tendencies) 2) the
regional supportive infrastructure or knowledge generation
“ .. that set of distinct institutions which jointly and individually
.
subsystem. …These two subsystems are systematically engaged
contribute to the development and diffusion of new technologies
in interactive learning in an informal institutional context
and which provides the framework within which governments
(i.e. norms, trust and routines).
form and implement policies to influence the innovation process.
This dynamic and complex interaction constitutes what is
As such it is a system of interconnected institutions to create,
commonly labeled systems of innovation [where] systems are
store and transfer the knowledge, skills and artefacts which
understood as interaction networks.” (Asheim, Coenen, 2006)
define new technologies.” (Metcalfe, 1995)
“ .. all important economic, social political, organizational,
.
institutional and other factors that influence the development,
diffusion and use of innovations.” (Edquist, 1997, Edquist 2005)
RSI can be defined as the “.. wider setting of organisations and
institutions affecting and supporting learning and innovation in a
region” (Asheim, 2009)](https://image.slidesharecdn.com/ris-2014en-140304074245-phpapp02/85/Ris-2014-en-77-320.jpg)


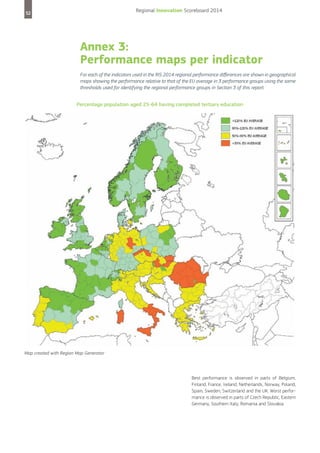
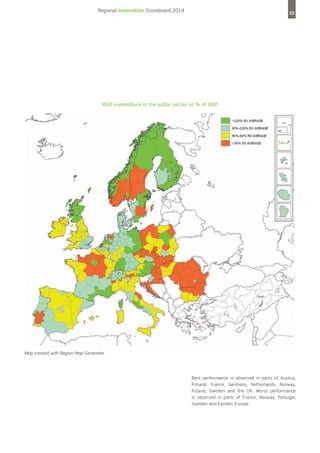
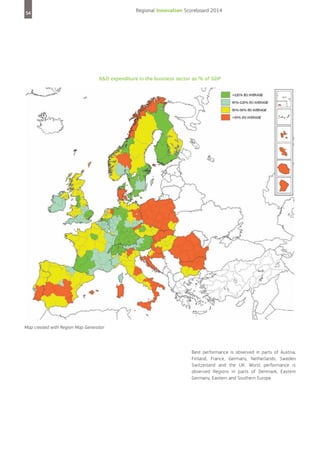
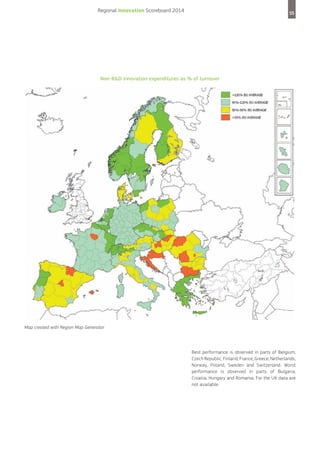
The Regional Innovation Scoreboard provides a comparative assessment of innovation performance across 190 regions in Europe. It uses 11 indicators to measure regional innovation performance and groups regions into four categories: Regional Innovation leaders, Regional Innovation followers, Regional Moderate innovators, and Regional Modest innovators. For most regions, innovation performance improved over 2004-2010, though it declined for some. Regions with more positive attitudes toward new ideas and public support for innovation tend to be more innovative. The analysis also examines how regions leverage EU funding for research and innovation.


