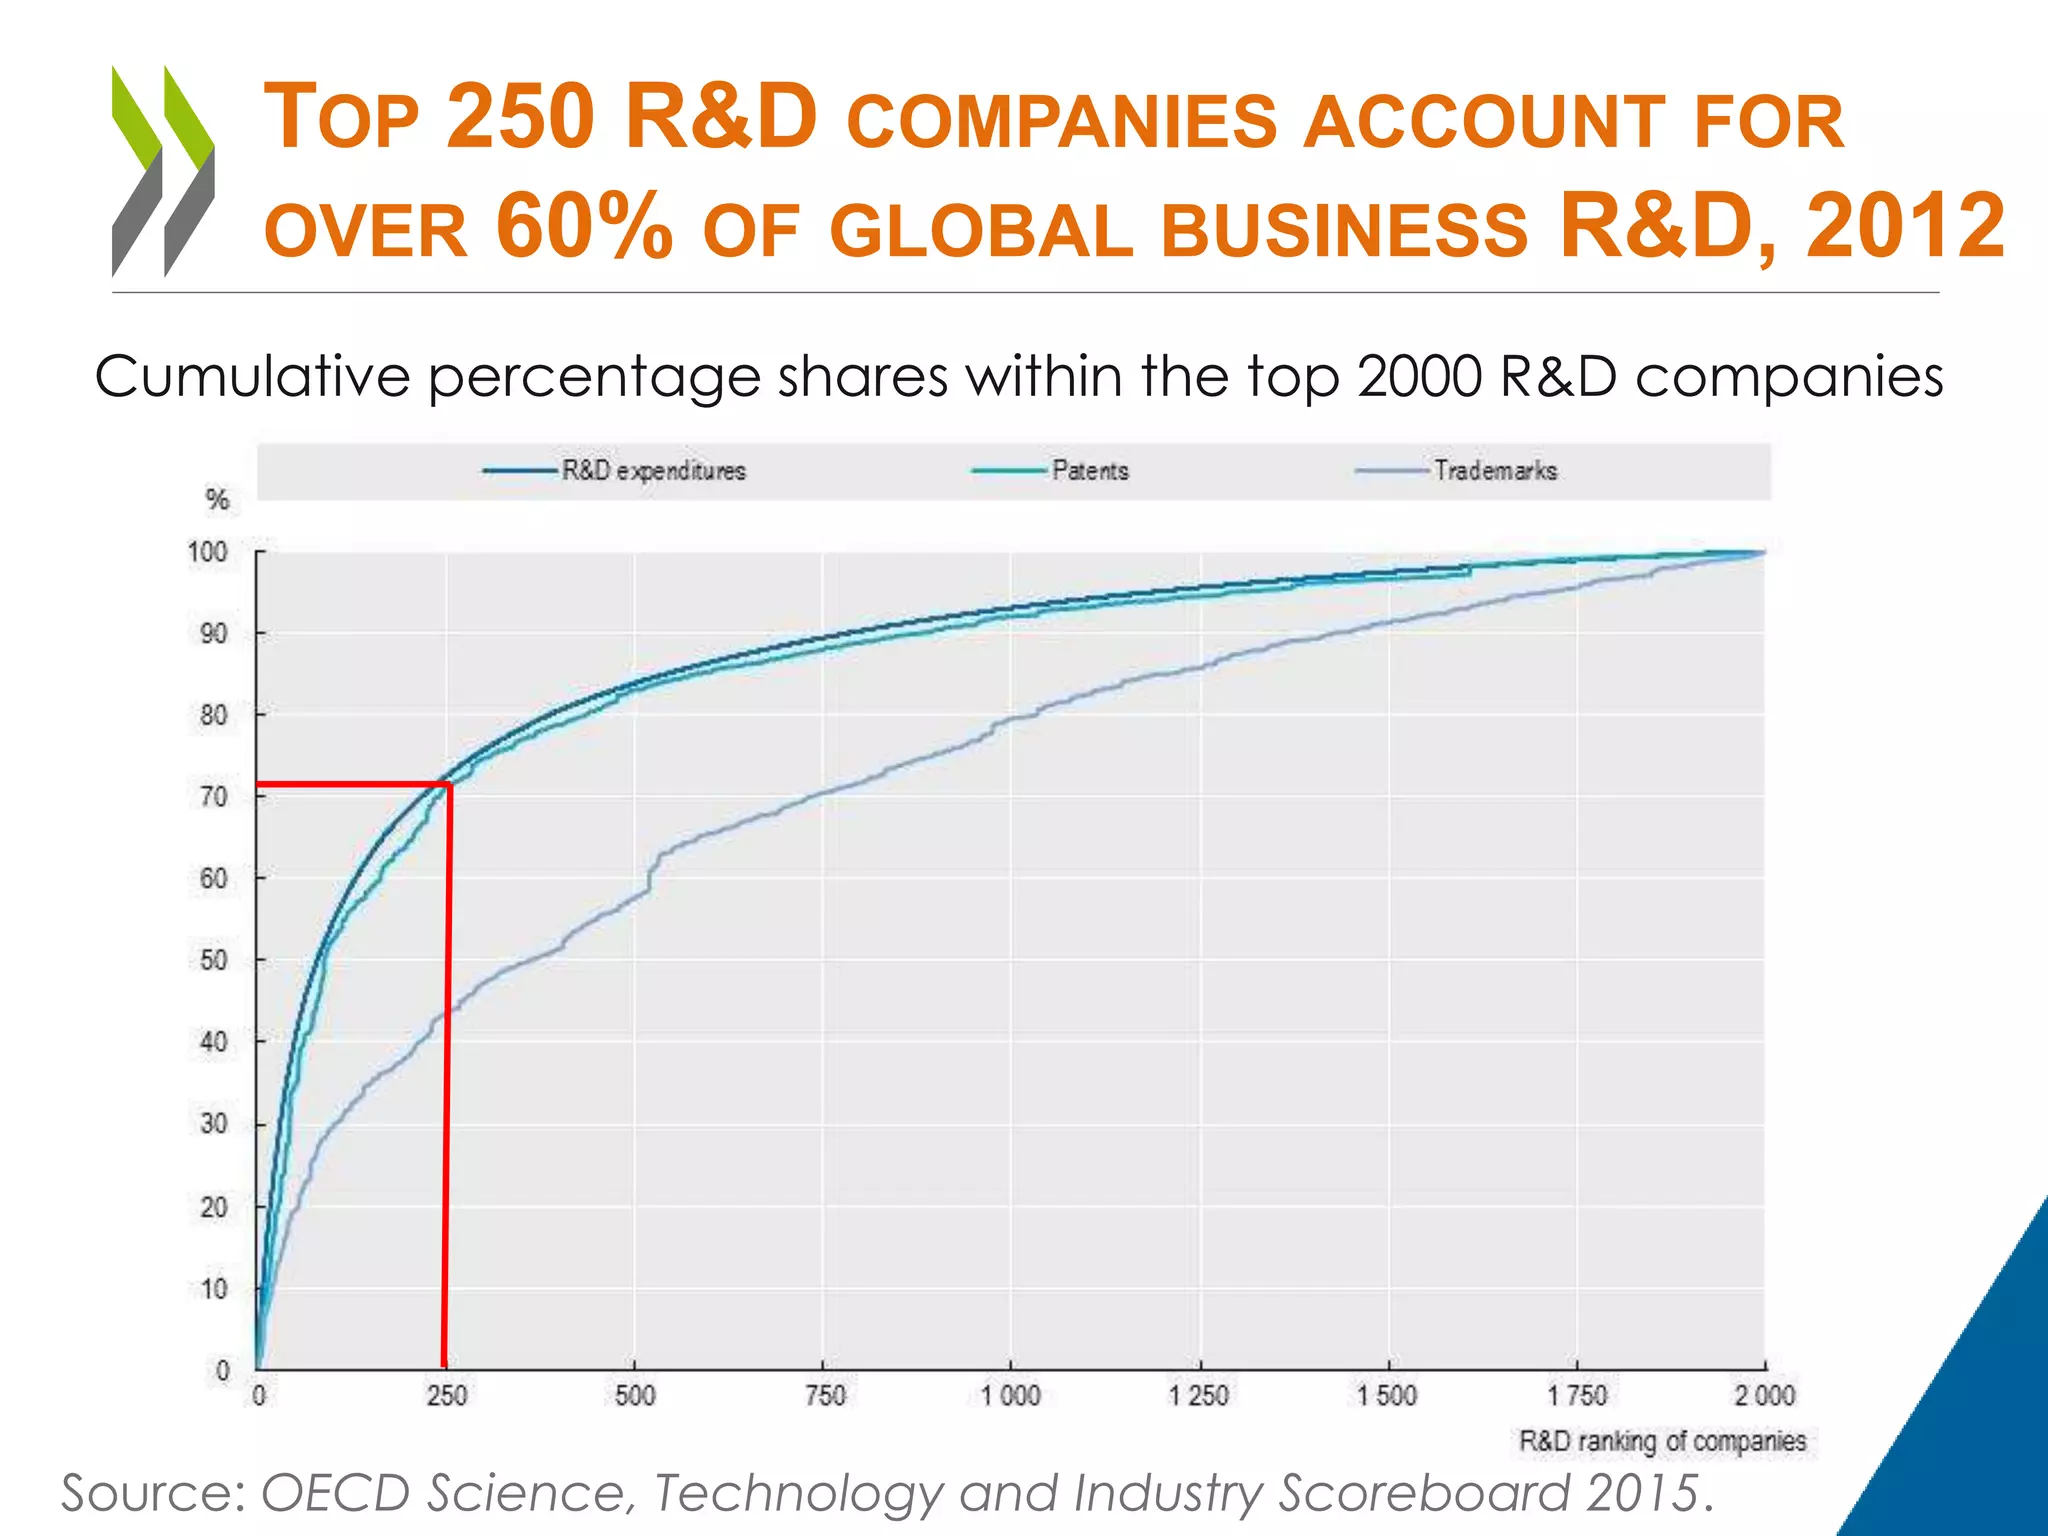
STI SCOREBOARD 2015
INNOVATION FOR GROWTH
AND SOCIETY
Andrew Wyckoff, Director
OECD Directorate for Science, Technology and Innovation
19 October 2015
World Science and Technology Forum
Daejeon, Korea
Frontier technologies are
needed to provide solutions
to global challenges
3 TOP PLAYERS IN SELECTED FRONTIER
TECHNOLOGIES
Source: OECD Science, Technology and Industry Scoreboard 2015.
Economies’ share of IP5 patent families filed at USPTO and EPO,
selected technologies, 2010-12
0
5
10
15
20
25
30
35
%
Advanced materials New generation of ICT-related technologies Health-related technologies 2005-07
4336 41 40
The research mix: R.
versus D. matters and so
does government
support for long-term,
higher-risk research to
help tackle global
challenges
R&D GROWTH OVER THE BUSINESS
CYCLE
Annual real percentage growth rate of R&D, 2008-14
Source: OECD Science, Technology and Industry Scoreboard 2015.
-8
-4
0
4
8
12
%
Government R&D budgets GDP
Government-financed R&D expenditures Business-financed R&D expenditures
-8
-4
0
4
8
12
%
Government R&D budgets GDP
Government-financed R&D expenditures Business-financed R&D expenditures
-8
-4
0
4
8
12
%
Government R&D budgets GDP
Government-financed R&D expenditures Business-financed R&D expenditures
The research mix matters: R (basic and
applied research) v. D (development)
OECD area total GERD, Index 2007 = 100
Source: OECD Science, Technology and Industry Scoreboard 2015.
GOVERNMENT BUDGETS FOR R&D: A
DIVERSIFIED PICTURE
Source: OECD Science, Technology and Industry Scoreboard 2015.
G7 and Korea, Index 2008 = 100
THE RESEARCH MIX IN OECD AND
EMERGING ECONOMIES: R VERSUS D
Source: OECD Science, Technology and Industry Scoreboard 2015.
Research excellence and
frontier innovation are
fairly concentrated across
countries, institutions and
businesses
R&D IN
OECD AND
KEY
PARTNER
COUNTRIES,
2013
USA
CHN
JPN
DEU
KOR
FRA
IND
GBR
RUS
BRA
ITA
CAN
AUS
ESP
SWE
NLD
TUR
CHE
AUT
ISR
BEL
MEX
POL
DNK
FIN
CZE
NOR
ZAF
PRT
IRL
HUN
GRC NZL
IDN
SVN
CHL
SVK LUX
ISL
EST
0.0
2.0
4.0
6.0
8.0
10.0
12.0
14.0
16.0
18.0
0.0 0.5 1.0 1.5 2.0 2.5 3.0 3.5 4.0 4.5
Gross domestic expenditures on
R&D as a percentage of GDP
Researchers, per thousand employment
R&D expenditures in 2010
USD - constant prices and PPP
1 billion
10 billion
100 billion
BRIICS
North America
EU
Other OECD members
Source: OECD Science, Technology and Industry Scoreboard 2015.
4 PLAYERS IN 50-70% OF HIGH-IMPACT
SCIENCE ACROSS ALL DISCIPLINES
Top 4 countries with the largest number of 10% top-cited publications, by field,
as % of all top-cited publications by authors in OECD and BRIICS countries,
2003-12
0
20
40
60
80
100
%
USA GBR CHN DEU BRA CAN ESP AUS FRA IND JPN OTH
Source: OECD Science, Technology and Industry Scoreboard 2015.
Cumulative percentage shares within the top 2000 R&D companies
TOP 250 R&D COMPANIES ACCOUNT FOR
OVER 60% OF GLOBAL BUSINESS R&D, 2012
Source: OECD Science, Technology and Industry Scoreboard 2015.
How can other countries
and actors benefit from
frontier innovation ? The
role of collaboration and
scientists mobility
THE PREMIUM FROM SCIENTIFIC
COLLABORATION
The citation impact of scientific production and the extent of international
collaboration, 2003-12
Source: OECD Science, Technology and Industry Scoreboard 2015.
INTERNATIONAL NET FLOWS OF SCIENTIFIC
AUTHORS, SELECTED ECONOMIES
Difference between annual inflows and outflows, as percentage
of cumulative net flows , 1999-2013
Source: OECD Science, Technology and Industry Scoreboard 2015.
5 PILLARS FOR MONITORING
AND ASSESSMENT
KNOWLEDGE, TALENT & SKILLS
KNOWLEDGE DIFFUSION
COMPETITIVENESS
INNOVATION IN FIRMS
SOCIETY
SCIENCE, TECHNOLOGY, INDUSTRY
SCOREBOARD 2015
INNOVATION FOR GROWTH AND SOCIETY
Send us feedbacks, THANK
YOU!
Help us disseminate:
www.oecd.org/sti/scoreboard
Launch @ countries
Andrew.Wyckoff@oecd.org

STI Scoreboard 2015

  • 1.
    STI SCOREBOARD 2015 INNOVATIONFOR GROWTH AND SOCIETY Andrew Wyckoff, Director OECD Directorate for Science, Technology and Innovation 19 October 2015 World Science and Technology Forum Daejeon, Korea
  • 2.
    Frontier technologies are neededto provide solutions to global challenges
  • 3.
    3 TOP PLAYERSIN SELECTED FRONTIER TECHNOLOGIES Source: OECD Science, Technology and Industry Scoreboard 2015. Economies’ share of IP5 patent families filed at USPTO and EPO, selected technologies, 2010-12 0 5 10 15 20 25 30 35 % Advanced materials New generation of ICT-related technologies Health-related technologies 2005-07 4336 41 40
  • 4.
    The research mix:R. versus D. matters and so does government support for long-term, higher-risk research to help tackle global challenges
  • 5.
    R&D GROWTH OVERTHE BUSINESS CYCLE Annual real percentage growth rate of R&D, 2008-14 Source: OECD Science, Technology and Industry Scoreboard 2015. -8 -4 0 4 8 12 % Government R&D budgets GDP Government-financed R&D expenditures Business-financed R&D expenditures -8 -4 0 4 8 12 % Government R&D budgets GDP Government-financed R&D expenditures Business-financed R&D expenditures -8 -4 0 4 8 12 % Government R&D budgets GDP Government-financed R&D expenditures Business-financed R&D expenditures
  • 6.
    The research mixmatters: R (basic and applied research) v. D (development) OECD area total GERD, Index 2007 = 100 Source: OECD Science, Technology and Industry Scoreboard 2015.
  • 7.
    GOVERNMENT BUDGETS FORR&D: A DIVERSIFIED PICTURE Source: OECD Science, Technology and Industry Scoreboard 2015. G7 and Korea, Index 2008 = 100
  • 8.
    THE RESEARCH MIXIN OECD AND EMERGING ECONOMIES: R VERSUS D Source: OECD Science, Technology and Industry Scoreboard 2015.
  • 9.
    Research excellence and frontierinnovation are fairly concentrated across countries, institutions and businesses
  • 10.
    R&D IN OECD AND KEY PARTNER COUNTRIES, 2013 USA CHN JPN DEU KOR FRA IND GBR RUS BRA ITA CAN AUS ESP SWE NLD TUR CHE AUT ISR BEL MEX POL DNK FIN CZE NOR ZAF PRT IRL HUN GRCNZL IDN SVN CHL SVK LUX ISL EST 0.0 2.0 4.0 6.0 8.0 10.0 12.0 14.0 16.0 18.0 0.0 0.5 1.0 1.5 2.0 2.5 3.0 3.5 4.0 4.5 Gross domestic expenditures on R&D as a percentage of GDP Researchers, per thousand employment R&D expenditures in 2010 USD - constant prices and PPP 1 billion 10 billion 100 billion BRIICS North America EU Other OECD members Source: OECD Science, Technology and Industry Scoreboard 2015.
  • 11.
    4 PLAYERS IN50-70% OF HIGH-IMPACT SCIENCE ACROSS ALL DISCIPLINES Top 4 countries with the largest number of 10% top-cited publications, by field, as % of all top-cited publications by authors in OECD and BRIICS countries, 2003-12 0 20 40 60 80 100 % USA GBR CHN DEU BRA CAN ESP AUS FRA IND JPN OTH Source: OECD Science, Technology and Industry Scoreboard 2015.
  • 12.
    Cumulative percentage shareswithin the top 2000 R&D companies TOP 250 R&D COMPANIES ACCOUNT FOR OVER 60% OF GLOBAL BUSINESS R&D, 2012 Source: OECD Science, Technology and Industry Scoreboard 2015.
  • 13.
    How can othercountries and actors benefit from frontier innovation ? The role of collaboration and scientists mobility
  • 14.
    THE PREMIUM FROMSCIENTIFIC COLLABORATION The citation impact of scientific production and the extent of international collaboration, 2003-12 Source: OECD Science, Technology and Industry Scoreboard 2015.
  • 15.
    INTERNATIONAL NET FLOWSOF SCIENTIFIC AUTHORS, SELECTED ECONOMIES Difference between annual inflows and outflows, as percentage of cumulative net flows , 1999-2013 Source: OECD Science, Technology and Industry Scoreboard 2015.
  • 16.
    5 PILLARS FORMONITORING AND ASSESSMENT KNOWLEDGE, TALENT & SKILLS KNOWLEDGE DIFFUSION COMPETITIVENESS INNOVATION IN FIRMS SOCIETY
  • 17.
    SCIENCE, TECHNOLOGY, INDUSTRY SCOREBOARD2015 INNOVATION FOR GROWTH AND SOCIETY Send us feedbacks, THANK YOU! Help us disseminate: www.oecd.org/sti/scoreboard Launch @ countries Andrew.Wyckoff@oecd.org