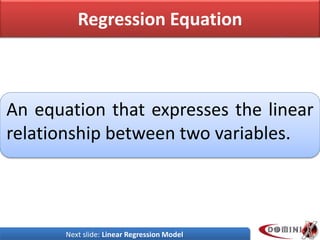
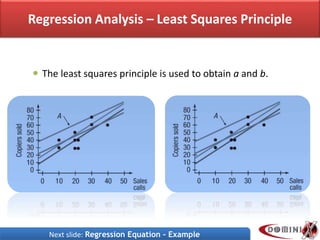
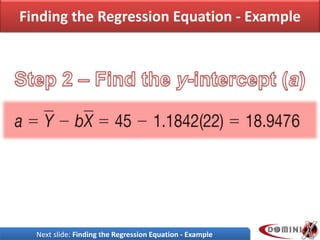
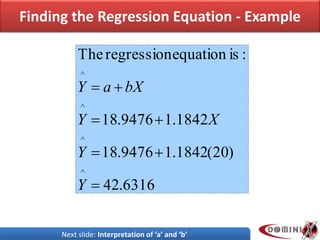
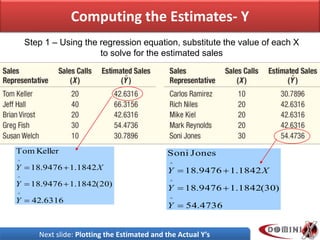
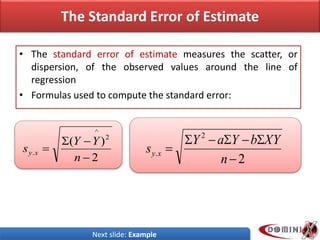
Regression Equation
Next slide: Linear Regression Model
An equation that expresses the linear
relationship between two variables.
Linear Regression Model
Next slide: Computing the Slope of the Line and the Y-intercept
Computing the Slope of the Line and the Y-intercept
Next slide: Regression Analysis
In regression analysis we use the independent variable (X) to
estimate the dependent variable (Y).
• The relationship between the variables is linear.
• Both variables must be at least interval scale.
• The least squares criterion is used to determine the equation.
LEAST SQUARES PRINCIPLE Determining a regression equation by
minimizing the sum of the squares of the vertical distances between the
actual Y values and the predicted values of Y.
Regression Analysis
Next slide: Regression Analysis – Least Squares Principle
Regression Analysis – Least Squares Principle
 The least squares principle is used to obtain a and b.
Next slide: Regression Equation - Example
Recall the example involving
Copier Sales of America. The sales
manager gathered information on
the number of sales calls made
and the number of copiers sold for
a random sample of 10 sales
representatives. Use the least
squares method to determine a
linear equation to express the
relationship between the two
variables.
What is the expected number of
copiers sold by a representative
who made 20 calls?
Regression Equation - Example
Next slide: Finding the Regression Equation - Example
Finding the Regression Equation - Example
Next slide: Finding the Regression Equation - Example
Finding the Regression Equation - Example
Next slide: Finding the Regression Equation - Example
Finding the Regression Equation - Example
6316.42
)20(1842.19476.18
1842.19476.18
:isequationregressionThe
^
^
^
^




Y
Y
XY
bXaY
Next slide: Interpretation of ‘a’ and ‘b’
Interpretation of ‘a’ and ‘b’
Next slide: Computing the Estimates- Y
•‘b’ means, for each additional sales call made the sales
representative can expect to increase the number of copiers
sold by 1.1842.
•The ‘a’ value of 18.9476 is the point where the equation
crosses the y-axis. i.e. if no sales call made, the sale would be
18.9476.
Step 1 – Using the regression equation, substitute the value of each X
to solve for the estimated sales
6316.42
)20(1842.19476.18
1842.19476.18
KellerTom
^
^
^



Y
Y
XY
4736.54
)30(1842.19476.18
1842.19476.18
JonesSoni
^
^
^



Y
Y
XY
Computing the Estimates- Y
Next slide: Plotting the Estimated and the Actual Y’s
Plotting the Estimated and the Actual Y’s
Next slide: The Standard Error of Estimate
• The standard error of estimate measures the scatter, or
dispersion, of the observed values around the line of
regression
• Formulas used to compute the standard error:
2
2
.



n
XYbYaY
s xy
2
)( 2
^
.



n
YY
s xy
The Standard Error of Estimate
Next slide: Example
Recall the example
involving Copier Sales of
America. The sales manager
determined the least
squares regression
equation is given below.
Determine the standard
error of estimate as a
measure of how well the
values fit the regression
line.
XY 1842.19476.18
^

901.9
210
211.784
2
)( 2
^
.






n
YY
s xy
Example
Next slide: Excel
Excel
Next slide: Confidence Interval and Prediction Interval Estimates of Y
•A confidence interval reports the mean value of Y for a given X.
•A prediction interval reports the range of values of Y for a particular value
of X.
Confidence Interval and Prediction Interval
Estimates of Y
Next slide: Confidence Interval Estimate - Example
Confidence Interval Estimate - Example
We return to the Copier Sales of America illustration.
Determine a 95 percent confidence interval for all
sales representatives who make 25 calls.
Next slide: Confidence Interval Estimate - Example
Confidence Interval Estimate - Example
Step 1 – Compute the point estimate of Y
In other words, determine the number of copiers we expect a sales representative
to sell if he or she makes 25 calls.
5526.48
)25(1842.19476.18
1842.19476.18
:isequationregressionThe
^
^
^



Y
Y
XY
Next slide: Confidence Interval Estimate - Example
Confidence Interval Estimate - Example
Step 2 – Find the value of t
 To find the t value, we need to first know the number of
degrees of freedom. In this case the degrees of freedom is
n - 2 = 10 – 2 = 8.
 We set the confidence level at 95 percent. To find the
value of t, move down the left-hand column of Appendix
B.2 to 8 degrees of freedom, then move across to the
column with the 95 percent level of confidence.
 The value of t is 2.306.
Next slide: Confidence Interval Estimate - Example
Confidence Interval Estimate - Example
 2
XX 
  
2
XXStep 3 – Compute and 2
XX 
Next slide: Confidence Interval Estimate - Example
Confidence Interval Estimate - Example
Step 4 – Use the formula above by substituting the numbers computed
in previous slides
Thus, the 95 percent confidence interval for the average sales of
all sales representatives who make 25 calls is from 40.9170 up to
56.1882 copiers.
Next slide: Prediction Interval Estimate - Example
Prediction Interval Estimate - Example
We return to the Copier Sales of America
illustration. Determine a 95 percent
prediction interval for Sheila Baker, a West
Coast sales representative who made 25
calls.
Next slide: Prediction Interval Estimate - Example
Prediction Interval Estimate - Example
Step 1 – Compute the point estimate of Y
In other words, determine the number of copiers we expect a sales
representative to sell if he or she makes 25 calls.
5526.48
)25(1842.19476.18
1842.19476.18
:isequationregressionThe
^
^
^



Y
Y
XY
Next slide: Prediction Interval Estimate - Example
Step 2 – Using the information computed earlier
in the confidence interval estimation example,
use the formula above.
If Sheila Baker makes 25 sales calls, the number of
copiers she will sell will be between about 24 and 73
copiers.
Prediction Interval Estimate - Example
Next slide: Real Life Applications
Next slide: Calculating Values at Housing Business
Example 1: Calculating Values at Housing Business
Next slide: Calculating Values at Housing Business
Sizes and Prices of Eighteen Houses
X= Size Y=Price X= Size Y= Price
1.8 32 2.3 44
1.0 24 1.4 27
1.7 27 3.3 50
1.2 25 2.2 37
2.8 47 1.5 28
1.7 30 1.1 20
2.5 43 2.0 38
3.6 52 2.6 45
Calculating Values at Housing Business
Next slide: Relation between age and income
Here,
Y = a + bx
Price = 9.253 + 12.873(Size)
X= Size
Y= Price
Example 2: Relation between age and income
Next slide: Relation between age and income
Relation between age and income
Next slide: Thank You
Here,
Y = a + bx
Income = 22.88 - 0.05834 (Age)
X= Age
Y= Income

Presentation on regression (Statistics)

  • 2.
    Regression Equation Next slide:Linear Regression Model An equation that expresses the linear relationship between two variables.
  • 3.
    Linear Regression Model Nextslide: Computing the Slope of the Line and the Y-intercept
  • 4.
    Computing the Slopeof the Line and the Y-intercept Next slide: Regression Analysis
  • 5.
    In regression analysiswe use the independent variable (X) to estimate the dependent variable (Y). • The relationship between the variables is linear. • Both variables must be at least interval scale. • The least squares criterion is used to determine the equation. LEAST SQUARES PRINCIPLE Determining a regression equation by minimizing the sum of the squares of the vertical distances between the actual Y values and the predicted values of Y. Regression Analysis Next slide: Regression Analysis – Least Squares Principle
  • 6.
    Regression Analysis –Least Squares Principle  The least squares principle is used to obtain a and b. Next slide: Regression Equation - Example
  • 7.
    Recall the exampleinvolving Copier Sales of America. The sales manager gathered information on the number of sales calls made and the number of copiers sold for a random sample of 10 sales representatives. Use the least squares method to determine a linear equation to express the relationship between the two variables. What is the expected number of copiers sold by a representative who made 20 calls? Regression Equation - Example Next slide: Finding the Regression Equation - Example
  • 8.
    Finding the RegressionEquation - Example Next slide: Finding the Regression Equation - Example
  • 9.
    Finding the RegressionEquation - Example Next slide: Finding the Regression Equation - Example
  • 10.
    Finding the RegressionEquation - Example 6316.42 )20(1842.19476.18 1842.19476.18 :isequationregressionThe ^ ^ ^ ^     Y Y XY bXaY Next slide: Interpretation of ‘a’ and ‘b’
  • 11.
    Interpretation of ‘a’and ‘b’ Next slide: Computing the Estimates- Y •‘b’ means, for each additional sales call made the sales representative can expect to increase the number of copiers sold by 1.1842. •The ‘a’ value of 18.9476 is the point where the equation crosses the y-axis. i.e. if no sales call made, the sale would be 18.9476.
  • 12.
    Step 1 –Using the regression equation, substitute the value of each X to solve for the estimated sales 6316.42 )20(1842.19476.18 1842.19476.18 KellerTom ^ ^ ^    Y Y XY 4736.54 )30(1842.19476.18 1842.19476.18 JonesSoni ^ ^ ^    Y Y XY Computing the Estimates- Y Next slide: Plotting the Estimated and the Actual Y’s
  • 13.
    Plotting the Estimatedand the Actual Y’s Next slide: The Standard Error of Estimate
  • 14.
    • The standarderror of estimate measures the scatter, or dispersion, of the observed values around the line of regression • Formulas used to compute the standard error: 2 2 .    n XYbYaY s xy 2 )( 2 ^ .    n YY s xy The Standard Error of Estimate Next slide: Example
  • 15.
    Recall the example involvingCopier Sales of America. The sales manager determined the least squares regression equation is given below. Determine the standard error of estimate as a measure of how well the values fit the regression line. XY 1842.19476.18 ^  901.9 210 211.784 2 )( 2 ^ .       n YY s xy Example Next slide: Excel
  • 16.
    Excel Next slide: ConfidenceInterval and Prediction Interval Estimates of Y
  • 17.
    •A confidence intervalreports the mean value of Y for a given X. •A prediction interval reports the range of values of Y for a particular value of X. Confidence Interval and Prediction Interval Estimates of Y Next slide: Confidence Interval Estimate - Example
  • 18.
    Confidence Interval Estimate- Example We return to the Copier Sales of America illustration. Determine a 95 percent confidence interval for all sales representatives who make 25 calls. Next slide: Confidence Interval Estimate - Example
  • 19.
    Confidence Interval Estimate- Example Step 1 – Compute the point estimate of Y In other words, determine the number of copiers we expect a sales representative to sell if he or she makes 25 calls. 5526.48 )25(1842.19476.18 1842.19476.18 :isequationregressionThe ^ ^ ^    Y Y XY Next slide: Confidence Interval Estimate - Example
  • 20.
    Confidence Interval Estimate- Example Step 2 – Find the value of t  To find the t value, we need to first know the number of degrees of freedom. In this case the degrees of freedom is n - 2 = 10 – 2 = 8.  We set the confidence level at 95 percent. To find the value of t, move down the left-hand column of Appendix B.2 to 8 degrees of freedom, then move across to the column with the 95 percent level of confidence.  The value of t is 2.306. Next slide: Confidence Interval Estimate - Example
  • 21.
    Confidence Interval Estimate- Example  2 XX     2 XXStep 3 – Compute and 2 XX  Next slide: Confidence Interval Estimate - Example
  • 22.
    Confidence Interval Estimate- Example Step 4 – Use the formula above by substituting the numbers computed in previous slides Thus, the 95 percent confidence interval for the average sales of all sales representatives who make 25 calls is from 40.9170 up to 56.1882 copiers. Next slide: Prediction Interval Estimate - Example
  • 23.
    Prediction Interval Estimate- Example We return to the Copier Sales of America illustration. Determine a 95 percent prediction interval for Sheila Baker, a West Coast sales representative who made 25 calls. Next slide: Prediction Interval Estimate - Example
  • 24.
    Prediction Interval Estimate- Example Step 1 – Compute the point estimate of Y In other words, determine the number of copiers we expect a sales representative to sell if he or she makes 25 calls. 5526.48 )25(1842.19476.18 1842.19476.18 :isequationregressionThe ^ ^ ^    Y Y XY Next slide: Prediction Interval Estimate - Example
  • 25.
    Step 2 –Using the information computed earlier in the confidence interval estimation example, use the formula above. If Sheila Baker makes 25 sales calls, the number of copiers she will sell will be between about 24 and 73 copiers. Prediction Interval Estimate - Example Next slide: Real Life Applications
  • 26.
    Next slide: CalculatingValues at Housing Business
  • 27.
    Example 1: CalculatingValues at Housing Business Next slide: Calculating Values at Housing Business Sizes and Prices of Eighteen Houses X= Size Y=Price X= Size Y= Price 1.8 32 2.3 44 1.0 24 1.4 27 1.7 27 3.3 50 1.2 25 2.2 37 2.8 47 1.5 28 1.7 30 1.1 20 2.5 43 2.0 38 3.6 52 2.6 45
  • 28.
    Calculating Values atHousing Business Next slide: Relation between age and income Here, Y = a + bx Price = 9.253 + 12.873(Size) X= Size Y= Price
  • 29.
    Example 2: Relationbetween age and income Next slide: Relation between age and income
  • 30.
    Relation between ageand income Next slide: Thank You Here, Y = a + bx Income = 22.88 - 0.05834 (Age) X= Age Y= Income