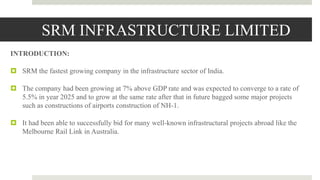
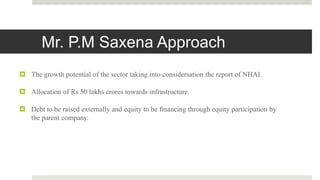
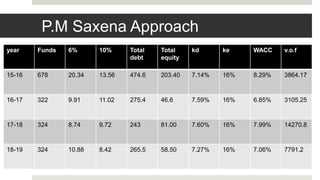
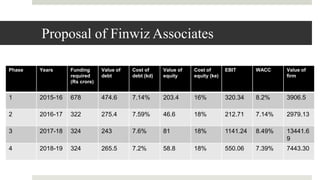
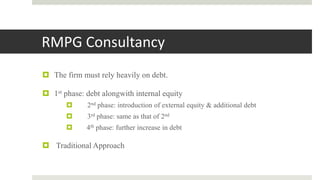
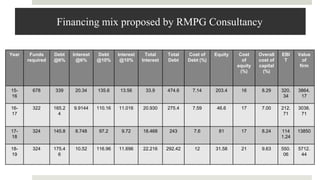
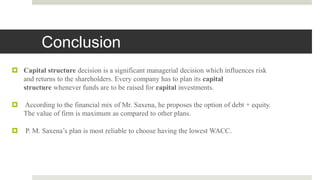
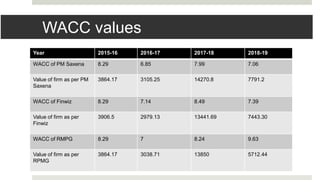
PRESENTATION ON ADVANCED
FINANCIAL MANAGEMENT
SUBMITTED BY:
Sheetal Verma
SRM INFRASTRUCTURE LIMITED
INTRODUCTION:
 SRM the fastest growing company in the infrastructure sector of India.
 The company had been growing at 7% above GDP rate and was expected to converge to a rate of
5.5% in year 2025 and to grow at the same rate after that in future bagged some major projects
such as constructions of airports construction of NH-1.
 It had been able to successfully bid for many well-known infrastructural projects abroad like the
Melbourne Rail Link in Australia.
Mr. P.M Saxena Approach
 The growth potential of the sector taking into considersation the report of NHAI.
 Allocation of Rs 50 lakhs crores towards infrastructure.
 Debt to be raised externally and equity to be financing through equity participation by
the parent company.
P.M Saxena Approach
year Funds 6% 10% Total
debt
Total
equity
kd ke WACC v.o.f
15-16 678 20.34 13.56 474.6 203.40 7.14% 16% 8.29% 3864.17
16-17 322 9.91 11.02 275.4 46.6 7.59% 16% 6.85% 3105.25
17-18 324 8.74 9.72 243 81.00 7.60% 16% 7.99% 14270.8
18-19 324 10.88 8.42 265.5 58.50 7.27% 16% 7.06% 7791.2
Finwiz Associates
 Finwiz associates worked upon the debt- equity mix .
 They believed that the company should rely on debt to equity along with internal equity.
 Also there are some potential investors who willing to invest in infrastructure company.
 ROE- 20-35%.
 Internal equity in First year.
 Debt raise in second year.
 Help in leverage for the company, and increase the debt-equity ratio(75:25).
Proposal of Finwiz Associates
Phase Years Funding
required
(Rs crore)
Value of
debt
Cost of
debt (kd)
Value of
equity
Cost of
equity (ke)
EBIT WACC Value of
firm
1 2015-16 678 474.6 7.14% 203.4 16% 320.34 8.2% 3906.5
2 2016-17 322 275.4 7.59% 46.6 18% 212.71 7.14% 2979.13
3 2017-18 324 243 7.6% 81 18% 1141.24 8.49% 13441.6
9
4 2018-19 324 265.5 7.2% 58.8 18% 550.06 7.39% 7443.30
RMPG Consultancy
 The firm must rely heavily on debt.
 1st phase: debt alongwith internal equity
 2nd phase: introduction of external equity & additional debt
 3rd phase: same as that of 2nd
 4th phase: further increase in debt
 Traditional Approach
Financing mix proposed by RMPG Consultancy
Year Funds
required
Debt
@6%
Interest
@6%
Debt
@10%
Interest
@10%
Total
Interest
Total
Debt
Cost of
Debt (%)
Equity Cost
of
equity
(%)
Overall
cost of
capital
(%)
EBI
T
Value
of
firm
15-
16
678 339 20.34 135.6 13.56 33.9 474.6 7.14 203.4 16 8.29 320.
34
3864.
17
16-
17
322 165.2
4
9.9144 110.16 11.016 20.930 275.4 7.59 46.6 17 7.00 212.
71
3038.
71
17-
18
324 145.8 8.748 97.2 9.72 18.468 243 7.6 81 17 8.24 114
1.24
13850
18-
19
324 175.4
6
10.52 116.96 11.696 22.216 292.42 12 31.58 21 9.63 550.
06
5712.
44
Conclusion
 Capital structure decision is a significant managerial decision which influences risk
and returns to the shareholders. Every company has to plan its capital
structure whenever funds are to be raised for capital investments.
 According to the financial mix of Mr. Saxena, he proposes the option of debt + equity.
The value of firm is maximum as compared to other plans.
 P. M. Saxena’s plan is most reliable to choose having the lowest WACC.
WACC values
Year 2015-16 2016-17 2017-18 2018-19
WACC of PM Saxena 8.29 6.85 7.99 7.06
Value of firm as per PM
Saxena
3864.17 3105.25 14270.8 7791.2
WACC of Finwiz 8.29 7.14 8.49 7.39
Value of firm as per
Finwiz
3906.5 2979.13 13441.69 7443.30
WACC of RMPG 8.29 7 8.24 9.63
Value of firm as per
RPMG
3864.17 3038.71 13850 5712.44
Thank You…

presentation on Advanced financial management

  • 1.
    PRESENTATION ON ADVANCED FINANCIALMANAGEMENT SUBMITTED BY: Sheetal Verma
  • 2.
    SRM INFRASTRUCTURE LIMITED INTRODUCTION: SRM the fastest growing company in the infrastructure sector of India.  The company had been growing at 7% above GDP rate and was expected to converge to a rate of 5.5% in year 2025 and to grow at the same rate after that in future bagged some major projects such as constructions of airports construction of NH-1.  It had been able to successfully bid for many well-known infrastructural projects abroad like the Melbourne Rail Link in Australia.
  • 3.
    Mr. P.M SaxenaApproach  The growth potential of the sector taking into considersation the report of NHAI.  Allocation of Rs 50 lakhs crores towards infrastructure.  Debt to be raised externally and equity to be financing through equity participation by the parent company.
  • 4.
    P.M Saxena Approach yearFunds 6% 10% Total debt Total equity kd ke WACC v.o.f 15-16 678 20.34 13.56 474.6 203.40 7.14% 16% 8.29% 3864.17 16-17 322 9.91 11.02 275.4 46.6 7.59% 16% 6.85% 3105.25 17-18 324 8.74 9.72 243 81.00 7.60% 16% 7.99% 14270.8 18-19 324 10.88 8.42 265.5 58.50 7.27% 16% 7.06% 7791.2
  • 5.
    Finwiz Associates  Finwizassociates worked upon the debt- equity mix .  They believed that the company should rely on debt to equity along with internal equity.  Also there are some potential investors who willing to invest in infrastructure company.  ROE- 20-35%.  Internal equity in First year.  Debt raise in second year.  Help in leverage for the company, and increase the debt-equity ratio(75:25).
  • 6.
    Proposal of FinwizAssociates Phase Years Funding required (Rs crore) Value of debt Cost of debt (kd) Value of equity Cost of equity (ke) EBIT WACC Value of firm 1 2015-16 678 474.6 7.14% 203.4 16% 320.34 8.2% 3906.5 2 2016-17 322 275.4 7.59% 46.6 18% 212.71 7.14% 2979.13 3 2017-18 324 243 7.6% 81 18% 1141.24 8.49% 13441.6 9 4 2018-19 324 265.5 7.2% 58.8 18% 550.06 7.39% 7443.30
  • 7.
    RMPG Consultancy  Thefirm must rely heavily on debt.  1st phase: debt alongwith internal equity  2nd phase: introduction of external equity & additional debt  3rd phase: same as that of 2nd  4th phase: further increase in debt  Traditional Approach
  • 8.
    Financing mix proposedby RMPG Consultancy Year Funds required Debt @6% Interest @6% Debt @10% Interest @10% Total Interest Total Debt Cost of Debt (%) Equity Cost of equity (%) Overall cost of capital (%) EBI T Value of firm 15- 16 678 339 20.34 135.6 13.56 33.9 474.6 7.14 203.4 16 8.29 320. 34 3864. 17 16- 17 322 165.2 4 9.9144 110.16 11.016 20.930 275.4 7.59 46.6 17 7.00 212. 71 3038. 71 17- 18 324 145.8 8.748 97.2 9.72 18.468 243 7.6 81 17 8.24 114 1.24 13850 18- 19 324 175.4 6 10.52 116.96 11.696 22.216 292.42 12 31.58 21 9.63 550. 06 5712. 44
  • 9.
    Conclusion  Capital structuredecision is a significant managerial decision which influences risk and returns to the shareholders. Every company has to plan its capital structure whenever funds are to be raised for capital investments.  According to the financial mix of Mr. Saxena, he proposes the option of debt + equity. The value of firm is maximum as compared to other plans.  P. M. Saxena’s plan is most reliable to choose having the lowest WACC.
  • 10.
    WACC values Year 2015-162016-17 2017-18 2018-19 WACC of PM Saxena 8.29 6.85 7.99 7.06 Value of firm as per PM Saxena 3864.17 3105.25 14270.8 7791.2 WACC of Finwiz 8.29 7.14 8.49 7.39 Value of firm as per Finwiz 3906.5 2979.13 13441.69 7443.30 WACC of RMPG 8.29 7 8.24 9.63 Value of firm as per RPMG 3864.17 3038.71 13850 5712.44
  • 11.