The document provides information about The Walt Disney Company, including:
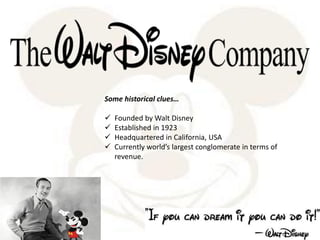
- It was founded in 1923 by Walt Disney and is headquartered in California.
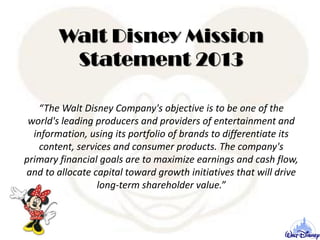
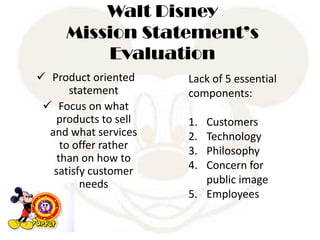
- Its vision is "To make people happy" and its mission is to be a leading producer of entertainment and information.
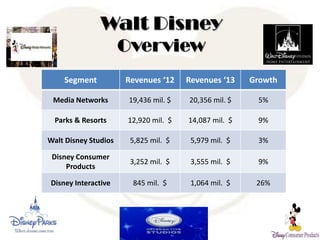
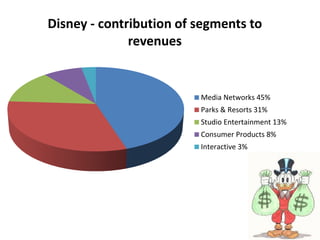
- Its largest segments are Media Networks, Parks & Resorts, and Studio Entertainment.
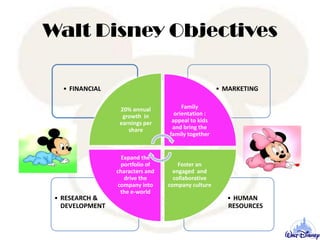
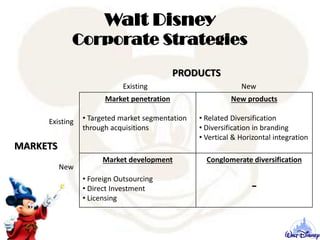
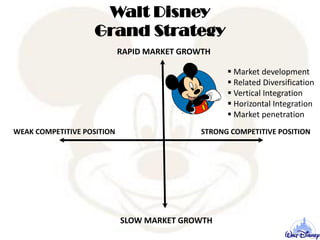
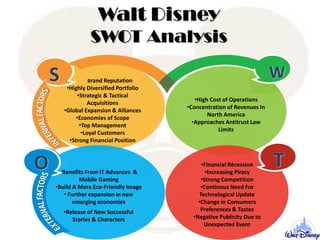
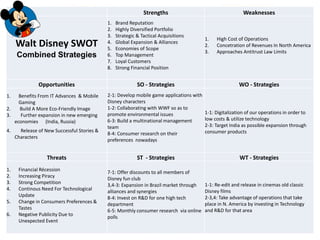
- It has a diversified portfolio and pursues strategies like acquisitions, global expansion, and diversification.


![The walt disney company review 2 [autosaved]](https://cdn.slidesharecdn.com/ss_thumbnails/thewaltdisneycompanyreview2autosaved-160415081405-thumbnail.jpg?width=640&height=640&fit=bounds)
