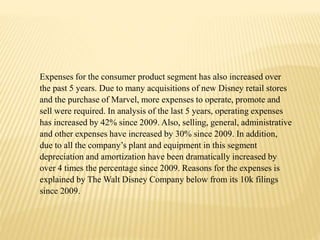
SlideShare a Scribd company logo
1 of 72
Disney is the Largest Media and Entertainment Company
In The World .The Walt Disney Company was founded on
October 16, 1923 in Los Angeles, California by brothers
Walter Elias Disney and Roy Disney.
Walt Disney was the voice of Mickey Mouse for two
decades. Walter Elias Disney was born in Chicago, Illinois
on December 5, 1901.
 The Walt Disney company have its headquarter in
Burbank, California. the president and CEO of the
company is Robert lger since 2005 and chairman is John
E. Pepper, Jr.Walt Disney first motion picture in 1928
short titled "Steam boat International sales of Disney-
branded products now out strip US sale Walt Disney won
a total of 32 Oscar Awards- more than anyone else ever
has!- during his 43 year career.
 Walt arrived in California in the summer of 1923 with
dreams and determination, but little else. On October 16,
1923, a New York distributor, M. J. Winkler, contracted
to release the Alice Comedies, and this date became the
formal beginning of The Walt Disney Company.
Originally known as the Disney Brothers Cartoon
Studio.
 With his chief animator, Ub Iwerks, Walt designed a mouse
whom Walt first wanted to name Mortimer, but his wife Lilly
preferred Mickey. And so a star was born. November 18,
1928, Walt Disney soon produced another series -- the Silly
Symphonies. a Silly Symphony and the first full-color
cartoon, won the Academy Award for Best Cartoon for 1932,
the first year that the Academy offered such a category. For
the rest of that decade, a Disney cartoon won the Oscar every
year.
WALT DISNEY MOTION PICTURES GROUP
 Walt Disney Motion Pictures Group, Inc. is a corporation
which develops scripts and oversees theatrical
production for The Walt Disney Company's production
companies was initiated in 1998 .
WALT DISNEY PARKS AND RESORTS
 The Parks and Resorts division was founded in 1971
.The chairman of Walt Disney Parks and Resorts is
Thomas O. Staggs . In 2009, the company's theme parks
hosted approximately 119.1 million guests, making
Disney Parks the worlds most visited theme park
company ever.
DISNEY LAND RESORT
 Disney land was dedicated as a single park by Walt
Disney on July 17, 1955, and opened to the public on
July 18, 1955 in Anaheim, California .It consist of two
hotels, one new and one themed; and the Downtown
Disney retail, dining and entertainment district.
 Walt Disney died December 15, 1966 .Roy was
determined to realize his brothers vision, and
honored him by naming it Walt Disney World. It
opened October 1, 1971 with a Disneyland-style
theme park, hotels, campgrounds, golf courses,
shopping villages and a monorail connecting
them all.
MISSION AND VISION
Walt Disney Company's mission is to be one
of the world's leading producers and
providers of entertainment and information
using an portfolio of brands to differentiate
our content, services and consumer
products. We seek to develop the most
creative innovative and profitable
entertainment experiences and related
projects in the world.
STRATEGY
 When Disney makes a movie today, the
company thinks beyond the motion
picture to how the story can be
leveraged into merchandise,
experiences, and spin-offs. It's not just
a film: it's a theme park ride, a chapter
in a larger saga, an action figure, a
musical on ice. Every new investment/
acquisition is strategically chosen and
usually assists at least one of it’s its
five market segments.
TIMES AND CONDITIONS CHANGE SO RAPIDLY THAT
WE MUST KEEP OUR AIM CONSTANTLY FOCUSED ON
THE FUTURE.
 I do not like to repeat successes, I like
to go on to other things.
ACQUISITIONS
 2009 Marvel
 2009 Disney joins Hulu venture
 2011 Disney acquires 49% of seven tv
 2012 Lucasfilm Ltd
 Disney has announced it’s intentions to sell
23 of it’s 24 U.S based radio Disney stations.
FINANCIAL BACKGROUND
 Media Networks segment includes broadcast and cable
television networks, television production operations,
television distribution, domestic television stations and radio
networks and stations
 Total media network accounted for:
 5 percent of the revenues in 2012 versus 2013 and 4 percent
in 2013 versus 2014.
 3 percent change of segmented operating income (LOSS) in
2012 versus 2013 and 7 percent change in 2013 versus 2014.
2010 AND 2011
 affiliate fees increased by six percent (6%)
 14 percent increase in cable networks and 6 percent in
broadcasting
 13 percent increase was due switching price levels between studio
entertainment and media networks
 decrease in costs and expenses by 208 million dollars in 2011 due
to the absence of FIFA World cup
 operating income to increase by an impressive 20%
2011 AND 2012
 Affiliate fees increased by six percent (6%)
 Increase in revenue from cable networks of 263 million
and a decrease in broadcasting of 162 million
 Operating expenses increased to by 231 million
 production also decreased by 128 million due to the
absence of Oprah Winfrey show
2013 AND 2014
 total revenues form media networks increased by four percent (4% - form
20,356 to 21,152)
 Affiliate Fees which increased by six percent (6%)
 revenues increased by 75 Million due to “the inclusion of revenues from Maker
Studios, Lucas film SVOD sales
 Equity from investments increased by 114 million
 operating expenses decreased by five percent (5%), and selling, general,
administrative and other expenses also increase
DISNEY MEDIA NETWORKS INCOME
STATEMENT
Year Ended
2014 2013 2012 2011 2010
(in millions) % Increase Better/Worse
Revenues
Affiliate Fees 6% 7% 6% 9% 9%
Advertising 1% 3% 1% 8% 7%
Other 3% 2% 4% 13% 8%
total renvenues 4% 5% 4% 9% 6%
Operating expenses 5% -7% -2% -5% -4%
Selling, general,
administrative and
other 5% -4% -1% -8% -2%
Depreciation and
amortization 3% -9% -7% -8%
Equity in the income of
investees 15% 18% 7% 33% -23%
Operating Income 7% 3% 8% 20% 8%
TOTAL REVENUES FOR MEDIA NETWORK TREND
ANALYSIS
FINANCIAL BACKGROUND
 Walt Disney World Resort in Florida, the Disneyland
Resort in California, Aulani, and Disney Resort & Spa in
Hawaii, the Disney Vacation Club, the Disney Cruise
Line and Adventures by Disney.
 It owns 51% in Disneyland Paris, 48% in Hong Kong
Disneyland Resort and 43% in Shanghai Disney Resort
2010 AND 2011
2010
 increased by 1 percent(from 94 million to 10.8 million)
 Operating income during this period was listed at 1,318 million
2011
 increases in domestic and international parks and resources totaling 10
percent
 3 percent of the international revenue decrease in value of of the US
dollars against the Euro
 Disney sold property at Disneyland Paris
 temporary closed the Tokyo Disney resort location due to an earthquake
in Japan in March 2011
 New hotel was also opened in Hawaii on August 2011.
2012, 2013, AND 2014
 The introduction of Cars Land at the California Disney adventures
 Resort reflected the 2011 impact from the earthquake and tsunami
in Japan
 the launch of Disney Fantasy in March 2012 and the opening of
Disney’s Art of Animation Resort in May 2012
 more guest in Hong Kong Disneyland resort offset by a decrease
in the nightly stays in Disneyland Paris
 increasing by 5 percent in guest spending
 1 percent increase in foreign currency as the US dollar continues
to decrease.
 Disneyland Paris also continues to decrease in volume.
PARKS AND RESORTS INCOME
STATEMENT
Year Ended
2014 2013 2012 2011 2010
(in millions) % Increase Better/Worse
Revenues
Domestic 8% 10% 11% 11%
International 3% 4% 3% 6% 6%
total renvenues 7% 9% 10% 10% 1%
Operating expenses -7% -8% -7% -9% -2%
Selling, general,
administrative and
other 5% -6% -9% -12% -3%
Depreciation and
amortization 7% -10% -7% -2% 1%
Operating Income 20% 17% 23% 18% -7%
TOTAL REVENUES TREND ANALYSIS
PARKS AND RESORT V.S MEDIA NETWORKS
2014 2013 2012 2011 2010
Media Networks
total renvenues 4% 5% 4% 9% 6%
Parks and Resorts
total renvenues 7% 9% 10% 10% 1%
STUDIO ENTERTAINMENT
DISNEY FILM STUDIOS
 Pixar Animation Studio
 Marvel Entertainment
 Disney Animated Studio
 Touchstone
 Lucasfilm
REVENUE
 Total Revenues from Studio Entertainment is
7.278 billion dollars
BOX OFFICE
Highest-grossing films of 2014
Rank Title Studio Worldwide gross
1
Transformers:
Age of Extinction
Paramount
Pictures
$1,104,039,076
2
The Hobbit: The
Battle of the Five
Armies
Warner
Bros. / New Line
Cinema / MGM
$956,019,788
3
Guardians of the
Galaxy
Marvel Studios $774,176,600
4 Maleficent
Walt Disney
Pictures
$758,410,378
5
The Hunger
Games:
Mockingjay – Part
1
Lionsgate Films $755,356,711
6
X-Men: Days of
Future Past
20th Century Fox $748,121,534
7
Captain America:
The Winter
Soldier
Marvel Studios $714,766,572
8
The Amazing
Spider-Man 2
Columbia Pictures $708,982,323
9
Dawn of the
Planet of the Apes
20th Century Fox $708,835,589
10 Interstellar
Paramount
Pictures / Warner
Bros.
$675,020,017
MAGIC TOUCH
 Disney Frozen accounts for 1.274 billion
dollar at the box office.
 Budget of 150 million dollars
 Grossing 1.124 billion dollars
DISNEY BOX OFFICE
Notable Box Office Numbers
 Pixar: Planes gross of 189.3 million dollars
 Pixar: Monsters University gross of 543.6 million
dollars
 Marvel: Captain America 2 gross of 544.8
 Marvel: Thor: The Dark World gross of 474.8 million
dollars
THE CONSUMER PRODUCTS
Sector
The Consumer Products sector is the
4th profitable segment of The Walt
Disney Company. It handles the
merchandise licensing, publishing and
the retail of all of the property that the
company creates, designs and
develops.
Merchandise
Licensing
The Company licenses a wide mixture of
products that include everything that
consumers use from apparel, home
goods, and food to toys, electronics and
health and beauty goods.
It licenses characters from all its company
properties such as its films and television
shows for use on third-party products and
earn revenue from the royalties on these
products; revenue is from either a fixed
percentage of the wholesale cost or from the
retail selling price.
Merchandise
Licensing
Publishing
The Company’s publishing business called Disney Publishing
Worldwide creates, licenses, publish, and also distributes
children books, magazines and learning products in all forms
of communication and within multiple countries and
languages. Disney Publishing Worldwide also operates,
develop and delivers Disney English, which offers an English
language program to Chinese youth across 9 cites of China.
Publishing
In addition, Disney’s 2nd publishing business called
Marvel Publishing also creates and publishes comic
books and graphic novel collections of comic
books in both print and digital forms. Marvel
Publishing also licenses the rights to translate these
comic books in mostly European and Latin
American countries.
Retail
As for the Disney retail stores, the
company markets all of its Lucas
films, Disney and Marvel-themed
products within its stores and
through internet sites.
The Walt Disney Company currently
owns and operates over 328 retail stores
with 64 percent of them located all
across North America.
Lets Talk Money!
Through these 3 divisions, the consumer
products segment earns revenues from sales
of its merchandise in both retail stores and
online sites, the wholesale profits from
publishing all its books and magazines,
licensing it characters, and from earning
usage fees from its English learning centers.
Operating income for the consumer products segment
increases by the millions annually. Based on a trend analysis
of the last 5 years using the company’s 10-k filings, its
revenues has increased by over double the percentage since
2009. A big element that produced most of this segment’s
profits is its licensing and publishing; it increased
astonishingly by 60 percent since 2009. And even though
licensing and publishing accounts for most of the revenue, the
company’s retail and other sources of revenue has played a
big factor as well with an increase of 72% since 2009.
CONSUMER PRODUCTS
Operating results for the Consumer Products segment are as follows:
% of Change Better/
Worse(-) 2009 vs.
2012
Year Ended
(in millions)
29-Sep-12 1-Oct-11 2-Oct-10 3-Oct-09
Revenue
Licensing and publishing $2,056 $1,933 $1,725 $1,584 30%
Retail and other 1196 1116 953 841 42%
Total revenues 3252 3049 2678 2425 34%
Operating expenses -1514 -1452 -1236 -1182 -28%
Selling, general, administrative and other -686 -676 -687 -597 -15%
Depreciation and amortization -115 -105 -78 -39 95%
Operating Income/Loss(-) 937 816 677 607 54%
CONSUMER PRODUCTS
Operating results for the Consumer Products segment are as follows:
% of Change Better/
Worse(-) 2013 vs. 2014
Year Ended
(in millions)
27-Sep-14 28-Sep-13
Revenue
Licensing and publishing $2,538 $2,254 13%
Retail and other 1447 1301 11%
Total revenues 3985 3555 12%
Operating expenses -1683 -1566 -7%
Selling, general, administrative and other -778 -731 -6%
Depreciation and amortization -168 -146 -15%
Operating Income/Loss(-) 1356 1112 22%
Expenses for the consumer product segment has also increased over
the past 5 years. Due to many acquisitions of new Disney retail stores
and the purchase of Marvel, more expenses to operate, promote and
sell were required. In analysis of the last 5 years, operating expenses
has increased by 42% since 2009. Also, selling, general, administrative
and other expenses have increased by 30% since 2009. In addition,
due to all the company’s plant and equipment in this segment
depreciation and amortization have been dramatically increased by
over 4 times the percentage since 2009. Reasons for the expenses is
explained by The Walt Disney Company below from its 10k filings
since 2009.
THE INTERACTIVE
Sector
The interactive media sector is the 5th and the lowest profitable
segment of the company. This sector produces mobile, console and
virtual world games and is responsible for the designing and web
management for all the company’s businesses; it also licenses the
content for games and mobile devices and develops branded online
services. Some of the games developed and published by The
Company include, Disney Infinity which is a console game released
in 2014, Marvel Avengers Alliance which is a mobile device game
accessible on all smartphones, social networking websites and
tablets, and Disney’s Club Penguin which is a virtual world game.
The interactive media sector earns it revenue from sales of the
games to retailers and distributors; it gains revenue from micro
transactions within the virtual games and from subscription fees; it
earns revenue from licensing content to third-party game publishers
and mobile phone providers and also from online advertising and
sponsorships.
Within this interactive media segment, profits were at a
loss for about 4 fiscal years until 2014 fiscal year
primarily due to the company accumulating more
expenses than what it was earning. This segment loss
the most profit during 2010 to 2011 by 30 percent due to
the acquisition costs of Playdom, a social networking
game, for the year as stated in the cost and expenses
section of this sector. Although this occurred, total
revenue for the past 5 years since 2009 has increased by
82 percent due the impressive performance of Disney
Infinity 1.0 in the 2014 fiscal year.
INTERACTIVE MEDIA
Operating results for the Interactive segment are as follows:
% of Change Better/
Worse(-) 2009 vs.
2012
Year Ended
(in millions)
29-Sep-12 1-Oct-11 2-Oct-10 3-Oct-09
Revenue
Game sales and subscriptions $613 $768 $563 $565 9%
Advertising and other 232 214 198 147 58%
Total revenues 845 982 761 712 19%
Operating expenses -583 -675 -581 -623 7%
Selling, general, administrative and other -429 -561 -371 -336 -28%
Depreciation and amortization -49 -54 -43 -50 2%
Operating Income/Loss(-) -216 -308 -234 -292 35%
INTERACTIVE MEDIA
Operating results for the Interactive segment are as follows:
% of Change Better/ Worse(-) 2013 vs.
2014
Year Ended
(in millions) 27-Sep-14 28-Sep-13
Revenue
Games* $1,056 $812 30%
Other Content 243 252 -4%
Total revenues 1299 1064 22%
Operating expenses -700 -658 -6%
Selling, general, administrative and other -400 -449 -2%
Depreciation and amortization -23 -44 48%
Operating Income/Loss(-) 116 -87 nm
*Certain reclassifications have been made to the revenue amounts
presented for fiscal 2013 to conform to the fiscal 2014 presentation.
The principal change was to reclassify game-related revenue from our Japan
mobile business from Other content to Games.
INCOME STATEMENT
Fiscal year is October-September. All
values USD millions.
2010 2011 2012 2013 2014
Sales/Revenue 38.06B 40.89B 42.28B 45.04B 48.81B
Sales Growth - 7.44% 3.39% 6.54% 8.37%
Cost of Goods Sold (COGS) incl. D&A 31.44B 33.14B 33.23B 27.23B 28.71B
COGS excluding D&A 29.73B 31.3B 31.24B 25.03B 26.42B
Depreciation & Amortization
Expense
1.71B 1.84B 1.99B 2.19B 2.29B
Depreciation 1.6B 1.66B 1.78B 1.96B 2.06B
Amortization of Intangibles 111M 182M 203M 235M 224M
COGS Growth - 5.40% 0.29%
-
18.07
%
5.44%
Gross Income 6.62B 7.76B 9.05B 17.82B 20.11B
Gross Income Growth -
17.10
%
16.63
%
96.92
%
12.85
%
Gross Profit Margin - - - -
41.19
%
PROFITABILITY RATIOS
 Gross profit margins of 45.88%
 Operating profit margin of 23.64%
 Net profit margin of 16.4%
 Net return on total assets of 9.51%
 Return on stockholder equity of 17.8%
 Return on invested capital of 12.6%
ASSETS
Fiscal year is October-September. All
values USD millions.
2010 2011 2012 2013 2014
5-
year
trend
Cash & Short Term Investments 2.72B 3.19B 3.39B 3.93B 3.42B
Cash Only 2.72B 3.19B 3.39B 3.93B 3.42B
Short-Term Investments - - - - -
Total Accounts Receivable 5.78B 6.18B 6.54B 6.97B 7.82B
Accounts Receivables, Net 5.45B 5.95B 6.31B 6.69B 7.43B
Accounts Receivables, Gross 5.78B 6.21B 6.47B 6.85B 7.58B
Bad Debt/Doubtful Accounts (326M) (261M) (161M) (155M) (154M)
Other Receivables 330M 235M 227M 273M 394M
Inventories 1.44B 1.6B 1.54B 1.49B 1.57B
Finished Goods 0 0 0 0 0
Work in Progress 0 0 0 0 0
Raw Materials 0 0 0 0 0
Progress Payments & Other 1.44B 1.6B 1.54B 1.49B 1.57B
Other Current Assets 1.6B 2.12B 1.57B 1.72B 2.36B
Miscellaneous Current Assets 1.15B 1.67B 1.1B 1.28B 1.93B
Total Current Assets 11.55B 13.08B 13.03B 14.11B 15.18B
LIABILITIES
2010 2011 2012 2013 2014 5-year trend
ST Debt & Current Portion LT Debt 2.35B 3.06B 3.61B 1.51B 2.16B
Short Term Debt 0 0 0 0 0
Current Portion of Long Term Debt 2.35B 3.06B 3.61B 1.51B 2.16B
Accounts Payable 4.41B 4.55B 4.62B 4.9B 5.37B
Income Tax Payable - - - - -
Other Current Liabilities 4.24B 4.49B 4.58B 5.29B 5.76B
Dividends Payable - - - - -
Accrued Payroll 1.48B 1.47B 1.52B 1.63B 1.77B
Miscellaneous Current Liabilities 2.75B 3.02B 3.06B 3.67B 3.99B
Total Current Liabilities 11B 12.09B 12.81B 11.7B 13.29B
Long-Term Debt 10.35B 11.21B 10.98B 12.78B 12.68B
Long-Term Debt excl. Capitalized Leases 10.13B 10.92B 10.7B 12.78B 12.68B
Non-Convertible Debt 10.13B 10.92B 10.7B 12.78B 12.68B
Convertible Debt 0 0 0 0 0
Capitalized Lease Obligations 224M 288M 284M - -
Provision for Risks & Charges 3.38B 4.22B 4.83B 2.09B 3.48B
Deferred Taxes 2.63B 2.87B 2.25B 4.05B 4.1B
Deferred Taxes - Credit 2.63B 2.87B 2.25B 4.05B 4.1B
Deferred Taxes - Debit 0 0 0 0 0
Other Liabilities 2.5B 2.28B 2.07B 2.47B 2.46B
Other Liabilities (excl. Deferred Income) 2.26B 2.05B 1.85B 2.47B 2.46B
Deferred Income 244M 233M 220M - -
Total Liabilities 29.86B 32.67B 32.94B 33.09B 36.01B
LIQUIDITY RATIOS
 Current ratio of 114.17%
 Working Capital of 1.884 billion
LEVERAGE RATIOS
 Debt to equity of 50.57%
 Long-term debt to equity of 41.41%
SWOT ANALYSIS
Strengths:
Brand reputation
Disney has its well known brand name and
reputed status around the world. The
products of the Disney have been perceived
positively by the people because of its brand
reputation.
Has own Walt Disney studios (second largest media
conglomerate in terms of revenue)
Disney has its own studios which includes
Disney's motion picture studios, music labels,
theatrical production company, and distribution
companies.
Diversified business
Disney has variety of its productions and
extensions of its production units around the
world. For example, it has The Walt Disney
Studios, Disney Consumer Products and
Interactive Media, Walt Disney Parks and
Resorts, Disney Media Networks, Marvel
Entertainment etc.
Loyal customers
Disney has its millions of loyal customers that
it achieved through strong relationship and by
providing them maximum satisfaction from its
products.
Top management
Disney has experienced, well-trained,
enthusiastic and motivated top work force.
Strong financial position
Disney financially stands strong in the
competitive market and is able to continue its
company sustainably.
High quality
Disney is able to win people's positive
attitude towards it through consistent quality
productions.
Strong advertising
Disney has its strong advertising strategy
through which it is penetrating into the
markets, reaching to its potential customers,
and is gaining its popularity over rivals.
Weaknesses:
Decline of Cinemas
People are going less to the cinemas due
to the release of home theaters and
increasing ticket prices.
Changing viewership trends
The habits of people viewing the movies
have changed with the introduction of new
technologies. People are engaged in watching
movies on their smart phones, ipads, laptops
etc.
Lack of Access to Web viewership platforms
Inaccessibility of people to the web
viewership platforms puts the company away
from the potential customers and cannot achieve
the maximum benefits from the markets.
High operating cost
The operating cost of Disney is high in
maintaining the consistent quality
production.
frequent change in top management
The frequent changes in top management
make the management difficult to drive the company
at the same speed as before competing with the
rivals.
Opportunities:
Disney music channel
Growing popularity of Disney music channel
increases the scope and opportunity of Disney.
Disney school of management and training
institute conducts workshops, seminars,
presentations and special programs for professionals
enhancing their managerial skills.
Online websites
Now, the accessibility of online websites
helps to promote its business and reach to more
customers throughout the world.
Advancement in technology
Technological advancement and introduction of
the new techniques and equipment are increasing
efficiency of work and reducing operating costs.
Demographic changes
The change in demography such as
migration of population into an area adds
opportunity to a company to foster its
business.
Threats:
Changing animation trends
Change in animation trends and technologies
might change the taste of customers and they might
shift their old habits to the new one.
Strong competition
The increasing competition in the market
and entry of the new entrants might
increase the possibility of losing the
business.
Increasing piracy
Issue of copy rights, and increasing piracy
threats the company to lose its business.
Change in customers preferences and behaviors
People's preference and behavior change
with time and it is hard to predict whether a
company would be preferred by the customers for
long time or not.
Economic (recession/inflation/unemployment) condition
Unfavorable economic condition inside and
outside the country would affect the
company. The recession, inflation and
increasing unemployment rate have direct
impact to the company.
Increasing salaries and labor costs
The increasing salaries and labor cost in
the markets make the operation costs high
and reduce the company's overall income.
SUGGESTION
 Introduce More Parks
 Re-acquire Marvel Character from Sony
 Partnership with other animation studios
 Madhouse

More Related Content

What's hot

The Company Presentation - Walt Disney
The Company Presentation - Walt DisneyThe Company Presentation - Walt Disney
The Company Presentation - Walt DisneyNaveed Hassan
 
The Walt Disney Company Digital Marketing Strategy
The Walt Disney Company Digital Marketing StrategyThe Walt Disney Company Digital Marketing Strategy
The Walt Disney Company Digital Marketing StrategyEmmaYakima
 
Walt Disney - An analysis of the strategic challenges
Walt Disney - An analysis of the strategic challengesWalt Disney - An analysis of the strategic challenges
Walt Disney - An analysis of the strategic challengesGrigoris Papadopoulos
 
Disney presentation
Disney presentationDisney presentation
Disney presentationbina16
 
Presentation on Walt Disney
Presentation on Walt Disney Presentation on Walt Disney
Presentation on Walt Disney Rumana Rumu
 
The walt disney company
The walt disney companyThe walt disney company
The walt disney companyptoelle81
 
Swot analysis of The Walt Disney Company
Swot analysis of The Walt Disney CompanySwot analysis of The Walt Disney Company
Swot analysis of The Walt Disney CompanyBhavya Sharma
 
Walt Disney success story
Walt Disney success storyWalt Disney success story
Walt Disney success storyJishant1
 
Walt disney studios presentation
Walt disney studios presentationWalt disney studios presentation
Walt disney studios presentationjoshclarkee
 
Walt Disney
Walt Disney Walt Disney
Walt Disney erdarsh
 
walt disney strategy management
walt disney strategy managementwalt disney strategy management
walt disney strategy managementaditi sehgal
 

What's hot (20)

The Company Presentation - Walt Disney
The Company Presentation - Walt DisneyThe Company Presentation - Walt Disney
The Company Presentation - Walt Disney
 
The Walt Disney Company Digital Marketing Strategy
The Walt Disney Company Digital Marketing StrategyThe Walt Disney Company Digital Marketing Strategy
The Walt Disney Company Digital Marketing Strategy
 
Walt Disney - An analysis of the strategic challenges
Walt Disney - An analysis of the strategic challengesWalt Disney - An analysis of the strategic challenges
Walt Disney - An analysis of the strategic challenges
 
Disney presentation
Disney presentationDisney presentation
Disney presentation
 
DISNEY's Success Story
DISNEY's Success StoryDISNEY's Success Story
DISNEY's Success Story
 
Presentation on Walt Disney
Presentation on Walt Disney Presentation on Walt Disney
Presentation on Walt Disney
 
The walt disney company
The walt disney companyThe walt disney company
The walt disney company
 
Presentation disney (1)
Presentation disney (1)Presentation disney (1)
Presentation disney (1)
 
Swot analysis of The Walt Disney Company
Swot analysis of The Walt Disney CompanySwot analysis of The Walt Disney Company
Swot analysis of The Walt Disney Company
 
Walt disney ppt
Walt disney pptWalt disney ppt
Walt disney ppt
 
Walt Disney success story
Walt Disney success storyWalt Disney success story
Walt Disney success story
 
Walt disney studios presentation
Walt disney studios presentationWalt disney studios presentation
Walt disney studios presentation
 
Walt Disney
Walt Disney Walt Disney
Walt Disney
 
The Brand "Disney"
The Brand "Disney"The Brand "Disney"
The Brand "Disney"
 
Disney Presentation
Disney PresentationDisney Presentation
Disney Presentation
 
Walt disney
Walt disneyWalt disney
Walt disney
 
walt disney strategy management
walt disney strategy managementwalt disney strategy management
walt disney strategy management
 
Walt disney
Walt disneyWalt disney
Walt disney
 
Walt disney ppt
Walt disney pptWalt disney ppt
Walt disney ppt
 
Walt disney
Walt disneyWalt disney
Walt disney
 

Viewers also liked

Mk0018 international marketing
Mk0018 international marketingMk0018 international marketing
Mk0018 international marketingconsult4solutions
 
Pm0010 introduction to project management
Pm0010 introduction to project managementPm0010 introduction to project management
Pm0010 introduction to project managementconsult4solutions
 
Planificacion de proyectos
Planificacion de proyectosPlanificacion de proyectos
Planificacion de proyectosKathia Chiquita
 
Internship Synopsis
Internship SynopsisInternship Synopsis
Internship SynopsisAaqib Jamal
 
Мастер-класс "Украшение для коробки конфет"
Мастер-класс "Украшение для коробки конфет"Мастер-класс "Украшение для коробки конфет"
Мастер-класс "Украшение для коробки конфет"arzmary
 
Act3 equipo31e
Act3 equipo31eAct3 equipo31e
Act3 equipo31ebredka
 
Presentacion power point
Presentacion power pointPresentacion power point
Presentacion power pointedwinjhonvera
 
Always examine the tool for damages before use
Always examine the tool for damages before useAlways examine the tool for damages before use
Always examine the tool for damages before usestevencas21
 
Presentasi NESIA Terbaru 22 Februari 2016 www.dream4freedom.co
Presentasi NESIA Terbaru 22 Februari 2016 www.dream4freedom.coPresentasi NESIA Terbaru 22 Februari 2016 www.dream4freedom.co
Presentasi NESIA Terbaru 22 Februari 2016 www.dream4freedom.codeniarya
 
MSS Curriculum Night 6th Grade Presentation
MSS Curriculum Night 6th Grade PresentationMSS Curriculum Night 6th Grade Presentation
MSS Curriculum Night 6th Grade Presentationsmay711
 
Aðskilnaður fjárfestingarbanka og viðskiptabanka x1
Aðskilnaður fjárfestingarbanka og viðskiptabanka x1Aðskilnaður fjárfestingarbanka og viðskiptabanka x1
Aðskilnaður fjárfestingarbanka og viðskiptabanka x1fvh2015
 

Viewers also liked (19)

Mk0018 international marketing
Mk0018 international marketingMk0018 international marketing
Mk0018 international marketing
 
Pm0010 introduction to project management
Pm0010 introduction to project managementPm0010 introduction to project management
Pm0010 introduction to project management
 
Planificacion de proyectos
Planificacion de proyectosPlanificacion de proyectos
Planificacion de proyectos
 
L'isolation thermique
L'isolation thermiqueL'isolation thermique
L'isolation thermique
 
Internship Synopsis
Internship SynopsisInternship Synopsis
Internship Synopsis
 
Мастер-класс "Украшение для коробки конфет"
Мастер-класс "Украшение для коробки конфет"Мастер-класс "Украшение для коробки конфет"
Мастер-класс "Украшение для коробки конфет"
 
Act3 equipo31e
Act3 equipo31eAct3 equipo31e
Act3 equipo31e
 
Mb0049 project management
Mb0049 project managementMb0049 project management
Mb0049 project management
 
basic
basicbasic
basic
 
Presentacion power point
Presentacion power pointPresentacion power point
Presentacion power point
 
Ayn rand az ősforrás
Ayn rand   az ősforrásAyn rand   az ősforrás
Ayn rand az ősforrás
 
Always examine the tool for damages before use
Always examine the tool for damages before useAlways examine the tool for damages before use
Always examine the tool for damages before use
 
پروپزال
پروپزالپروپزال
پروپزال
 
Presentasi NESIA Terbaru 22 Februari 2016 www.dream4freedom.co
Presentasi NESIA Terbaru 22 Februari 2016 www.dream4freedom.coPresentasi NESIA Terbaru 22 Februari 2016 www.dream4freedom.co
Presentasi NESIA Terbaru 22 Februari 2016 www.dream4freedom.co
 
Penguat transistor
Penguat transistorPenguat transistor
Penguat transistor
 
MSS Curriculum Night 6th Grade Presentation
MSS Curriculum Night 6th Grade PresentationMSS Curriculum Night 6th Grade Presentation
MSS Curriculum Night 6th Grade Presentation
 
Aðskilnaður fjárfestingarbanka og viðskiptabanka x1
Aðskilnaður fjárfestingarbanka og viðskiptabanka x1Aðskilnaður fjárfestingarbanka og viðskiptabanka x1
Aðskilnaður fjárfestingarbanka og viðskiptabanka x1
 
Diapositivas
DiapositivasDiapositivas
Diapositivas
 
Internship presentation
Internship presentationInternship presentation
Internship presentation
 

Similar to Disney Power point

Walt Disney Company, 2013 www.disney.com , DIS Headqua.docx
Walt Disney Company, 2013 www.disney.com , DIS Headqua.docxWalt Disney Company, 2013 www.disney.com , DIS Headqua.docx
Walt Disney Company, 2013 www.disney.com , DIS Headqua.docxcelenarouzie
 
Walt Disney Case Study (R).pptx
Walt Disney Case Study (R).pptxWalt Disney Case Study (R).pptx
Walt Disney Case Study (R).pptxgovindthakkar1
 
6_3_Case_Analysis_The_Walt_Disney_Compan.docx
6_3_Case_Analysis_The_Walt_Disney_Compan.docx6_3_Case_Analysis_The_Walt_Disney_Compan.docx
6_3_Case_Analysis_The_Walt_Disney_Compan.docxSoheirRizk
 
The walt disney company review 2 [autosaved]
The walt disney company review 2 [autosaved]The walt disney company review 2 [autosaved]
The walt disney company review 2 [autosaved]Luke Blackman
 
Strategic Diversification of Walt Disney
Strategic Diversification of Walt DisneyStrategic Diversification of Walt Disney
Strategic Diversification of Walt DisneySiva Shankar Biswal
 
Financial Analysis Project
Financial Analysis ProjectFinancial Analysis Project
Financial Analysis ProjectMinh Chau Bui
 
Calvin Klien - Fashion on board : 2022 | The Enterprise World
Calvin Klien - Fashion on board : 2022 | The Enterprise WorldCalvin Klien - Fashion on board : 2022 | The Enterprise World
Calvin Klien - Fashion on board : 2022 | The Enterprise WorldTheEnterpriseWorld
 
Strategic ManagementFinal Case StudyAndrea BarilAs.docx
Strategic ManagementFinal Case StudyAndrea BarilAs.docxStrategic ManagementFinal Case StudyAndrea BarilAs.docx
Strategic ManagementFinal Case StudyAndrea BarilAs.docxsusanschei
 
Strategic ManagementFinal Case StudyAndrea BarilAs.docx
Strategic ManagementFinal Case StudyAndrea BarilAs.docxStrategic ManagementFinal Case StudyAndrea BarilAs.docx
Strategic ManagementFinal Case StudyAndrea BarilAs.docxrjoseph5
 
Understanding television and film industries
Understanding television and film industriesUnderstanding television and film industries
Understanding television and film industriesMusicalPotato
 
Going Below the Waterline for Strategic Change
Going Below the Waterline for Strategic ChangeGoing Below the Waterline for Strategic Change
Going Below the Waterline for Strategic ChangeDr. Herbert Thweatt
 
Unit 8 assignment 1b
Unit 8   assignment 1b Unit 8   assignment 1b
Unit 8 assignment 1b Lucasjwarren
 
1. MGMT 461-Cross CulturalManagementKatherine Rosen.docx
1.  MGMT 461-Cross CulturalManagementKatherine Rosen.docx1.  MGMT 461-Cross CulturalManagementKatherine Rosen.docx
1. MGMT 461-Cross CulturalManagementKatherine Rosen.docxmonicafrancis71118
 
Michael Eisner's Disney
Michael Eisner's DisneyMichael Eisner's Disney
Michael Eisner's DisneyTahia
 

Similar to Disney Power point (20)

Walt Disney Company, 2013 www.disney.com , DIS Headqua.docx
Walt Disney Company, 2013 www.disney.com , DIS Headqua.docxWalt Disney Company, 2013 www.disney.com , DIS Headqua.docx
Walt Disney Company, 2013 www.disney.com , DIS Headqua.docx
 
Walt Disney Case Study (R).pptx
Walt Disney Case Study (R).pptxWalt Disney Case Study (R).pptx
Walt Disney Case Study (R).pptx
 
P1
P1P1
P1
 
6_3_Case_Analysis_The_Walt_Disney_Compan.docx
6_3_Case_Analysis_The_Walt_Disney_Compan.docx6_3_Case_Analysis_The_Walt_Disney_Compan.docx
6_3_Case_Analysis_The_Walt_Disney_Compan.docx
 
The walt disney company review 2 [autosaved]
The walt disney company review 2 [autosaved]The walt disney company review 2 [autosaved]
The walt disney company review 2 [autosaved]
 
P1 walt disney
P1   walt disneyP1   walt disney
P1 walt disney
 
Strategic Diversification of Walt Disney
Strategic Diversification of Walt DisneyStrategic Diversification of Walt Disney
Strategic Diversification of Walt Disney
 
Financial Analysis Project
Financial Analysis ProjectFinancial Analysis Project
Financial Analysis Project
 
Calvin Klien - Fashion on board : 2022 | The Enterprise World
Calvin Klien - Fashion on board : 2022 | The Enterprise WorldCalvin Klien - Fashion on board : 2022 | The Enterprise World
Calvin Klien - Fashion on board : 2022 | The Enterprise World
 
Strategic ManagementFinal Case StudyAndrea BarilAs.docx
Strategic ManagementFinal Case StudyAndrea BarilAs.docxStrategic ManagementFinal Case StudyAndrea BarilAs.docx
Strategic ManagementFinal Case StudyAndrea BarilAs.docx
 
Strategic ManagementFinal Case StudyAndrea BarilAs.docx
Strategic ManagementFinal Case StudyAndrea BarilAs.docxStrategic ManagementFinal Case StudyAndrea BarilAs.docx
Strategic ManagementFinal Case StudyAndrea BarilAs.docx
 
Understanding television and film industries
Understanding television and film industriesUnderstanding television and film industries
Understanding television and film industries
 
Going Below the Waterline for Strategic Change
Going Below the Waterline for Strategic ChangeGoing Below the Waterline for Strategic Change
Going Below the Waterline for Strategic Change
 
Disney
DisneyDisney
Disney
 
Unit 8 assignment 1b
Unit 8   assignment 1b Unit 8   assignment 1b
Unit 8 assignment 1b
 
1. MGMT 461-Cross CulturalManagementKatherine Rosen.docx
1.  MGMT 461-Cross CulturalManagementKatherine Rosen.docx1.  MGMT 461-Cross CulturalManagementKatherine Rosen.docx
1. MGMT 461-Cross CulturalManagementKatherine Rosen.docx
 
Walt disney ppt
Walt disney pptWalt disney ppt
Walt disney ppt
 
Disney
DisneyDisney
Disney
 
Michael Eisner's Disney
Michael Eisner's DisneyMichael Eisner's Disney
Michael Eisner's Disney
 
Demand and supply
Demand and supplyDemand and supply
Demand and supply
 

More from MD RUHUL QUDDUS

More from MD RUHUL QUDDUS (13)

Industry-Champion
Industry-ChampionIndustry-Champion
Industry-Champion
 
mkt p
mkt pmkt p
mkt p
 
Presentation (Most Wanted)
Presentation (Most Wanted)Presentation (Most Wanted)
Presentation (Most Wanted)
 
netflix
netflixnetflix
netflix
 
Group Project
Group ProjectGroup Project
Group Project
 
Apple Presentation Final-20151210-151407512
Apple Presentation Final-20151210-151407512Apple Presentation Final-20151210-151407512
Apple Presentation Final-20151210-151407512
 
17 iiuc sem 3.PDF
17 iiuc sem 3.PDF17 iiuc sem 3.PDF
17 iiuc sem 3.PDF
 
16 iiuc sem 2.PDF
16 iiuc sem 2.PDF16 iiuc sem 2.PDF
16 iiuc sem 2.PDF
 
15 iiuc sem 1.PDF
15 iiuc sem 1.PDF15 iiuc sem 1.PDF
15 iiuc sem 1.PDF
 
14 iiuc testimonial.PDF
14 iiuc testimonial.PDF14 iiuc testimonial.PDF
14 iiuc testimonial.PDF
 
executives care.PDF
executives care.PDFexecutives care.PDF
executives care.PDF
 
shakat ofer lettter
shakat ofer letttershakat ofer lettter
shakat ofer lettter
 
shakat ofer lettter
shakat ofer letttershakat ofer lettter
shakat ofer lettter
 

Disney Power point

  • 1. Disney is the Largest Media and Entertainment Company In The World .The Walt Disney Company was founded on October 16, 1923 in Los Angeles, California by brothers Walter Elias Disney and Roy Disney. Walt Disney was the voice of Mickey Mouse for two decades. Walter Elias Disney was born in Chicago, Illinois on December 5, 1901.
  • 2.  The Walt Disney company have its headquarter in Burbank, California. the president and CEO of the company is Robert lger since 2005 and chairman is John E. Pepper, Jr.Walt Disney first motion picture in 1928 short titled "Steam boat International sales of Disney- branded products now out strip US sale Walt Disney won a total of 32 Oscar Awards- more than anyone else ever has!- during his 43 year career.
  • 3.  Walt arrived in California in the summer of 1923 with dreams and determination, but little else. On October 16, 1923, a New York distributor, M. J. Winkler, contracted to release the Alice Comedies, and this date became the formal beginning of The Walt Disney Company. Originally known as the Disney Brothers Cartoon Studio.
  • 4.  With his chief animator, Ub Iwerks, Walt designed a mouse whom Walt first wanted to name Mortimer, but his wife Lilly preferred Mickey. And so a star was born. November 18, 1928, Walt Disney soon produced another series -- the Silly Symphonies. a Silly Symphony and the first full-color cartoon, won the Academy Award for Best Cartoon for 1932, the first year that the Academy offered such a category. For the rest of that decade, a Disney cartoon won the Oscar every year.
  • 5. WALT DISNEY MOTION PICTURES GROUP  Walt Disney Motion Pictures Group, Inc. is a corporation which develops scripts and oversees theatrical production for The Walt Disney Company's production companies was initiated in 1998 .
  • 6. WALT DISNEY PARKS AND RESORTS  The Parks and Resorts division was founded in 1971 .The chairman of Walt Disney Parks and Resorts is Thomas O. Staggs . In 2009, the company's theme parks hosted approximately 119.1 million guests, making Disney Parks the worlds most visited theme park company ever.
  • 7. DISNEY LAND RESORT  Disney land was dedicated as a single park by Walt Disney on July 17, 1955, and opened to the public on July 18, 1955 in Anaheim, California .It consist of two hotels, one new and one themed; and the Downtown Disney retail, dining and entertainment district.
  • 8.  Walt Disney died December 15, 1966 .Roy was determined to realize his brothers vision, and honored him by naming it Walt Disney World. It opened October 1, 1971 with a Disneyland-style theme park, hotels, campgrounds, golf courses, shopping villages and a monorail connecting them all.
  • 9. MISSION AND VISION Walt Disney Company's mission is to be one of the world's leading producers and providers of entertainment and information using an portfolio of brands to differentiate our content, services and consumer products. We seek to develop the most creative innovative and profitable entertainment experiences and related projects in the world.
  • 10. STRATEGY  When Disney makes a movie today, the company thinks beyond the motion picture to how the story can be leveraged into merchandise, experiences, and spin-offs. It's not just a film: it's a theme park ride, a chapter in a larger saga, an action figure, a musical on ice. Every new investment/ acquisition is strategically chosen and usually assists at least one of it’s its five market segments.
  • 11. TIMES AND CONDITIONS CHANGE SO RAPIDLY THAT WE MUST KEEP OUR AIM CONSTANTLY FOCUSED ON THE FUTURE.  I do not like to repeat successes, I like to go on to other things.
  • 12. ACQUISITIONS  2009 Marvel  2009 Disney joins Hulu venture  2011 Disney acquires 49% of seven tv  2012 Lucasfilm Ltd  Disney has announced it’s intentions to sell 23 of it’s 24 U.S based radio Disney stations.
  • 13.
  • 14. FINANCIAL BACKGROUND  Media Networks segment includes broadcast and cable television networks, television production operations, television distribution, domestic television stations and radio networks and stations  Total media network accounted for:  5 percent of the revenues in 2012 versus 2013 and 4 percent in 2013 versus 2014.  3 percent change of segmented operating income (LOSS) in 2012 versus 2013 and 7 percent change in 2013 versus 2014.
  • 15. 2010 AND 2011  affiliate fees increased by six percent (6%)  14 percent increase in cable networks and 6 percent in broadcasting  13 percent increase was due switching price levels between studio entertainment and media networks  decrease in costs and expenses by 208 million dollars in 2011 due to the absence of FIFA World cup  operating income to increase by an impressive 20%
  • 16. 2011 AND 2012  Affiliate fees increased by six percent (6%)  Increase in revenue from cable networks of 263 million and a decrease in broadcasting of 162 million  Operating expenses increased to by 231 million  production also decreased by 128 million due to the absence of Oprah Winfrey show
  • 17. 2013 AND 2014  total revenues form media networks increased by four percent (4% - form 20,356 to 21,152)  Affiliate Fees which increased by six percent (6%)  revenues increased by 75 Million due to “the inclusion of revenues from Maker Studios, Lucas film SVOD sales  Equity from investments increased by 114 million  operating expenses decreased by five percent (5%), and selling, general, administrative and other expenses also increase
  • 18. DISNEY MEDIA NETWORKS INCOME STATEMENT Year Ended 2014 2013 2012 2011 2010 (in millions) % Increase Better/Worse Revenues Affiliate Fees 6% 7% 6% 9% 9% Advertising 1% 3% 1% 8% 7% Other 3% 2% 4% 13% 8% total renvenues 4% 5% 4% 9% 6% Operating expenses 5% -7% -2% -5% -4% Selling, general, administrative and other 5% -4% -1% -8% -2% Depreciation and amortization 3% -9% -7% -8% Equity in the income of investees 15% 18% 7% 33% -23% Operating Income 7% 3% 8% 20% 8%
  • 19. TOTAL REVENUES FOR MEDIA NETWORK TREND ANALYSIS
  • 20.
  • 21. FINANCIAL BACKGROUND  Walt Disney World Resort in Florida, the Disneyland Resort in California, Aulani, and Disney Resort & Spa in Hawaii, the Disney Vacation Club, the Disney Cruise Line and Adventures by Disney.  It owns 51% in Disneyland Paris, 48% in Hong Kong Disneyland Resort and 43% in Shanghai Disney Resort
  • 22. 2010 AND 2011 2010  increased by 1 percent(from 94 million to 10.8 million)  Operating income during this period was listed at 1,318 million 2011  increases in domestic and international parks and resources totaling 10 percent  3 percent of the international revenue decrease in value of of the US dollars against the Euro  Disney sold property at Disneyland Paris  temporary closed the Tokyo Disney resort location due to an earthquake in Japan in March 2011  New hotel was also opened in Hawaii on August 2011.
  • 23. 2012, 2013, AND 2014  The introduction of Cars Land at the California Disney adventures  Resort reflected the 2011 impact from the earthquake and tsunami in Japan  the launch of Disney Fantasy in March 2012 and the opening of Disney’s Art of Animation Resort in May 2012  more guest in Hong Kong Disneyland resort offset by a decrease in the nightly stays in Disneyland Paris  increasing by 5 percent in guest spending  1 percent increase in foreign currency as the US dollar continues to decrease.  Disneyland Paris also continues to decrease in volume.
  • 24. PARKS AND RESORTS INCOME STATEMENT Year Ended 2014 2013 2012 2011 2010 (in millions) % Increase Better/Worse Revenues Domestic 8% 10% 11% 11% International 3% 4% 3% 6% 6% total renvenues 7% 9% 10% 10% 1% Operating expenses -7% -8% -7% -9% -2% Selling, general, administrative and other 5% -6% -9% -12% -3% Depreciation and amortization 7% -10% -7% -2% 1% Operating Income 20% 17% 23% 18% -7%
  • 26. PARKS AND RESORT V.S MEDIA NETWORKS 2014 2013 2012 2011 2010 Media Networks total renvenues 4% 5% 4% 9% 6% Parks and Resorts total renvenues 7% 9% 10% 10% 1%
  • 28. DISNEY FILM STUDIOS  Pixar Animation Studio  Marvel Entertainment  Disney Animated Studio  Touchstone  Lucasfilm
  • 29. REVENUE  Total Revenues from Studio Entertainment is 7.278 billion dollars
  • 30. BOX OFFICE Highest-grossing films of 2014 Rank Title Studio Worldwide gross 1 Transformers: Age of Extinction Paramount Pictures $1,104,039,076 2 The Hobbit: The Battle of the Five Armies Warner Bros. / New Line Cinema / MGM $956,019,788 3 Guardians of the Galaxy Marvel Studios $774,176,600 4 Maleficent Walt Disney Pictures $758,410,378 5 The Hunger Games: Mockingjay – Part 1 Lionsgate Films $755,356,711 6 X-Men: Days of Future Past 20th Century Fox $748,121,534 7 Captain America: The Winter Soldier Marvel Studios $714,766,572 8 The Amazing Spider-Man 2 Columbia Pictures $708,982,323 9 Dawn of the Planet of the Apes 20th Century Fox $708,835,589 10 Interstellar Paramount Pictures / Warner Bros. $675,020,017
  • 31. MAGIC TOUCH  Disney Frozen accounts for 1.274 billion dollar at the box office.  Budget of 150 million dollars  Grossing 1.124 billion dollars
  • 32. DISNEY BOX OFFICE Notable Box Office Numbers  Pixar: Planes gross of 189.3 million dollars  Pixar: Monsters University gross of 543.6 million dollars  Marvel: Captain America 2 gross of 544.8  Marvel: Thor: The Dark World gross of 474.8 million dollars
  • 34. The Consumer Products sector is the 4th profitable segment of The Walt Disney Company. It handles the merchandise licensing, publishing and the retail of all of the property that the company creates, designs and develops.
  • 35. Merchandise Licensing The Company licenses a wide mixture of products that include everything that consumers use from apparel, home goods, and food to toys, electronics and health and beauty goods.
  • 36. It licenses characters from all its company properties such as its films and television shows for use on third-party products and earn revenue from the royalties on these products; revenue is from either a fixed percentage of the wholesale cost or from the retail selling price. Merchandise Licensing
  • 37. Publishing The Company’s publishing business called Disney Publishing Worldwide creates, licenses, publish, and also distributes children books, magazines and learning products in all forms of communication and within multiple countries and languages. Disney Publishing Worldwide also operates, develop and delivers Disney English, which offers an English language program to Chinese youth across 9 cites of China.
  • 38. Publishing In addition, Disney’s 2nd publishing business called Marvel Publishing also creates and publishes comic books and graphic novel collections of comic books in both print and digital forms. Marvel Publishing also licenses the rights to translate these comic books in mostly European and Latin American countries.
  • 39. Retail As for the Disney retail stores, the company markets all of its Lucas films, Disney and Marvel-themed products within its stores and through internet sites.
  • 40. The Walt Disney Company currently owns and operates over 328 retail stores with 64 percent of them located all across North America.
  • 42. Through these 3 divisions, the consumer products segment earns revenues from sales of its merchandise in both retail stores and online sites, the wholesale profits from publishing all its books and magazines, licensing it characters, and from earning usage fees from its English learning centers.
  • 43. Operating income for the consumer products segment increases by the millions annually. Based on a trend analysis of the last 5 years using the company’s 10-k filings, its revenues has increased by over double the percentage since 2009. A big element that produced most of this segment’s profits is its licensing and publishing; it increased astonishingly by 60 percent since 2009. And even though licensing and publishing accounts for most of the revenue, the company’s retail and other sources of revenue has played a big factor as well with an increase of 72% since 2009.
  • 44. CONSUMER PRODUCTS Operating results for the Consumer Products segment are as follows: % of Change Better/ Worse(-) 2009 vs. 2012 Year Ended (in millions) 29-Sep-12 1-Oct-11 2-Oct-10 3-Oct-09 Revenue Licensing and publishing $2,056 $1,933 $1,725 $1,584 30% Retail and other 1196 1116 953 841 42% Total revenues 3252 3049 2678 2425 34% Operating expenses -1514 -1452 -1236 -1182 -28% Selling, general, administrative and other -686 -676 -687 -597 -15% Depreciation and amortization -115 -105 -78 -39 95% Operating Income/Loss(-) 937 816 677 607 54%
  • 45. CONSUMER PRODUCTS Operating results for the Consumer Products segment are as follows: % of Change Better/ Worse(-) 2013 vs. 2014 Year Ended (in millions) 27-Sep-14 28-Sep-13 Revenue Licensing and publishing $2,538 $2,254 13% Retail and other 1447 1301 11% Total revenues 3985 3555 12% Operating expenses -1683 -1566 -7% Selling, general, administrative and other -778 -731 -6% Depreciation and amortization -168 -146 -15% Operating Income/Loss(-) 1356 1112 22%
  • 46. Expenses for the consumer product segment has also increased over the past 5 years. Due to many acquisitions of new Disney retail stores and the purchase of Marvel, more expenses to operate, promote and sell were required. In analysis of the last 5 years, operating expenses has increased by 42% since 2009. Also, selling, general, administrative and other expenses have increased by 30% since 2009. In addition, due to all the company’s plant and equipment in this segment depreciation and amortization have been dramatically increased by over 4 times the percentage since 2009. Reasons for the expenses is explained by The Walt Disney Company below from its 10k filings since 2009.
  • 48. The interactive media sector is the 5th and the lowest profitable segment of the company. This sector produces mobile, console and virtual world games and is responsible for the designing and web management for all the company’s businesses; it also licenses the content for games and mobile devices and develops branded online services. Some of the games developed and published by The Company include, Disney Infinity which is a console game released in 2014, Marvel Avengers Alliance which is a mobile device game accessible on all smartphones, social networking websites and tablets, and Disney’s Club Penguin which is a virtual world game. The interactive media sector earns it revenue from sales of the games to retailers and distributors; it gains revenue from micro transactions within the virtual games and from subscription fees; it earns revenue from licensing content to third-party game publishers and mobile phone providers and also from online advertising and sponsorships.
  • 49.
  • 50. Within this interactive media segment, profits were at a loss for about 4 fiscal years until 2014 fiscal year primarily due to the company accumulating more expenses than what it was earning. This segment loss the most profit during 2010 to 2011 by 30 percent due to the acquisition costs of Playdom, a social networking game, for the year as stated in the cost and expenses section of this sector. Although this occurred, total revenue for the past 5 years since 2009 has increased by 82 percent due the impressive performance of Disney Infinity 1.0 in the 2014 fiscal year.
  • 51. INTERACTIVE MEDIA Operating results for the Interactive segment are as follows: % of Change Better/ Worse(-) 2009 vs. 2012 Year Ended (in millions) 29-Sep-12 1-Oct-11 2-Oct-10 3-Oct-09 Revenue Game sales and subscriptions $613 $768 $563 $565 9% Advertising and other 232 214 198 147 58% Total revenues 845 982 761 712 19% Operating expenses -583 -675 -581 -623 7% Selling, general, administrative and other -429 -561 -371 -336 -28% Depreciation and amortization -49 -54 -43 -50 2% Operating Income/Loss(-) -216 -308 -234 -292 35%
  • 52. INTERACTIVE MEDIA Operating results for the Interactive segment are as follows: % of Change Better/ Worse(-) 2013 vs. 2014 Year Ended (in millions) 27-Sep-14 28-Sep-13 Revenue Games* $1,056 $812 30% Other Content 243 252 -4% Total revenues 1299 1064 22% Operating expenses -700 -658 -6% Selling, general, administrative and other -400 -449 -2% Depreciation and amortization -23 -44 48% Operating Income/Loss(-) 116 -87 nm *Certain reclassifications have been made to the revenue amounts presented for fiscal 2013 to conform to the fiscal 2014 presentation. The principal change was to reclassify game-related revenue from our Japan mobile business from Other content to Games.
  • 53. INCOME STATEMENT Fiscal year is October-September. All values USD millions. 2010 2011 2012 2013 2014 Sales/Revenue 38.06B 40.89B 42.28B 45.04B 48.81B Sales Growth - 7.44% 3.39% 6.54% 8.37% Cost of Goods Sold (COGS) incl. D&A 31.44B 33.14B 33.23B 27.23B 28.71B COGS excluding D&A 29.73B 31.3B 31.24B 25.03B 26.42B Depreciation & Amortization Expense 1.71B 1.84B 1.99B 2.19B 2.29B Depreciation 1.6B 1.66B 1.78B 1.96B 2.06B Amortization of Intangibles 111M 182M 203M 235M 224M COGS Growth - 5.40% 0.29% - 18.07 % 5.44% Gross Income 6.62B 7.76B 9.05B 17.82B 20.11B Gross Income Growth - 17.10 % 16.63 % 96.92 % 12.85 % Gross Profit Margin - - - - 41.19 %
  • 54. PROFITABILITY RATIOS  Gross profit margins of 45.88%  Operating profit margin of 23.64%  Net profit margin of 16.4%  Net return on total assets of 9.51%  Return on stockholder equity of 17.8%  Return on invested capital of 12.6%
  • 55. ASSETS Fiscal year is October-September. All values USD millions. 2010 2011 2012 2013 2014 5- year trend Cash & Short Term Investments 2.72B 3.19B 3.39B 3.93B 3.42B Cash Only 2.72B 3.19B 3.39B 3.93B 3.42B Short-Term Investments - - - - - Total Accounts Receivable 5.78B 6.18B 6.54B 6.97B 7.82B Accounts Receivables, Net 5.45B 5.95B 6.31B 6.69B 7.43B Accounts Receivables, Gross 5.78B 6.21B 6.47B 6.85B 7.58B Bad Debt/Doubtful Accounts (326M) (261M) (161M) (155M) (154M) Other Receivables 330M 235M 227M 273M 394M Inventories 1.44B 1.6B 1.54B 1.49B 1.57B Finished Goods 0 0 0 0 0 Work in Progress 0 0 0 0 0 Raw Materials 0 0 0 0 0 Progress Payments & Other 1.44B 1.6B 1.54B 1.49B 1.57B Other Current Assets 1.6B 2.12B 1.57B 1.72B 2.36B Miscellaneous Current Assets 1.15B 1.67B 1.1B 1.28B 1.93B Total Current Assets 11.55B 13.08B 13.03B 14.11B 15.18B
  • 56. LIABILITIES 2010 2011 2012 2013 2014 5-year trend ST Debt & Current Portion LT Debt 2.35B 3.06B 3.61B 1.51B 2.16B Short Term Debt 0 0 0 0 0 Current Portion of Long Term Debt 2.35B 3.06B 3.61B 1.51B 2.16B Accounts Payable 4.41B 4.55B 4.62B 4.9B 5.37B Income Tax Payable - - - - - Other Current Liabilities 4.24B 4.49B 4.58B 5.29B 5.76B Dividends Payable - - - - - Accrued Payroll 1.48B 1.47B 1.52B 1.63B 1.77B Miscellaneous Current Liabilities 2.75B 3.02B 3.06B 3.67B 3.99B Total Current Liabilities 11B 12.09B 12.81B 11.7B 13.29B Long-Term Debt 10.35B 11.21B 10.98B 12.78B 12.68B Long-Term Debt excl. Capitalized Leases 10.13B 10.92B 10.7B 12.78B 12.68B Non-Convertible Debt 10.13B 10.92B 10.7B 12.78B 12.68B Convertible Debt 0 0 0 0 0 Capitalized Lease Obligations 224M 288M 284M - - Provision for Risks & Charges 3.38B 4.22B 4.83B 2.09B 3.48B Deferred Taxes 2.63B 2.87B 2.25B 4.05B 4.1B Deferred Taxes - Credit 2.63B 2.87B 2.25B 4.05B 4.1B Deferred Taxes - Debit 0 0 0 0 0 Other Liabilities 2.5B 2.28B 2.07B 2.47B 2.46B Other Liabilities (excl. Deferred Income) 2.26B 2.05B 1.85B 2.47B 2.46B Deferred Income 244M 233M 220M - - Total Liabilities 29.86B 32.67B 32.94B 33.09B 36.01B
  • 57. LIQUIDITY RATIOS  Current ratio of 114.17%  Working Capital of 1.884 billion
  • 58. LEVERAGE RATIOS  Debt to equity of 50.57%  Long-term debt to equity of 41.41%
  • 60. Strengths: Brand reputation Disney has its well known brand name and reputed status around the world. The products of the Disney have been perceived positively by the people because of its brand reputation. Has own Walt Disney studios (second largest media conglomerate in terms of revenue) Disney has its own studios which includes Disney's motion picture studios, music labels, theatrical production company, and distribution companies.
  • 61. Diversified business Disney has variety of its productions and extensions of its production units around the world. For example, it has The Walt Disney Studios, Disney Consumer Products and Interactive Media, Walt Disney Parks and Resorts, Disney Media Networks, Marvel Entertainment etc. Loyal customers Disney has its millions of loyal customers that it achieved through strong relationship and by providing them maximum satisfaction from its products.
  • 62. Top management Disney has experienced, well-trained, enthusiastic and motivated top work force. Strong financial position Disney financially stands strong in the competitive market and is able to continue its company sustainably.
  • 63. High quality Disney is able to win people's positive attitude towards it through consistent quality productions. Strong advertising Disney has its strong advertising strategy through which it is penetrating into the markets, reaching to its potential customers, and is gaining its popularity over rivals.
  • 64. Weaknesses: Decline of Cinemas People are going less to the cinemas due to the release of home theaters and increasing ticket prices. Changing viewership trends The habits of people viewing the movies have changed with the introduction of new technologies. People are engaged in watching movies on their smart phones, ipads, laptops etc.
  • 65. Lack of Access to Web viewership platforms Inaccessibility of people to the web viewership platforms puts the company away from the potential customers and cannot achieve the maximum benefits from the markets. High operating cost The operating cost of Disney is high in maintaining the consistent quality production.
  • 66. frequent change in top management The frequent changes in top management make the management difficult to drive the company at the same speed as before competing with the rivals. Opportunities: Disney music channel Growing popularity of Disney music channel increases the scope and opportunity of Disney.
  • 67. Disney school of management and training Disney school of management and training institute conducts workshops, seminars, presentations and special programs for professionals enhancing their managerial skills. Online websites Now, the accessibility of online websites helps to promote its business and reach to more customers throughout the world.
  • 68. Advancement in technology Technological advancement and introduction of the new techniques and equipment are increasing efficiency of work and reducing operating costs. Demographic changes The change in demography such as migration of population into an area adds opportunity to a company to foster its business.
  • 69. Threats: Changing animation trends Change in animation trends and technologies might change the taste of customers and they might shift their old habits to the new one. Strong competition The increasing competition in the market and entry of the new entrants might increase the possibility of losing the business.
  • 70. Increasing piracy Issue of copy rights, and increasing piracy threats the company to lose its business. Change in customers preferences and behaviors People's preference and behavior change with time and it is hard to predict whether a company would be preferred by the customers for long time or not.
  • 71. Economic (recession/inflation/unemployment) condition Unfavorable economic condition inside and outside the country would affect the company. The recession, inflation and increasing unemployment rate have direct impact to the company. Increasing salaries and labor costs The increasing salaries and labor cost in the markets make the operation costs high and reduce the company's overall income.
  • 72. SUGGESTION  Introduce More Parks  Re-acquire Marvel Character from Sony  Partnership with other animation studios  Madhouse