SlideShare a Scribd company logo
Learning outcomes
At the endof thislesson,youare expectedtodothe following:
LO 1. Identifydifferentkindsof technical drawingand
LO2. Interprettechnical drawing
Flowchart
A flowchartisa diagramthat usesgraphicsymbolstodepictthe nature and flow of the stepsina
process.Anothername forthistool is“flow diagram”.
What are the elementsof flowchart?
A flowchartiscommonlyusedbysystemsanalyststovisualizethe seriesof processesina
businesssystem.A flowchartisauseful tool todesignanefficientbusinesssystemandtotroubleshoot
or improve anexistingsystem.A flowchartconsistsof elements,suchasthe terminator,process,sub
process,arrowlinesandconnectors.
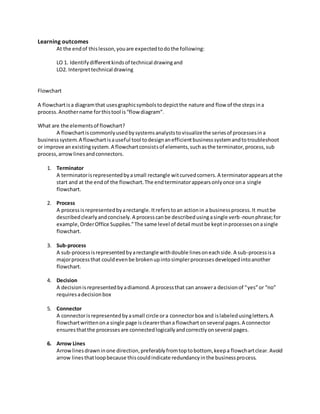
1. Terminator
A terminatorisrepresentedbyasmall rectangle witcurvedcorners.A terminatorappearsatthe
start and at the endof the flowchart.The endterminatorappearsonlyonce ona single
flowchart.
2. Process
A processisrepresentedbyarectangle.Itreferstoan actionin a businessprocess.It mustbe
describedclearlyandconcisely.A processcanbe describedusingasingle verb-nounphrase;for
example,OrderOffice Supplies.”The same level of detail mustbe keptinprocessesonasingle
flowchart.
3. Sub-process
A sub-processisrepresentedbyarectangle withdouble linesoneachside.A sub-processisa
majorprocessthat couldevenbe brokenupintosimplerprocessesdevelopedintoanother
flowchart.
4. Decision
A decisionisrepresentedbyadiamond.A processthat can answera decisionof “yes”or “no”
requiresadecisionbox
5. Connector
A connectoris representedbyasmall circle ora connectorbox and islabeledusingletters.A
flowchartwrittenona single page isclearerthana flowchartonseveral pages.A connector
ensuresthatthe processesare connectedlogicallyandcorrectlyonseveral pages.
6. Arrow Lines
Arrowlinesdrawninone direction,preferablyfromtoptobottom, keepa flowchartclear.Avoid
arrow linesthatloopbecause thiscouldindicate redundancyinthe businessprocess.
Whenshouldteams use flowcharts?
At the beginningof yourprocessimprovementefforts,anas-isflowcharthelpsyourteamand
othersinvolvedinthe processtounderstandhow itcurrentlyworks.The teammayfindithelpful to
compare thisas-isflowchartwithadiagram of the way the processissupposedtowork.Later, the team
will developaflowchartof the modifiedprocessagain,torecordow it actuallyfunctions.Atsome point,
your teammay wantto create an ideal flowcharttoshow how you wouldultimatelylikethe processot
performed.
BenefitsofUsingFlowcharts
1. Promote understandingofa process
People mayhave differingideasabouthow aprocessworks.A flowchartcanhelpyougainagreement
aboutthe sequence of steps.Flowchartspromote understandinginawaythat writtenprocedures
cannot do.One foodflowchartcan replace pagesof words.
2. Provide a toll for training employees.
Because of the way theyvisuallylayoutthe sequenceof processsteps,flowchartscanbe veryhelpful in
trainingemployeestoperformthe processaccordingtostandardizedprocedures.
3. Identifyproblemareas and opportunitiesfor processimprovement
Once you breakdownthe processstepsanddiagram them, problemareasbecome more visible.Itis
easyto spotopportunitiesforsimplifyingandrefiningandprocessbyanalyzingdecisionpoints,
redundantstepsandreworkloops.
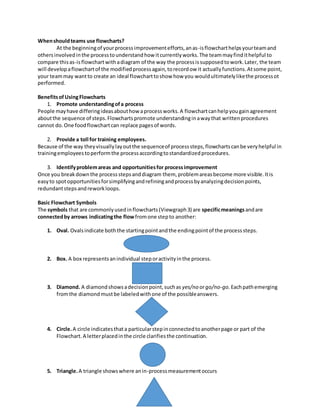
Basic Flowchart Symbols
The symbols that are commonlyusedinflowcharts(Viewgraph3) are specificmeaningsandare
connectedby arrows indicatingthe flowfromone stepto another:
1. Oval. Ovalsindicate boththe startingpointandthe endingpointof the processsteps.
2. Box. A box representsanindividual steporactivityinthe process.
3. Diamond. A diamondshowsadecisionpoint,suchas yes/no orgo/no-go. Eachpathemerging
fromthe diamondmustbe labeledwithone of the possibleanswers.
4. Circle.A circle indicatesthata particularstepinconnectedtoanotherpage or part of the
Flowchart.A letterplacedinthe circle clarifiesthe continuation.
5. Triangle.A triangle showswhere anin-processmeasurementoccurs
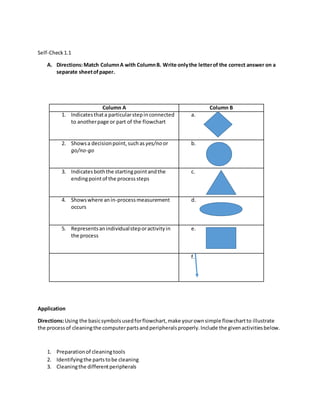
Fig. 1 example of a Simple Flowchart
no
yes
Start
Process
End
YesProcess
Process
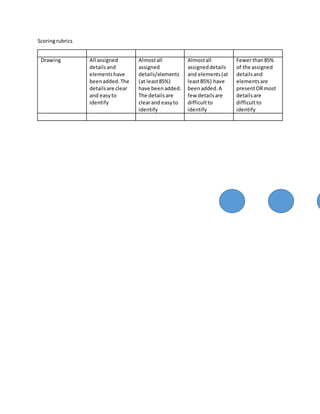
Self-Check1.1
A. Directions:Match ColumnA with ColumnB. Write onlythe letterof the correct answer on a
separate sheetofpaper.
Column A Column B
1. Indicatesthata particularstepinconnected
to anotherpage or part of the flowchart
a.
2. Showsa decisionpoint,suchas yes/no or
go/no-go
b.
3. Indicatesboththe startingpointandthe
endingpointof the processsteps
c.
4. Showswhere anin-processmeasurement
occurs
d.
5. Representsanindividualsteporactivityin
the process
e.
f.
Application
Directions:Using the basicsymbolsusedforflowchart,make yourownsimple flowchartto illustrate
the processof cleaningthe computerpartsandperipheralsproperly.Include the givenactivitiesbelow.
1. Preparationof cleaningtools
2. Identifyingthe partstobe cleaning
3. Cleaningthe differentperipherals
Scoringrubrics
Drawing All assigned
detailsand
elementshave
beenadded.The
detailsare clear
and easyto
identify
Almostall
assigned
details/elements
(at least85%)
have beenadded.
The detailsare
clearand easyto
identify
Almostall
assigneddetails
and elements(at
least85%) have
beenadded.A
few detailsare
difficultto
identify
Fewerthan85%
of the assigned
detailsand
elementsare
presentORmost
detailsare
difficultto
identify
Readthe informationsheet2.1verywell thenfindouthow muchyoucan rememberandhow muchyou
learnedbydoingself-check2.1
Informationsheet2.1
How doyou interpretflowcharts?
A Flowchartwill helpyouunderstandyourprocessanduncoverwaystoimprove itonlyif youuse it to
analyze whatishappening.InterpretingyourFlowchartwillhelpyouto:
 Determine whoisinvolvedinthe process
 Form theoriesaboutrootcauses
 Identify waystostreamlinethe process
 Determine howtoimplementchangestothe process
 Locate cost-added-onlysteps
 Provide trainingonhowthe processworksor shouldwork
Belowisa sequence of stepsthatwill helpyouthroughanorderlyanalysisof yourflowchart.
Step 1 – Examine each process step for the followingconditionsthatindicatesaneedtoimprove the
process:
Bottlenecks. These pointsinthe processwhere itslowsdownmaybe causedbyredundantor
unnecessarysteps,rework,lackof capacity,or otherfactors.
Weak links. These are stepswhere problemsoccurbecause of inadequatetrainingof processworkers,
equipmentthatneedstobe repairedorreplaced,orinsufficienttechnical documentation.“Informthe
drill leaderandimprovise”isone of the weaklinks.
Poorly defined steps. Stepswhichare not well-definedmaybe interpretedandperformedinadifferent
wayby each personinvolved,leadingtoprocessvariation.“Improvise”isa poorlydefinedstepinthe
weaklinkcitedabove.
Step 2 – Examine each decisionsymbol. You may wantto collectdata onhow oftenthere isa“yes” or
“no” answerat decisionpointsmarkedbyadiamondshapedsymbol.If mostdecisionsgoone way
rather thanthe other,you maybe able toremove thisdecisionpoint.

More Related Content

Similar to Flowchart

Flowchart.pptx
Flowchart.pptxFlowchart.pptx
Flowchart.pptx
Alicia Nhs
 
QCL-14-v3 Flowchart_Banasthali University_Anshu Verma
QCL-14-v3 Flowchart_Banasthali University_Anshu VermaQCL-14-v3 Flowchart_Banasthali University_Anshu Verma
QCL-14-v3 Flowchart_Banasthali University_Anshu Verma
av2194
 
Chap6
Chap6Chap6
Flowcharts
FlowchartsFlowcharts
Flowcharts
parimala123
 
ppt of flowchart
ppt of flowchartppt of flowchart
ppt of flowchart
140120109032
 
cpuppt-150726134330-lva1-app6891.pdf
cpuppt-150726134330-lva1-app6891.pdfcpuppt-150726134330-lva1-app6891.pdf
cpuppt-150726134330-lva1-app6891.pdf
SameerKhanPathan7
 
Flow Chart @ppsc(2)
Flow Chart @ppsc(2)Flow Chart @ppsc(2)
Flow Chart @ppsc(2)
Amiya Bhusan
 
algorithm and Pseudocode
algorithm and Pseudocodealgorithm and Pseudocode
algorithm and Pseudocode
Fabian Macuha
 
Flowchart Grade 10
Flowchart Grade 10Flowchart Grade 10
Flowchart Grade 10
ninoallandanganancarpio
 
7-White Box Testing.ppt
7-White Box Testing.ppt7-White Box Testing.ppt
7-White Box Testing.ppt
HirenderPal
 
Business process modelling
Business process modellingBusiness process modelling
Business process modelling
Kiito25
 
AlgorithmAndFlowChart.pdf
AlgorithmAndFlowChart.pdfAlgorithmAndFlowChart.pdf
AlgorithmAndFlowChart.pdf
SusieMaestre1
 
Introductiontoflowchart 110630082600-phpapp01
Introductiontoflowchart 110630082600-phpapp01Introductiontoflowchart 110630082600-phpapp01
Introductiontoflowchart 110630082600-phpapp01
VincentAcapen1
 
Algorithm and flowchart
Algorithm and flowchart Algorithm and flowchart
Algorithm and flowchart
Shivam Sharma
 
Basic Slides on Algorithms and Flowcharts
Basic Slides on Algorithms and FlowchartsBasic Slides on Algorithms and Flowcharts
Basic Slides on Algorithms and Flowcharts
moazwinner
 
Flow charts
Flow chartsFlow charts
Flow charts
Aditya Sharat
 
Lecture1-Algorithms-and-Flowcharts-ppt.ppt
Lecture1-Algorithms-and-Flowcharts-ppt.pptLecture1-Algorithms-and-Flowcharts-ppt.ppt
Lecture1-Algorithms-and-Flowcharts-ppt.ppt
ReshuReshma8
 
algorithms and flow chart overview.pdf
algorithms and flow chart overview.pdfalgorithms and flow chart overview.pdf
algorithms and flow chart overview.pdf
AmanPratik11
 
Table Of Flowchart Symbols
Table Of Flowchart SymbolsTable Of Flowchart Symbols
Table Of Flowchart Symbols
Neo Nguyens
 
Pseudocode-Flowchart
Pseudocode-FlowchartPseudocode-Flowchart
Pseudocode-Flowchart
lotlot
 

Similar to Flowchart (20)

Flowchart.pptx
Flowchart.pptxFlowchart.pptx
Flowchart.pptx
 
QCL-14-v3 Flowchart_Banasthali University_Anshu Verma
QCL-14-v3 Flowchart_Banasthali University_Anshu VermaQCL-14-v3 Flowchart_Banasthali University_Anshu Verma
QCL-14-v3 Flowchart_Banasthali University_Anshu Verma
 
Chap6
Chap6Chap6
Chap6
 
Flowcharts
FlowchartsFlowcharts
Flowcharts
 
ppt of flowchart
ppt of flowchartppt of flowchart
ppt of flowchart
 
cpuppt-150726134330-lva1-app6891.pdf
cpuppt-150726134330-lva1-app6891.pdfcpuppt-150726134330-lva1-app6891.pdf
cpuppt-150726134330-lva1-app6891.pdf
 
Flow Chart @ppsc(2)
Flow Chart @ppsc(2)Flow Chart @ppsc(2)
Flow Chart @ppsc(2)
 
algorithm and Pseudocode
algorithm and Pseudocodealgorithm and Pseudocode
algorithm and Pseudocode
 
Flowchart Grade 10
Flowchart Grade 10Flowchart Grade 10
Flowchart Grade 10
 
7-White Box Testing.ppt
7-White Box Testing.ppt7-White Box Testing.ppt
7-White Box Testing.ppt
 
Business process modelling
Business process modellingBusiness process modelling
Business process modelling
 
AlgorithmAndFlowChart.pdf
AlgorithmAndFlowChart.pdfAlgorithmAndFlowChart.pdf
AlgorithmAndFlowChart.pdf
 
Introductiontoflowchart 110630082600-phpapp01
Introductiontoflowchart 110630082600-phpapp01Introductiontoflowchart 110630082600-phpapp01
Introductiontoflowchart 110630082600-phpapp01
 
Algorithm and flowchart
Algorithm and flowchart Algorithm and flowchart
Algorithm and flowchart
 
Basic Slides on Algorithms and Flowcharts
Basic Slides on Algorithms and FlowchartsBasic Slides on Algorithms and Flowcharts
Basic Slides on Algorithms and Flowcharts
 
Flow charts
Flow chartsFlow charts
Flow charts
 
Lecture1-Algorithms-and-Flowcharts-ppt.ppt
Lecture1-Algorithms-and-Flowcharts-ppt.pptLecture1-Algorithms-and-Flowcharts-ppt.ppt
Lecture1-Algorithms-and-Flowcharts-ppt.ppt
 
algorithms and flow chart overview.pdf
algorithms and flow chart overview.pdfalgorithms and flow chart overview.pdf
algorithms and flow chart overview.pdf
 
Table Of Flowchart Symbols
Table Of Flowchart SymbolsTable Of Flowchart Symbols
Table Of Flowchart Symbols
 
Pseudocode-Flowchart
Pseudocode-FlowchartPseudocode-Flowchart
Pseudocode-Flowchart
 

Recently uploaded

বাংলাদেশ অর্থনৈতিক সমীক্ষা (Economic Review) ২০২৪ UJS App.pdf
বাংলাদেশ অর্থনৈতিক সমীক্ষা (Economic Review) ২০২৪ UJS App.pdfবাংলাদেশ অর্থনৈতিক সমীক্ষা (Economic Review) ২০২৪ UJS App.pdf
বাংলাদেশ অর্থনৈতিক সমীক্ষা (Economic Review) ২০২৪ UJS App.pdf
eBook.com.bd (প্রয়োজনীয় বাংলা বই)
 
MARY JANE WILSON, A “BOA MÃE” .
MARY JANE WILSON, A “BOA MÃE”           .MARY JANE WILSON, A “BOA MÃE”           .
MARY JANE WILSON, A “BOA MÃE” .
Colégio Santa Teresinha
 
The History of Stoke Newington Street Names
The History of Stoke Newington Street NamesThe History of Stoke Newington Street Names
The History of Stoke Newington Street Names
History of Stoke Newington
 
Présentationvvvvvvvvvvvvvvvvvvvvvvvvvvvv2.pptx
Présentationvvvvvvvvvvvvvvvvvvvvvvvvvvvv2.pptxPrésentationvvvvvvvvvvvvvvvvvvvvvvvvvvvv2.pptx
Présentationvvvvvvvvvvvvvvvvvvvvvvvvvvvv2.pptx
siemaillard
 
UGC NET Exam Paper 1- Unit 1:Teaching Aptitude
UGC NET Exam Paper 1- Unit 1:Teaching AptitudeUGC NET Exam Paper 1- Unit 1:Teaching Aptitude
UGC NET Exam Paper 1- Unit 1:Teaching Aptitude
S. Raj Kumar
 
IGCSE Biology Chapter 14- Reproduction in Plants.pdf
IGCSE Biology Chapter 14- Reproduction in Plants.pdfIGCSE Biology Chapter 14- Reproduction in Plants.pdf
IGCSE Biology Chapter 14- Reproduction in Plants.pdf
Amin Marwan
 
The basics of sentences session 6pptx.pptx
The basics of sentences session 6pptx.pptxThe basics of sentences session 6pptx.pptx
The basics of sentences session 6pptx.pptx
heathfieldcps1
 
LAND USE LAND COVER AND NDVI OF MIRZAPUR DISTRICT, UP
LAND USE LAND COVER AND NDVI OF MIRZAPUR DISTRICT, UPLAND USE LAND COVER AND NDVI OF MIRZAPUR DISTRICT, UP
LAND USE LAND COVER AND NDVI OF MIRZAPUR DISTRICT, UP
RAHUL
 
How to Make a Field Mandatory in Odoo 17
How to Make a Field Mandatory in Odoo 17How to Make a Field Mandatory in Odoo 17
How to Make a Field Mandatory in Odoo 17
Celine George
 
Main Java[All of the Base Concepts}.docx
Main Java[All of the Base Concepts}.docxMain Java[All of the Base Concepts}.docx
Main Java[All of the Base Concepts}.docx
adhitya5119
 
Traditional Musical Instruments of Arunachal Pradesh and Uttar Pradesh - RAYH...
Traditional Musical Instruments of Arunachal Pradesh and Uttar Pradesh - RAYH...Traditional Musical Instruments of Arunachal Pradesh and Uttar Pradesh - RAYH...
Traditional Musical Instruments of Arunachal Pradesh and Uttar Pradesh - RAYH...
imrankhan141184
 
Your Skill Boost Masterclass: Strategies for Effective Upskilling
Your Skill Boost Masterclass: Strategies for Effective UpskillingYour Skill Boost Masterclass: Strategies for Effective Upskilling
Your Skill Boost Masterclass: Strategies for Effective Upskilling
Excellence Foundation for South Sudan
 
Wound healing PPT
Wound healing PPTWound healing PPT
Wound healing PPT
Jyoti Chand
 
Walmart Business+ and Spark Good for Nonprofits.pdf
Walmart Business+ and Spark Good for Nonprofits.pdfWalmart Business+ and Spark Good for Nonprofits.pdf
Walmart Business+ and Spark Good for Nonprofits.pdf
TechSoup
 
ZK on Polkadot zero knowledge proofs - sub0.pptx
ZK on Polkadot zero knowledge proofs - sub0.pptxZK on Polkadot zero knowledge proofs - sub0.pptx
ZK on Polkadot zero knowledge proofs - sub0.pptx
dot55audits
 
Pengantar Penggunaan Flutter - Dart programming language1.pptx
Pengantar Penggunaan Flutter - Dart programming language1.pptxPengantar Penggunaan Flutter - Dart programming language1.pptx
Pengantar Penggunaan Flutter - Dart programming language1.pptx
Fajar Baskoro
 
Advanced Java[Extra Concepts, Not Difficult].docx
Advanced Java[Extra Concepts, Not Difficult].docxAdvanced Java[Extra Concepts, Not Difficult].docx
Advanced Java[Extra Concepts, Not Difficult].docx
adhitya5119
 
Leveraging Generative AI to Drive Nonprofit Innovation
Leveraging Generative AI to Drive Nonprofit InnovationLeveraging Generative AI to Drive Nonprofit Innovation
Leveraging Generative AI to Drive Nonprofit Innovation
TechSoup
 
What is Digital Literacy? A guest blog from Andy McLaughlin, University of Ab...
What is Digital Literacy? A guest blog from Andy McLaughlin, University of Ab...What is Digital Literacy? A guest blog from Andy McLaughlin, University of Ab...
What is Digital Literacy? A guest blog from Andy McLaughlin, University of Ab...
GeorgeMilliken2
 
BÀI TẬP BỔ TRỢ TIẾNG ANH 8 CẢ NĂM - GLOBAL SUCCESS - NĂM HỌC 2023-2024 (CÓ FI...
BÀI TẬP BỔ TRỢ TIẾNG ANH 8 CẢ NĂM - GLOBAL SUCCESS - NĂM HỌC 2023-2024 (CÓ FI...BÀI TẬP BỔ TRỢ TIẾNG ANH 8 CẢ NĂM - GLOBAL SUCCESS - NĂM HỌC 2023-2024 (CÓ FI...
BÀI TẬP BỔ TRỢ TIẾNG ANH 8 CẢ NĂM - GLOBAL SUCCESS - NĂM HỌC 2023-2024 (CÓ FI...
Nguyen Thanh Tu Collection
 

Recently uploaded (20)

বাংলাদেশ অর্থনৈতিক সমীক্ষা (Economic Review) ২০২৪ UJS App.pdf
বাংলাদেশ অর্থনৈতিক সমীক্ষা (Economic Review) ২০২৪ UJS App.pdfবাংলাদেশ অর্থনৈতিক সমীক্ষা (Economic Review) ২০২৪ UJS App.pdf
বাংলাদেশ অর্থনৈতিক সমীক্ষা (Economic Review) ২০২৪ UJS App.pdf
 
MARY JANE WILSON, A “BOA MÃE” .
MARY JANE WILSON, A “BOA MÃE”           .MARY JANE WILSON, A “BOA MÃE”           .
MARY JANE WILSON, A “BOA MÃE” .
 
The History of Stoke Newington Street Names
The History of Stoke Newington Street NamesThe History of Stoke Newington Street Names
The History of Stoke Newington Street Names
 
Présentationvvvvvvvvvvvvvvvvvvvvvvvvvvvv2.pptx
Présentationvvvvvvvvvvvvvvvvvvvvvvvvvvvv2.pptxPrésentationvvvvvvvvvvvvvvvvvvvvvvvvvvvv2.pptx
Présentationvvvvvvvvvvvvvvvvvvvvvvvvvvvv2.pptx
 
UGC NET Exam Paper 1- Unit 1:Teaching Aptitude
UGC NET Exam Paper 1- Unit 1:Teaching AptitudeUGC NET Exam Paper 1- Unit 1:Teaching Aptitude
UGC NET Exam Paper 1- Unit 1:Teaching Aptitude
 
IGCSE Biology Chapter 14- Reproduction in Plants.pdf
IGCSE Biology Chapter 14- Reproduction in Plants.pdfIGCSE Biology Chapter 14- Reproduction in Plants.pdf
IGCSE Biology Chapter 14- Reproduction in Plants.pdf
 
The basics of sentences session 6pptx.pptx
The basics of sentences session 6pptx.pptxThe basics of sentences session 6pptx.pptx
The basics of sentences session 6pptx.pptx
 
LAND USE LAND COVER AND NDVI OF MIRZAPUR DISTRICT, UP
LAND USE LAND COVER AND NDVI OF MIRZAPUR DISTRICT, UPLAND USE LAND COVER AND NDVI OF MIRZAPUR DISTRICT, UP
LAND USE LAND COVER AND NDVI OF MIRZAPUR DISTRICT, UP
 
How to Make a Field Mandatory in Odoo 17
How to Make a Field Mandatory in Odoo 17How to Make a Field Mandatory in Odoo 17
How to Make a Field Mandatory in Odoo 17
 
Main Java[All of the Base Concepts}.docx
Main Java[All of the Base Concepts}.docxMain Java[All of the Base Concepts}.docx
Main Java[All of the Base Concepts}.docx
 
Traditional Musical Instruments of Arunachal Pradesh and Uttar Pradesh - RAYH...
Traditional Musical Instruments of Arunachal Pradesh and Uttar Pradesh - RAYH...Traditional Musical Instruments of Arunachal Pradesh and Uttar Pradesh - RAYH...
Traditional Musical Instruments of Arunachal Pradesh and Uttar Pradesh - RAYH...
 
Your Skill Boost Masterclass: Strategies for Effective Upskilling
Your Skill Boost Masterclass: Strategies for Effective UpskillingYour Skill Boost Masterclass: Strategies for Effective Upskilling
Your Skill Boost Masterclass: Strategies for Effective Upskilling
 
Wound healing PPT
Wound healing PPTWound healing PPT
Wound healing PPT
 
Walmart Business+ and Spark Good for Nonprofits.pdf
Walmart Business+ and Spark Good for Nonprofits.pdfWalmart Business+ and Spark Good for Nonprofits.pdf
Walmart Business+ and Spark Good for Nonprofits.pdf
 
ZK on Polkadot zero knowledge proofs - sub0.pptx
ZK on Polkadot zero knowledge proofs - sub0.pptxZK on Polkadot zero knowledge proofs - sub0.pptx
ZK on Polkadot zero knowledge proofs - sub0.pptx
 
Pengantar Penggunaan Flutter - Dart programming language1.pptx
Pengantar Penggunaan Flutter - Dart programming language1.pptxPengantar Penggunaan Flutter - Dart programming language1.pptx
Pengantar Penggunaan Flutter - Dart programming language1.pptx
 
Advanced Java[Extra Concepts, Not Difficult].docx
Advanced Java[Extra Concepts, Not Difficult].docxAdvanced Java[Extra Concepts, Not Difficult].docx
Advanced Java[Extra Concepts, Not Difficult].docx
 
Leveraging Generative AI to Drive Nonprofit Innovation
Leveraging Generative AI to Drive Nonprofit InnovationLeveraging Generative AI to Drive Nonprofit Innovation
Leveraging Generative AI to Drive Nonprofit Innovation
 
What is Digital Literacy? A guest blog from Andy McLaughlin, University of Ab...
What is Digital Literacy? A guest blog from Andy McLaughlin, University of Ab...What is Digital Literacy? A guest blog from Andy McLaughlin, University of Ab...
What is Digital Literacy? A guest blog from Andy McLaughlin, University of Ab...
 
BÀI TẬP BỔ TRỢ TIẾNG ANH 8 CẢ NĂM - GLOBAL SUCCESS - NĂM HỌC 2023-2024 (CÓ FI...
BÀI TẬP BỔ TRỢ TIẾNG ANH 8 CẢ NĂM - GLOBAL SUCCESS - NĂM HỌC 2023-2024 (CÓ FI...BÀI TẬP BỔ TRỢ TIẾNG ANH 8 CẢ NĂM - GLOBAL SUCCESS - NĂM HỌC 2023-2024 (CÓ FI...
BÀI TẬP BỔ TRỢ TIẾNG ANH 8 CẢ NĂM - GLOBAL SUCCESS - NĂM HỌC 2023-2024 (CÓ FI...
 

Flowchart

  • 1. Learning outcomes At the endof thislesson,youare expectedtodothe following: LO 1. Identifydifferentkindsof technical drawingand LO2. Interprettechnical drawing Flowchart A flowchartisa diagramthat usesgraphicsymbolstodepictthe nature and flow of the stepsina process.Anothername forthistool is“flow diagram”. What are the elementsof flowchart? A flowchartiscommonlyusedbysystemsanalyststovisualizethe seriesof processesina businesssystem.A flowchartisauseful tool todesignanefficientbusinesssystemandtotroubleshoot or improve anexistingsystem.A flowchartconsistsof elements,suchasthe terminator,process,sub process,arrowlinesandconnectors. 1. Terminator A terminatorisrepresentedbyasmall rectangle witcurvedcorners.A terminatorappearsatthe start and at the endof the flowchart.The endterminatorappearsonlyonce ona single flowchart. 2. Process A processisrepresentedbyarectangle.Itreferstoan actionin a businessprocess.It mustbe describedclearlyandconcisely.A processcanbe describedusingasingle verb-nounphrase;for example,OrderOffice Supplies.”The same level of detail mustbe keptinprocessesonasingle flowchart. 3. Sub-process A sub-processisrepresentedbyarectangle withdouble linesoneachside.A sub-processisa majorprocessthat couldevenbe brokenupintosimplerprocessesdevelopedintoanother flowchart. 4. Decision A decisionisrepresentedbyadiamond.A processthat can answera decisionof “yes”or “no” requiresadecisionbox 5. Connector A connectoris representedbyasmall circle ora connectorbox and islabeledusingletters.A flowchartwrittenona single page isclearerthana flowchartonseveral pages.A connector ensuresthatthe processesare connectedlogicallyandcorrectlyonseveral pages. 6. Arrow Lines Arrowlinesdrawninone direction,preferablyfromtoptobottom, keepa flowchartclear.Avoid arrow linesthatloopbecause thiscouldindicate redundancyinthe businessprocess.
  • 2. Whenshouldteams use flowcharts? At the beginningof yourprocessimprovementefforts,anas-isflowcharthelpsyourteamand othersinvolvedinthe processtounderstandhow itcurrentlyworks.The teammayfindithelpful to compare thisas-isflowchartwithadiagram of the way the processissupposedtowork.Later, the team will developaflowchartof the modifiedprocessagain,torecordow it actuallyfunctions.Atsome point, your teammay wantto create an ideal flowcharttoshow how you wouldultimatelylikethe processot performed. BenefitsofUsingFlowcharts 1. Promote understandingofa process People mayhave differingideasabouthow aprocessworks.A flowchartcanhelpyougainagreement aboutthe sequence of steps.Flowchartspromote understandinginawaythat writtenprocedures cannot do.One foodflowchartcan replace pagesof words. 2. Provide a toll for training employees. Because of the way theyvisuallylayoutthe sequenceof processsteps,flowchartscanbe veryhelpful in trainingemployeestoperformthe processaccordingtostandardizedprocedures. 3. Identifyproblemareas and opportunitiesfor processimprovement Once you breakdownthe processstepsanddiagram them, problemareasbecome more visible.Itis easyto spotopportunitiesforsimplifyingandrefiningandprocessbyanalyzingdecisionpoints, redundantstepsandreworkloops. Basic Flowchart Symbols The symbols that are commonlyusedinflowcharts(Viewgraph3) are specificmeaningsandare connectedby arrows indicatingthe flowfromone stepto another: 1. Oval. Ovalsindicate boththe startingpointandthe endingpointof the processsteps. 2. Box. A box representsanindividual steporactivityinthe process. 3. Diamond. A diamondshowsadecisionpoint,suchas yes/no orgo/no-go. Eachpathemerging fromthe diamondmustbe labeledwithone of the possibleanswers. 4. Circle.A circle indicatesthata particularstepinconnectedtoanotherpage or part of the Flowchart.A letterplacedinthe circle clarifiesthe continuation. 5. Triangle.A triangle showswhere anin-processmeasurementoccurs
  • 3. Fig. 1 example of a Simple Flowchart no yes Start Process End YesProcess Process
  • 4. Self-Check1.1 A. Directions:Match ColumnA with ColumnB. Write onlythe letterof the correct answer on a separate sheetofpaper. Column A Column B 1. Indicatesthata particularstepinconnected to anotherpage or part of the flowchart a. 2. Showsa decisionpoint,suchas yes/no or go/no-go b. 3. Indicatesboththe startingpointandthe endingpointof the processsteps c. 4. Showswhere anin-processmeasurement occurs d. 5. Representsanindividualsteporactivityin the process e. f. Application Directions:Using the basicsymbolsusedforflowchart,make yourownsimple flowchartto illustrate the processof cleaningthe computerpartsandperipheralsproperly.Include the givenactivitiesbelow. 1. Preparationof cleaningtools 2. Identifyingthe partstobe cleaning 3. Cleaningthe differentperipherals
  • 5. Scoringrubrics Drawing All assigned detailsand elementshave beenadded.The detailsare clear and easyto identify Almostall assigned details/elements (at least85%) have beenadded. The detailsare clearand easyto identify Almostall assigneddetails and elements(at least85%) have beenadded.A few detailsare difficultto identify Fewerthan85% of the assigned detailsand elementsare presentORmost detailsare difficultto identify
  • 6. Readthe informationsheet2.1verywell thenfindouthow muchyoucan rememberandhow muchyou learnedbydoingself-check2.1 Informationsheet2.1 How doyou interpretflowcharts? A Flowchartwill helpyouunderstandyourprocessanduncoverwaystoimprove itonlyif youuse it to analyze whatishappening.InterpretingyourFlowchartwillhelpyouto:  Determine whoisinvolvedinthe process  Form theoriesaboutrootcauses  Identify waystostreamlinethe process  Determine howtoimplementchangestothe process  Locate cost-added-onlysteps  Provide trainingonhowthe processworksor shouldwork Belowisa sequence of stepsthatwill helpyouthroughanorderlyanalysisof yourflowchart. Step 1 – Examine each process step for the followingconditionsthatindicatesaneedtoimprove the process: Bottlenecks. These pointsinthe processwhere itslowsdownmaybe causedbyredundantor unnecessarysteps,rework,lackof capacity,or otherfactors. Weak links. These are stepswhere problemsoccurbecause of inadequatetrainingof processworkers, equipmentthatneedstobe repairedorreplaced,orinsufficienttechnical documentation.“Informthe drill leaderandimprovise”isone of the weaklinks. Poorly defined steps. Stepswhichare not well-definedmaybe interpretedandperformedinadifferent wayby each personinvolved,leadingtoprocessvariation.“Improvise”isa poorlydefinedstepinthe weaklinkcitedabove. Step 2 – Examine each decisionsymbol. You may wantto collectdata onhow oftenthere isa“yes” or “no” answerat decisionpointsmarkedbyadiamondshapedsymbol.If mostdecisionsgoone way rather thanthe other,you maybe able toremove thisdecisionpoint.